A major new study involving 37 scientists from 18 countries has concluded that global temperature estimates since 1850 have been heavily contaminated by the growth of urban heat where the thermometers are sited. The UN-backed Intergovernmental Panel on Climate Change (IPCC) claims that urban heat accounts for less than 10% of recorded global warming, but the scientists found that figure is nearer 40%. They observe that a rural-and-urban blend of temperatures indicates a long-term warming trend of 0.89°C per century, while a rural-only collection shows only a rise of 0.55°C in the same time period.
The IPCC bets the ranch on humans causing all or most global warming in the modern age. It promotes the idea that temperatures have risen since 1850 by 1.09°C, with natural influences contributing only –0.1°C to +0.1°C – statistical-speak for zero. As I argued in the Daily Sceptic on Sunday, this is a political construction designed to promote Net Zero. Given our current state of scientific knowledge, it is impossible to calculate how much of the recent warming is due to the small amount of carbon dioxide humans produce by burning fossil fuel compared to natural climatic variations.
It is perhaps not generally known that the IPCC’s position that humans cause all global warming is mainly based on a comparison of global temperature estimates, with ‘hindcasts’ produced by computer models. The authors of the new study explain that these are retrospective ‘forecasts’ of past climate produced by CMIP6 model simulations. They argue that these simulations are contaminated by urban heat distortions, and the use of a “low solar variability” estimate. Both problems could significantly affect the IPCC anthropogenic attributions made in the fifth assessment report (AR5), and repeated in the latest edition known as AR6. The charge is that the IPCC downplays the effect of solar irradiance (sunshine) which can explain a great deal of the warming since the late 19th century.
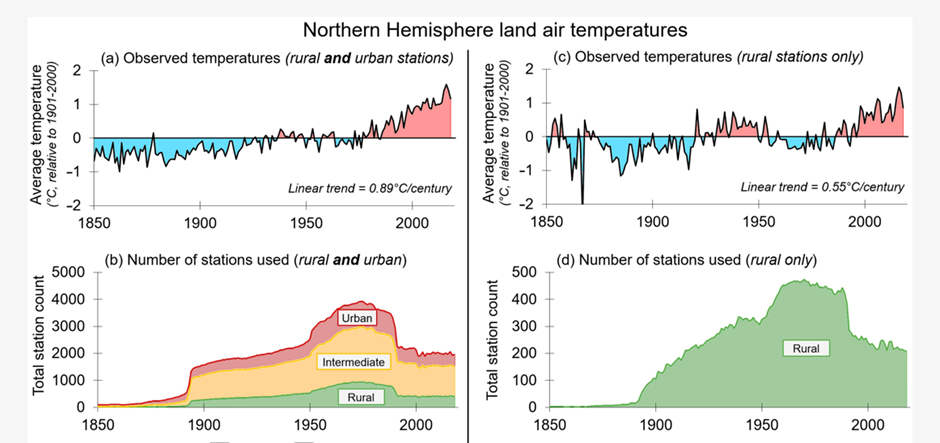
The graphs above demonstrate the two different estimates of Northern Hemisphere land air temperatures from 1850-2018. Both series were generated from the Global Historical Climatology Network (GHCN), a database of temperature records from 180 countries compiled by the U.S. weather service NOAA. They show clearly that in rural areas away from heat generated by humans, the warming is much less, particularly in recent times during a period of large urban expansion. It is obvious that temperatures avoiding any human corruption provide the best guide to any long-term climate trend.
This latest paper, published in the scientific journal Climate, is one of a series of academic warnings that global temperature datasets are severely contaminated by unadjusted urban heat effects. The IPCC continues to hide its head in the sand, stating that no recent findings have emerged to alter its view that any uncorrected effects from urbanisation, or from changes in land use or cover, have raised land surface air temperature trends by more than 10%. The IPCC was set up in 1988 only to look at human influences on the climate, so it is not hard to understand why it doesn’t seem to try very hard to investigate the problem. No such reticence holds back Dr. Roy Spencer and Professor John Christy of the University of Alabama in Huntsville. They looked at the GHCN and found that up to a fifth of all global warming reported by 20,000 weather stations was invalid due to corruptions from non-climatic data. Worse, they found that NOAA, far from removing urban heat distortions, was on average “spuriously warming station temperature data trends when it should be cooling them”.
The U.S. meteorologist Anthony Watts has spent the last decade highlighting the numerous flaws built into global temperature datasets. Data are collected by Government bodies from a weather station network “that was never intended to detect a global warming signal”, he notes. His seminal work recently found that 96% of U.S. weather stations are “corrupted” by the localised effects of urbanisation. The American temperature data form an important part of the over-heating global record. In Watt’s view, there is only one weather station network accurate enough to detect a climate change signal. It was set up in 2005 by NOAA as a state-of-the art system using 114 stations across the States specifically located away from any non-climatic effects like urban heating.
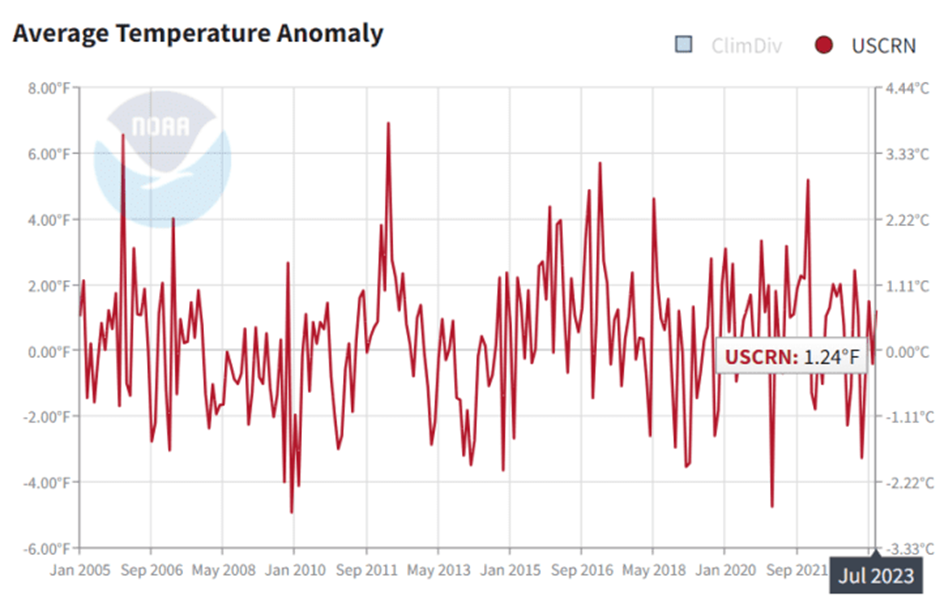
The network is called the U.S. Climate Reference Network and its findings over the last 18 years can be seen in the graph above. It shows little warming over this period, a fact that leads Watt to conclude that its findings are “buried” by the U.S. Government.
Far from correcting global warming figures, the main temperature datasets have a habit of retrospectively adjusting upwards many of their past results. Recently, Professor Ole Humlum noted that since January 2008, NASA had boosted warming identified at its GISS service by 49% between 1910-2000, a rise in temperature from 0.45°C to 0.67°C. Similar retrospective rises were also spotted by the recently-published report from Clintel, noting that the state-funded U.K. Met Office had boosted temperature by 38%, or 0.2°C, in the previously pause-ridden period from 2000-2020. The Met Office’s HadCRUT5 is also said to have cooled the period 1850-1900 by 37%, although why it took so long to get around to this last task is a bit of a mystery. It does however improve the ‘hockey stick’ temperature look, and that is most helpful to political promoters of Net Zero collectivisation.
The current state of play is well summed up by the 37 scientists who noted in their recently published paper: “The scientific community is not yet in a position to confidently establish whether the warming since 1850 is mostly human-caused, mostly natural, or some combination.”