


U.S. energy drillers added rigs at the fastest pace in years this week, with Baker Hughes reporting a solid +7 increase in the active rotary rig count to 558 for the week ending May 22, 2026. This marks the largest weekly gain in recent memory and extends a four-week streak of increases—the first such sustained uptrend in quite some time.
The move higher was driven overwhelmingly by oil-directed rigs, which surged +10 to 425. Gas rigs slipped -3 to 125, with miscellaneous rigs steady at 8. Oil now accounts for roughly 76% of the active U.S. fleet.
While the total count remains down about 8 rigs year-over-year (from 566 in late May 2025), the momentum is unmistakable after a prolonged period of disciplined restraint by producers.
Four Weeks of Gains Signal Shifting Sentiment
Baker Hughes data shows a clear positive inflection:
May 22, 2026: 558 total (+7 WoW), Oil 425 (+10), Gas 125 (-3)
May 15, 2026: 551 total (+3), Oil 415 (+5)
May 8, 2026: 548 total (+1), Oil 410 (+2)
May 1, 2026: 547 total (+3), Oil 408 (+1)
This streak of four consecutive weekly gains stands out against the more muted or flat activity seen through much of 2025 and early 2026.
Basin and State Snapshot: Permian Still King, Oil Focus Sharpens
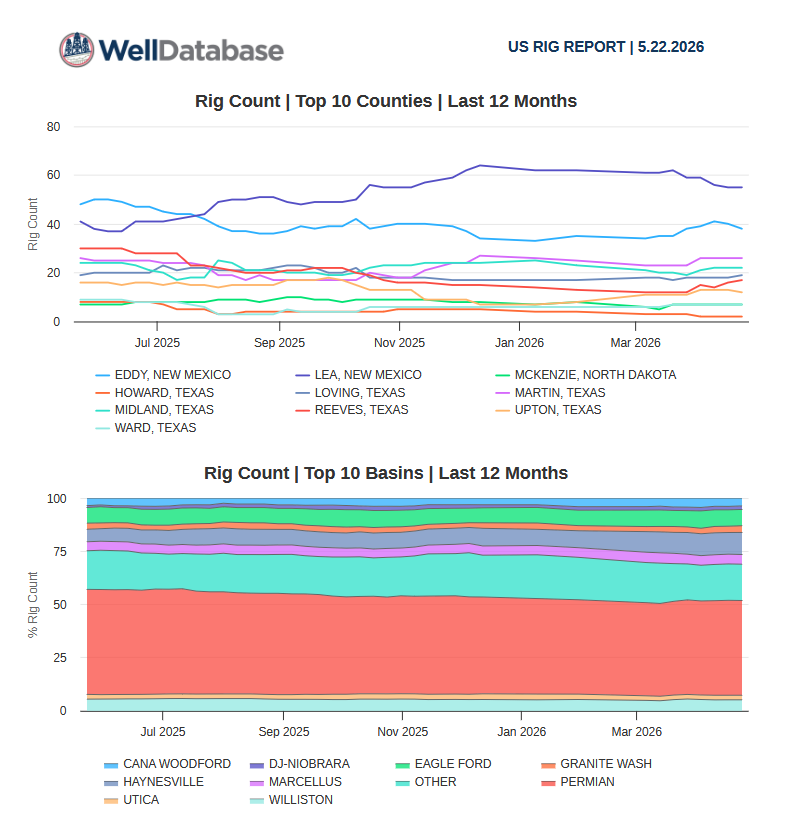
The Permian Basin (Texas/New Mexico) remains the undisputed heavyweight, with Enverus daily tracking showing roughly 243–245 rigs in mid-May, stable to slightly higher recently and still representing the lion’s share of U.S. activity (primarily oil-directed).
Other key basins (approximate recent levels from Baker Hughes and Enverus data):
Eagle Ford (South Texas / Gulf Coast): ~42–68 rigs (mixed, with oil component)
Haynesville (Louisiana/Texas/Arkansas): ~55 rigs (gas-weighted)
Williston/Bakken (North Dakota/Montana): ~27–30 rigs
Anadarko (Oklahoma): Mid-40s range in recent months
Appalachia/Marcellus/Utica: ~35–40 rigs combined (predominantly gas)
State-level leaders typically include Texas (230+ rigs), New Mexico (strong Permian contribution), North Dakota, Oklahoma, and Louisiana. Gains this week appear concentrated in oil-leaning areas, aligning with the sharp rise in oil-directed rigs.
Enverus’ GPS-tracked daily rig count (which often runs higher than Baker Hughes’ weekly rotary snapshot due to methodology) has hovered in the 600+ range recently, providing a real-time complement to the traditional Baker Hughes numbers.
What the Increase Means for Investors
This uptick is a net positive signal for the sector, though it comes from a relatively low base:
Oilfield services companies (rig contractors, pressure pumpers, and equipment providers) stand to benefit first from rising utilization and day rates.
E&P operators with strong Permian, Eagle Ford, or other inventory positions may see improved well economics, especially with WTI crude holding in the mid-to-high $90s amid geopolitical tightness.
The move reflects producer confidence after years of capital discipline, share buybacks, and debt reduction. However, companies are unlikely to abandon restraint entirely—expect measured growth rather than a 2010s-style boom.
Risks remain: A sharp pullback in oil prices or renewed regulatory pressure could quickly reverse the trend. Sustained gains will depend on oil staying above key breakeven levels for shale.
Overall, the data support a cautiously constructive near-term outlook for upstream activity and related services.
Implications for Consumers and Energy Markets
For American consumers and the broader economy, more domestic drilling is generally favorable:It reinforces U.S. energy security and reduces reliance on imports or volatile global supplies.
Higher rig activity today translates into future production growth (with a lag of several months), which can help moderate price spikes when combined with efficiency gains.
U.S. crude output remains resilient near 13.6 million barrels per day (recent EIA and industry estimates), close to record levels despite fewer rigs than in prior years—thanks to longer laterals, better completions, and operational improvements.
That said, near-term prices are still heavily influenced by geopolitics (e.g., Middle East tensions), OPEC+ decisions, and global demand. The rig increase is a bullish domestic supply signal but not yet a game-changer for pump prices or heating bills in the immediate term.
Bottom Line
After an extended period of flat-to-down rig counts, the latest Baker Hughes report delivers welcome momentum—particularly in oil-directed drilling. The Permian continues to anchor activity, while the four-week increase streak suggests operators are responding to supportive prices and solid fundamentals.
For investors, it’s a green light for selective exposure to services and well-positioned producers. For consumers, it’s another brick in the wall of U.S. energy abundance.
The trend bears watching closely in the coming weeks. If the gains continue, 2026 could shape up as a year of modest but meaningful drilling recovery.
Appendix: Sources and LinksPrimary Data Sources
- Baker Hughes Rig Count (official): https://rigcount.bakerhughes.com/ and North America reports (latest May 22, 2026 data)
- American Oil & Gas Reporter (AOGR) detailed weekly Baker Hughes tables: https://www.aogr.com/web-exclusives/us-rig-count (2026 archive)
- Enverus Daily Rig Count (granular basin/play data): https://www.enverus.com/dailyrigcount/
- Reuters coverage of Baker Hughes reports (May 2026)
Production & Market Context
- U.S. Energy Information Administration (EIA) Short-Term Energy Outlook and production data: https://www.eia.gov/outlooks/steo/ and https://www.eia.gov/dnav/pet/pet_crd_crpdn_adc_mbbl_m.htm
- Trading Economics / Baker Hughes historical rig series
- Welldatabase.com
Additional Context & Reporting
- Discovery Alert and industry summaries referencing Baker Hughes/Enverus (May 2026)
- Various Reuters, Oil & Gas 360, and Petroleum News articles on weekly counts (April–May 2026)
All data cross-referenced as of May 22, 2026. Rig counts are weekly (Baker Hughes) or daily (Enverus) snapshots and subject to minor revisions. For the absolute latest figures, always check the official Baker Hughes site on release days (typically Fridays).Energy News Beat – Your source for clear, no-nonsense energy intelligence. Would you like me to format this as a downloadable PDF, Word doc, or add any charts/images for the channel?