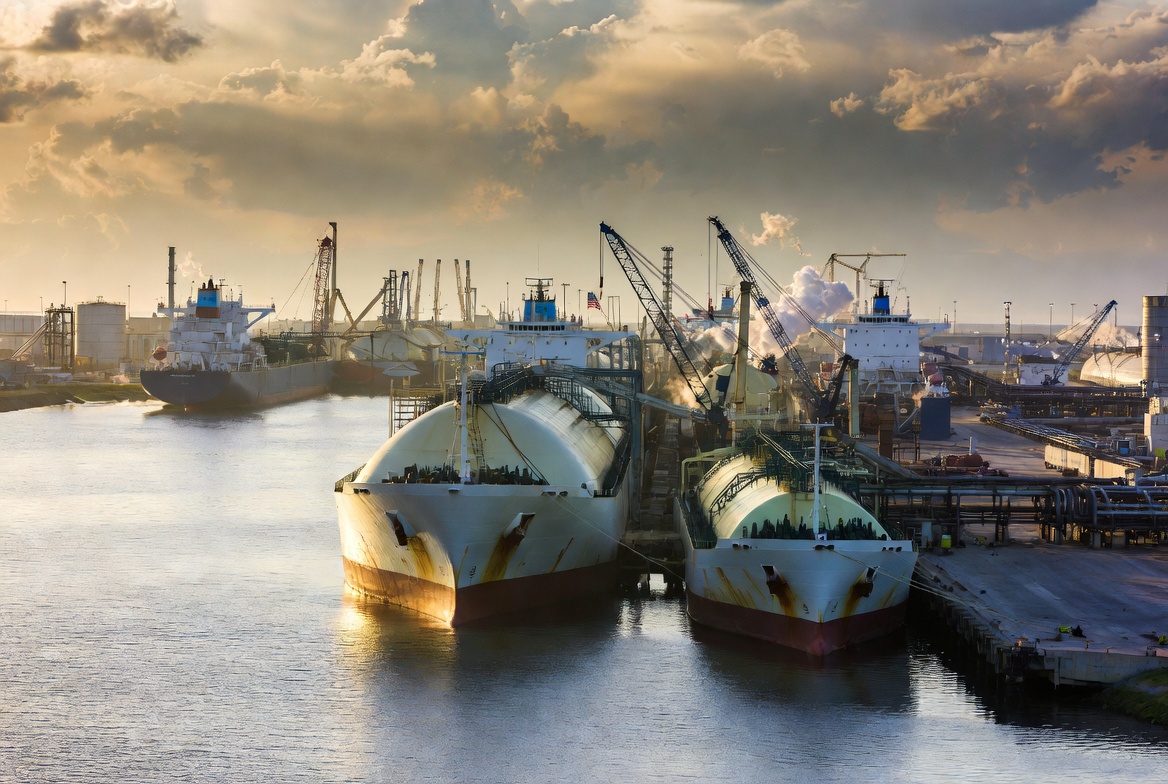
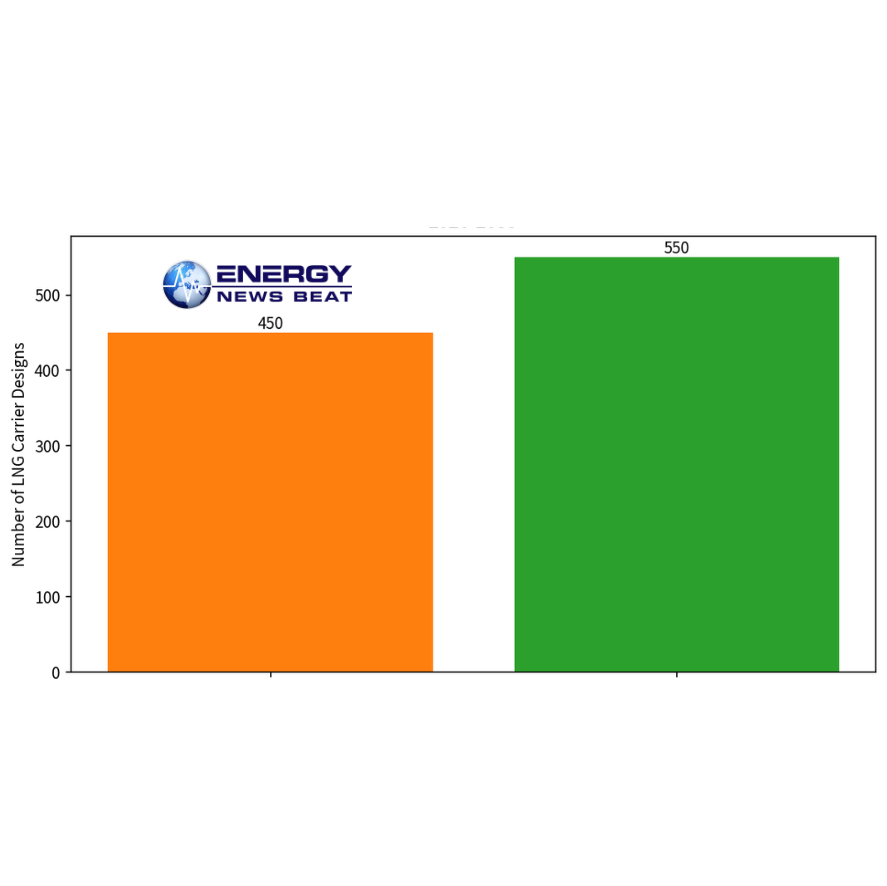
Global demand for liquefied natural gas (LNG) carriers is set to be significantly stronger than previously expected over the next decade. French containment-system specialist Gaztransport & Technigaz SA (GTT) has raised its forecast for LNG carrier gas-containment system design orders to about 550 vessels in the 2026–2035 period, up from its earlier estimate of more than 450.
The upward revision is driven by a surge in final investment decisions (FIDs) for new export terminals, led by the United States. FIDs covered 84 million tonnes per annum (mtpa) of new liquefaction capacity in 2025, followed by another 37 mtpa in the first half of 2026, with an additional 29 mtpa receiving limited notices to proceed. GTT CEO François Michel noted there are “no sign[s] of slowdown in investment in LNG,” even amid Middle East conflict.
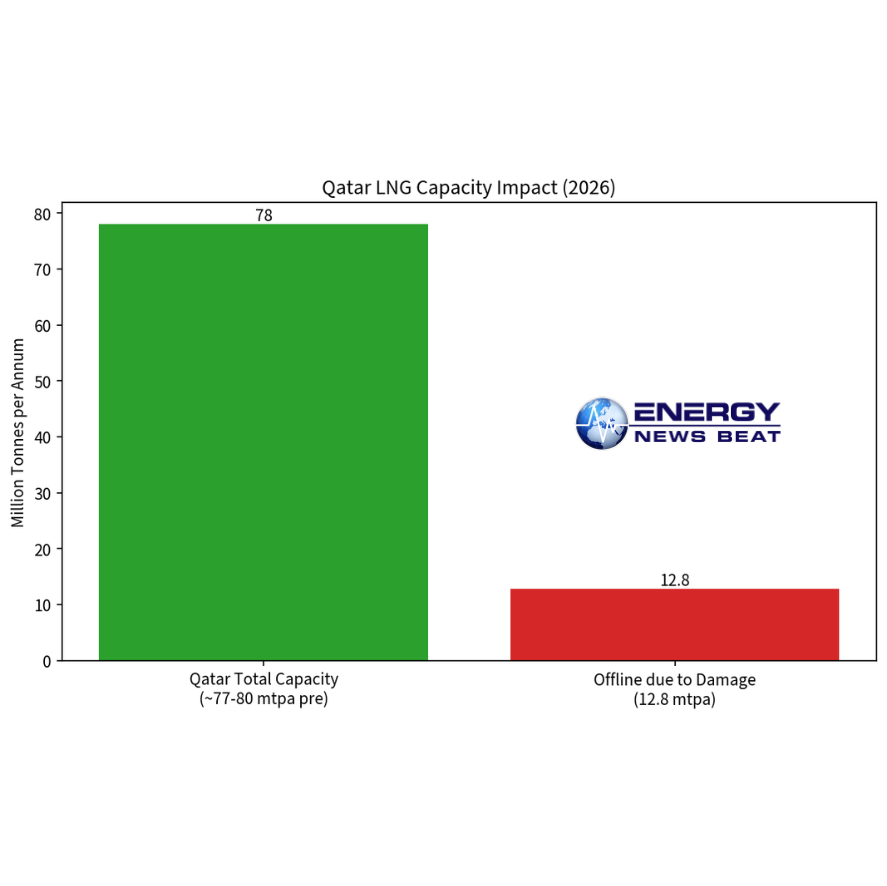
This comes as Qatar—the world’s second-largest LNG exporter—has substantial capacity offline. Iranian attacks in March 2026 damaged facilities at Ras Laffan, knocking out about 17% of Qatar’s LNG export capacity (12.8 mtpa) for an estimated three to five years, with associated revenue losses around $20 billion annually and force majeure declarations on some contracts. Strait of Hormuz disruptions have further constrained roughly 20% of global LNG flows at times.
Global Demand vs. Supply by Producer and Customer
Global LNG trade hit a record 437 million tonnes in 2025 (up 6.3% year-on-year), with liquefaction capacity reaching 524.5 mtpa by year-end. The United States was the largest exporter at 110.7 million tonnes. The US, Qatar, and Australia together accounted for roughly 63% of global exports.
New supply is ramping in the Atlantic Basin, particularly the US Gulf Coast (projects including Golden Pass ~15.6 mtpa, Plaquemines expansions, Corpus Christi Stage 3, Rio Grande, Port Arthur, and others). Additional volumes are expected from Canada, Australia (Pluto Phase 2), and remaining Qatar North Field elements, though timelines face delays. Kpler and others previously anticipated ~37 mtpa of new capacity in 2026, but Qatar-related outages and project slips have tempered net supply growth. Shell’s 2026 Outlook notes 2026 trade volumes could end similar to 2025 if Hormuz shipping normalizes, before stronger growth resumes in 2027; longer-term demand is projected to reach nearly 700 million tonnes per year by 2050 (about 65% growth from 2025 levels).
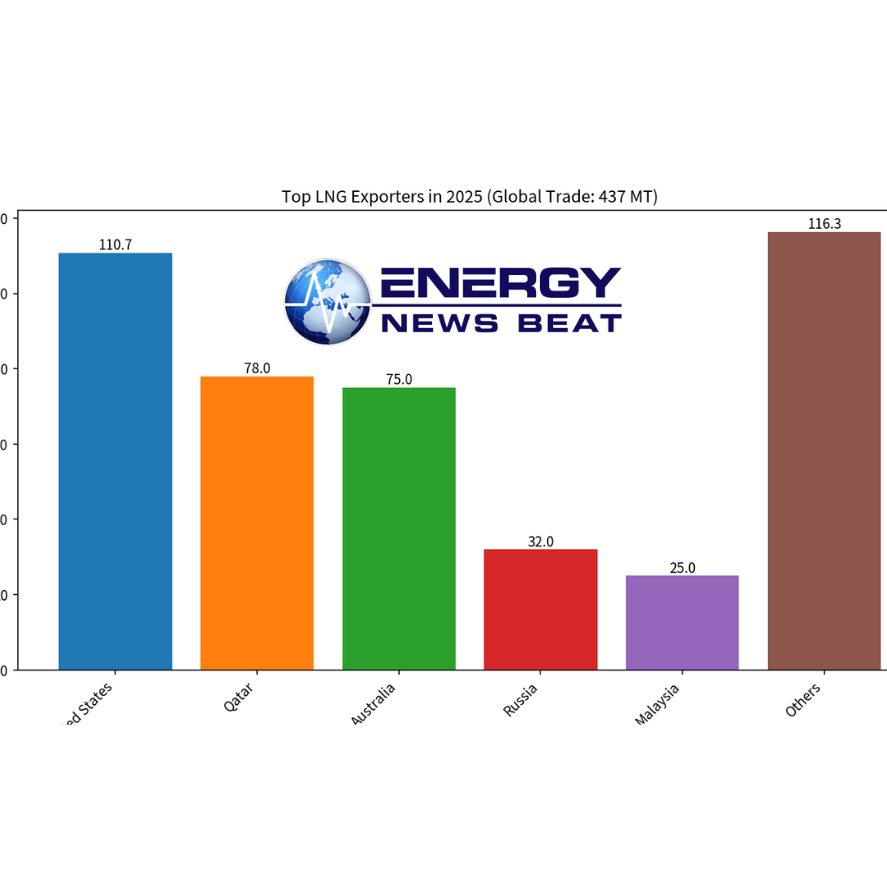
Approximate 2025 exporter volumes compiled from IGU, EIA, and related tracking data (Others residual to reach ~437 MT total trade). Qatar volume reflects pre-disruption levels; actual 2026 exports are reduced.
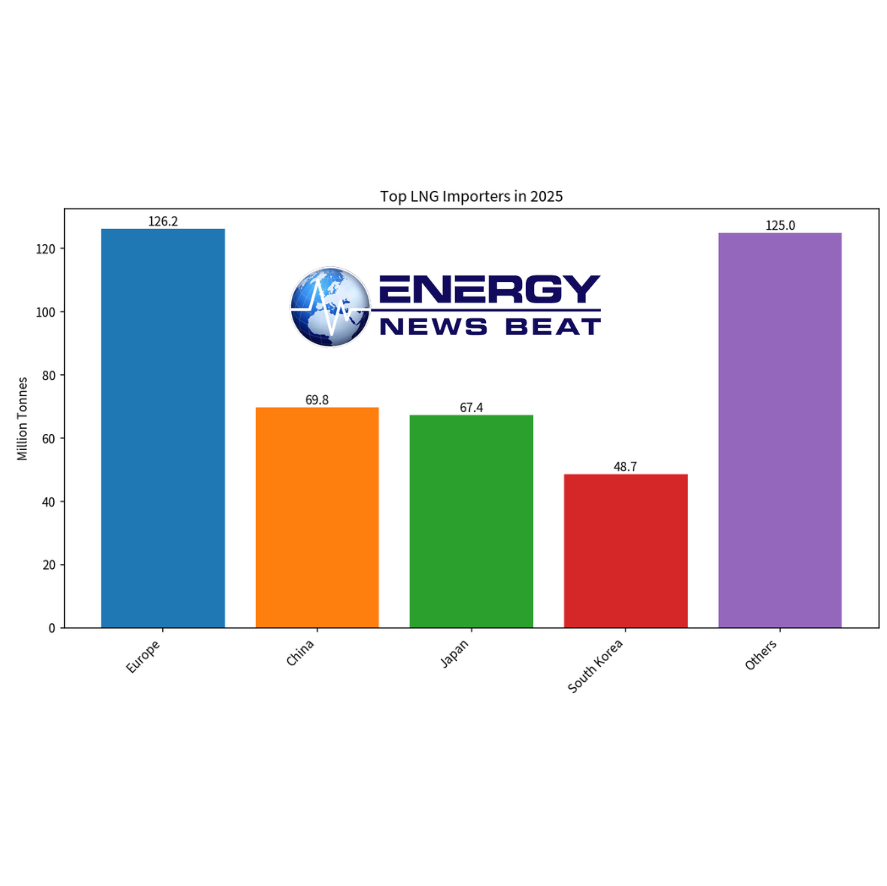
On the demand (customer) side, Europe recorded the strongest import growth in 2025 (+26.1 million tonnes to 126.2 million tonnes) as it continued displacing residual Russian pipeline gas and managing storage. Asia-Pacific remained the largest importing region overall. China was the top single-country importer at 69.77 million tonnes (down year-on-year amid higher domestic production and pipeline imports), followed by Japan (67.37 million tonnes) and South Korea (48.67 million tonnes). Price-sensitive buyers in South and Southeast Asia faced demand destruction from elevated spot prices during the conflict (peaks above $20/MMBtu), while Europe and some Asian buyers competed for available Atlantic cargoes.
Supply growth from US projects is structurally well-positioned to serve both European energy-security needs and recovering Asian demand once prices moderate and Qatari capacity is restored. Longer-haul trades and overall volume expansion continue to support vessel requirements.
Who Is Building the Ships
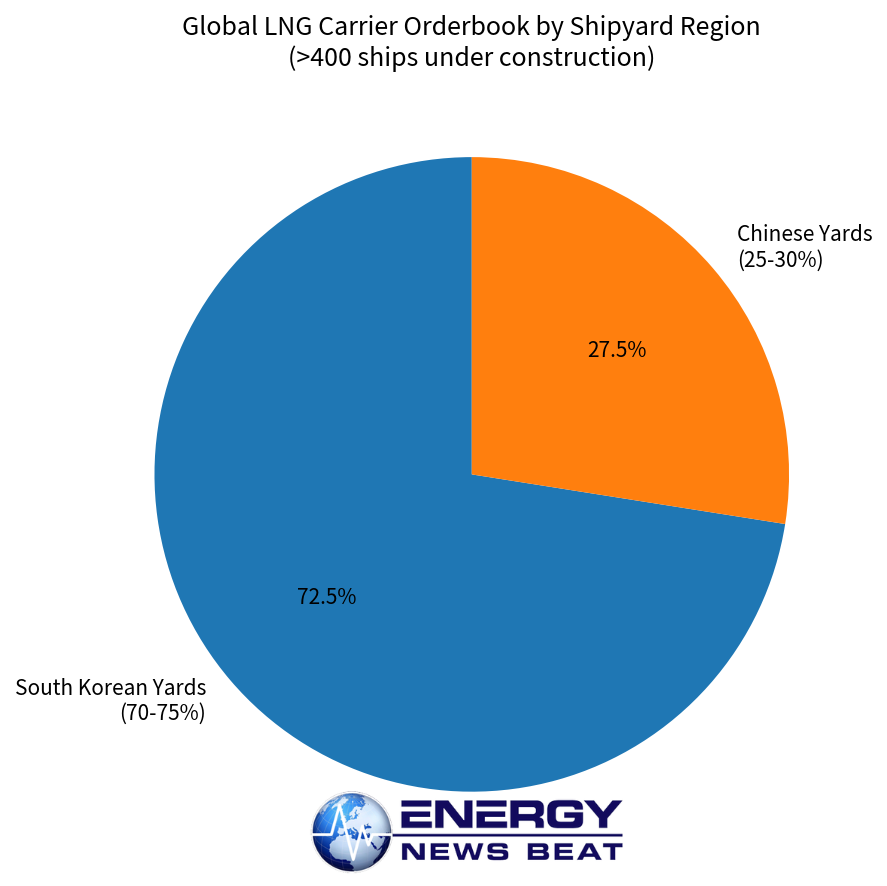
South Korean shipyards dominate the LNG carrier orderbook (roughly 70–75% share), led by Hyundai Heavy Industries (including Hyundai Samho), Samsung Heavy Industries, and Hanwha Ocean (formerly Daewoo). Chinese yards (primarily Hudong-Zhonghua and Jiangnan under CSSC) have captured 25–30% with competitive pricing. The global orderbook exceeds 400 vessels (around 45–50% of the existing fleet of roughly 850 active ships), with deliveries peaking in the late 2020s. Standard newbuild prices for a 174,000 cbm carrier run $200–220 million, with Korean yards commanding a premium.
GTT, which designs the membrane containment systems used on the majority of modern LNG carriers, reported a strong first-half 2026 order intake (56 LNG carriers) and a backlog of 272 such units. Delivery schedules point to 100–120 vessels in 2026 and similar or higher numbers in subsequent years.
Who Is Buying the Ships
Major buyers and owners include:
QatarEnergy and Nakilat (Qatar Gas Transport Company): The largest single program. QatarEnergy has ordered or committed to around 128 new LNG carriers (including conventional sizes and ultra-large QC-Max 271,000 cbm vessels) to support North Field expansion. Nakilat owns/operates significant portions under long-term charters; construction is split between Korean yards (Hyundai, Hanwha Ocean) and Chinese yards (Hudong-Zhonghua). Deliveries continue into the late 2020s, though conflict-related issues have led to some charter deferrals.
US project developers and offtakers: Cheniere, Venture Global, NextDecade, ExxonMobil/QatarEnergy (Golden Pass), and others drive demand via long-term charters or shipping arrangements tied to new Gulf Coast capacity. Portfolio players such as Shell, TotalEnergies, and others secure vessels for their growing US and global positions.
Independent and other owners: Shipping companies (including Japanese and Chinese owners such as MOL, COSCO affiliates, China Merchants) and specialized LNG carriers operators take long-term time charters from producers or trade on the spot/charter market.
The combination of US-led liquefaction growth, the need to replace/augment fleets for longer average voyage distances in some trades, and replacement of older vessels underpins the elevated GTT forecast and the current orderbook boom.
The outlook remains constructive for vessel demand through the early 2030s, even after accounting for Qatar’s temporary capacity loss, provided FIDs continue and demand recovers with normalizing prices and supply. Energy News Beat will continue monitoring project startups, charter rates, and further GTT or shipyard updates.
- Bloomberg: “LNG Vessel Demand Climbs as US Leads Project Growth, GTT Says” (28 July 2026) — https://www.bloomberg.com/news/articles/2026-07-28/lng-vessel-demand-climbs-as-us-leads-project-growth-gtt-says
- TT News / related GTT coverage: https://www.ttnews.com/articles/lng-build-forecast-rises-us
- International Gas Union World LNG Report 2026 press release: https://www.igu.org/press-releases/world-lng-report-2026
- Reuters on Qatar capacity damage: https://www.reuters.com/business/energy/iran-attack-damage-wipes-out-17-qatars-lng-capacity-three-five-years-qatarenergy-2026-03-19/ and https://www.reuters.com/business/energy/iran-war-damage-qatar-hits-global-lng-outlook-upends-asia-demand-growth-2026-03-26/
- Shell LNG Outlook 2026: https://www.shell.com/news-and-insights/newsroom/news-and-media-releases/2026/lng-outlook-2026.html
- Kpler market drivers 2026: https://www.kpler.com/blog/natural-gas-and-lng-top-5-market-drivers-for-2026
- Shipfinex LNG carrier construction/orderbook analysis: https://www.shipfinex.com/blog/lng-carrier-construction-activity-orderbook
- EIA and related US capacity trackers: https://www.eia.gov/todayinenergy/detail.php?id=66384 and GIIGNL/EIA trade data references
- QatarEnergy/Nakilat fleet orders coverage (examples): Offshore Energy, Maritime Executive, Rigzone reports on 2024–2025 orders for ~128 vessels
- Additional context from IEA Global LNG Capacity Tracker, Oxford Institute for Energy Studies, and industry trackers on FIDs and regional balances.
Charts generated from publicly reported aggregates (IGU, EIA, GTT, shipyard analyses, Reuters/Kpler) for illustrative purposes; exact residual “Others” volumes and minor exporter/importer figures are approximated to published totals. Data as of late July 2026.