
AI data centers, LNG tankers and the power plants that keep your lights on all want more of the same molecules. The gas is there, but the pipes, the winter weather, competitive price points, capacity/transportation availability and the rules decide who gets it, and at what price. A Special Edition on demand, supply, grid risk, coal and nuclear as the bridge, and the gas we lose before it ever reaches you.
By Stuart Turley, host of the Energy News Beat podcast • Steve Reese, CEO, Reese Energy Consulting • Published Oct. 15, 2026 • EIA forecast data as of the Oct. 6, 2026 Short-Term Energy Outlook • Futures as of the Oct. 14 settlement • Analysis and opinion; Stu’s views are labeled • Not investment advice
Start with your bill
As of the EIA Short-Term Energy Outlook released Oct. 6, 2026 (next update Nov. 10)
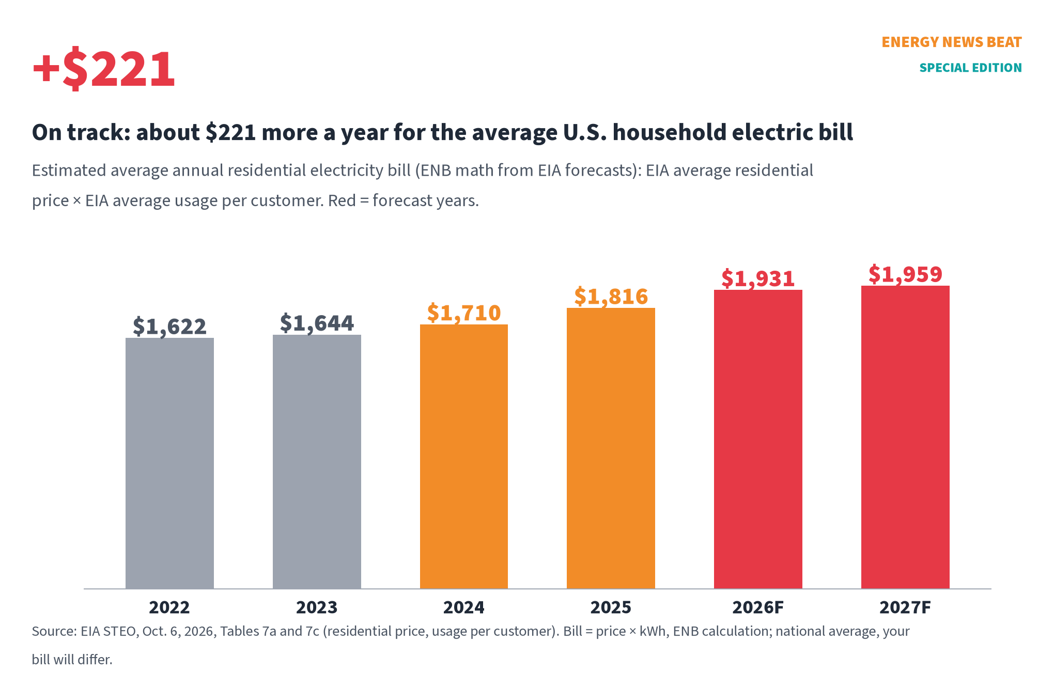
Here is the number that matters at the kitchen table. ENB math from EIA’s forecasts: the average American household is on track to spend about $1,931 on electricity this year, up from about $1,710 in 2024. That is roughly $221 more a year, or about $18 a month, before a single new data center plugs in near you. We got there by multiplying EIA’s average residential price (18.24¢ per kWh in 2026) by its average use per home (about 10,587 kWh) (EIA STEO; ENB calculation).
Where you live changes the story. In July, households in Massachusetts paid 30.49¢ a kWh and New Yorkers paid 29.90¢, up 14% from a year earlier. Texans paid 15.88¢. The national average was 18.31¢ (EIA Electric Power Monthly, Table 5.6.A). On a 1,000-kWh month, that is about $305 in Massachusetts against $159 in Texas (ENB calculation).
This Article is written jointly with Steve Reese, CEO, Reese Energy Consulting and Stu Turley, Energy News Beat, and we will be covering this article on a future episode with Steve and Stu on the Energy News Beat Podcast.
Natural gas is the reason those numbers move together. It made about 40% of America’s electricity in 2026, by EIA’s count, and about 57% of New England’s in 2024 (EIA STEO, Table 7d; ENB calculation). Gas itself is not expensive right now. November gas futures settled at $3.198 per MMBtu on Oct. 14 (CME settlement via FinancialJuice). The fight is over who gets the next molecule: the LNG tanker in Louisiana, the AI campus in Virginia or Texas, the factory, or the power plant that heats your home in January.
| The 60-second version
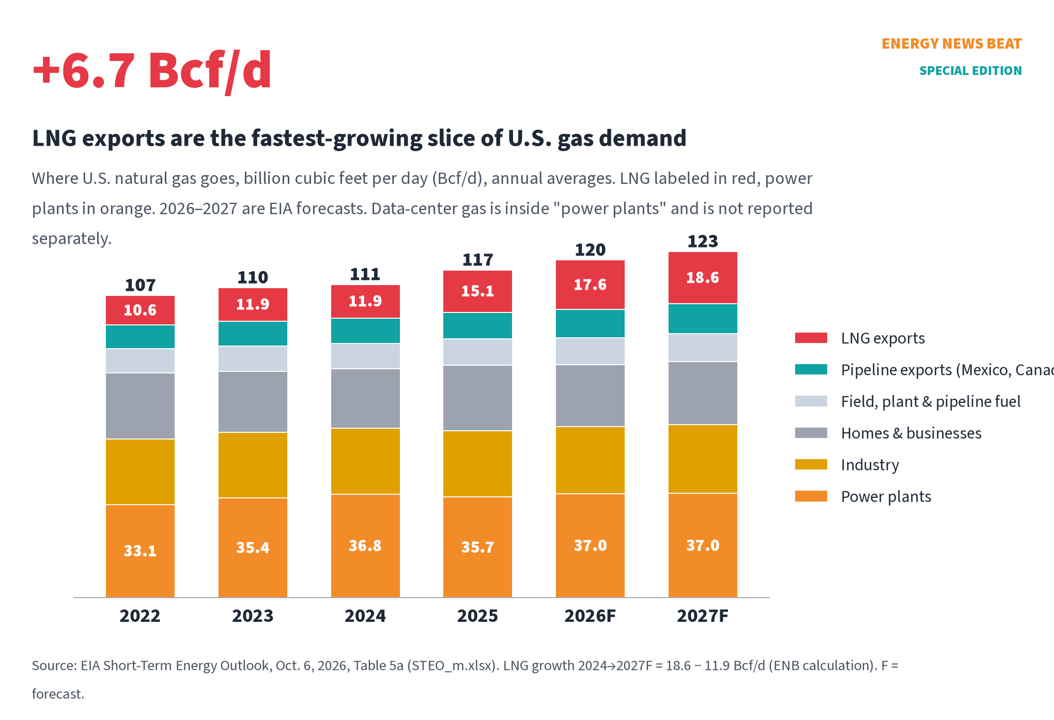
Demand: U.S. LNG exports averaged 10.6 Bcf/d in 2022. EIA expects 17.6 in 2026 and 18.6 in 2027 (EIA STEO). Data centers used about 4.4% of U.S. electricity in 2023. LBNL’s new reference case has them at 11.8% by 2030 (LBNL 2024; LBNL 2025 Update). Wall Street estimates for the gas behind them, as reported, run from +4.8 Bcf/d (Morgan Stanley via Investing.com) to +6.1 Bcf/d (RBC Capital Markets) by 2030. Supply: The gas is there. Production keeps rising and the Permian keeps getting gassier, at about 4.34 Mcf of gas per barrel of oil in 2026 (EIA STEO; ENB calculation). The bottleneck is pipe. Waha gas in West Texas hit −$9.52 in April (NGI), while New England burned oil and imported LNG during January’s cold snap (ISO-NE market monitor). Grid risk: Gas is the backbone, and its weak spot is the deep freeze. Winter Storm Fern shut in 18.3 Bcf/d of production at its peak (Wood Mackenzie). The grid held, but NERC’s CEO said it came “close to the edge” (FERC-NERC). The bridge: DOE is using emergency orders to keep coal units running. Crane (Three Mile Island) is due back in 2027, Palisades is paused after a fuel-handling problem, and TVA holds the first SMR construction permit but no start date (DOE 202(c); Inquirer; Federal Register). Make every molecule count: America vented and flared about 0.92 Bcf/d in 2024 (EIA; ENB unit conversion). Better measurement, fewer leaks and less flaring will not replace a pipeline, but they turn waste into sales and royalties. Much like AI – AI is worthless without verification, and natural gas can’t be invoiced, billed or accounted for unless you have the right tools and accounting procedures in place. |
| Stu’s Take (opinion)
Energy security starts at home. Before we argue about who gets the gas, we owe American families power they can afford in January. I am bullish on LNG. Exports went from 0.5 Bcf/d in 2016 to 15.0 Bcf/d in 2025. That is energy dominance you can load on a ship, and it pays American workers and royalty owners. But exports are heading toward 18.6 Bcf/d in 2027, so we have to build the pipes at home to match. New England paid $6.53 billion for one winter of wholesale power, up 45%, as a cold snap drove gas to $17.79 and forced oil and LNG burn (ISO-NE IMM). In my view, blocked pipelines like Constitution are a big reason the region is so exposed (ENR on Constitution). Data centers are welcome, if they bring their own power or pay for it. A tech company should not be able to push the on-track $221-a-year bill increase (ENB math from EIA) any higher for a retired teacher in Ohio. The Energy Bad Boys (Isaac Orr and Mitch Rolling of Always On Energy Research, a mandate-critical energy think tank) put new gas at $60–86/MWh for round-the-clock data center load, the cheapest option in every grid region they studied. Do not shut down coal plants that still work until the replacement is running. Coal is the bridge and nuclear is the destination. The Vogtle bill, about $35 billion, tells you the bridge has to last a while. And let us stop wasting gas: 0.92 Bcf/d vented and flared is more than one Golden Pass train. |
Part 1. Who wants the gas
LNG: the biggest new customer is already here
As of EIA Today in Energy, Sept. 1, 2026; DOE filing Oct. 1, 2026
LNG is not a forecast anymore. U.S. LNG exports averaged 17.4 Bcf/d in the first half of 2026, up 23% from a year earlier. Plaquemines LNG was running at full capacity, and Corpus Christi Stage 3 was on six of its seven trains. Together the two projects add 4.0 Bcf/d of nominal capacity (EIA). Cheniere declared Stage 3 complete on Aug. 28, bringing its platform to about 56 million tonnes a year (Cheniere). Golden Pass in Texas shipped its first cargo in April (EIA). Its Oct. 1 report to DOE says Train 2 is still being commissioned (Golden Pass filing to DOE).
The world wants it. Europe’s TTF benchmark averaged $14.74 and Asia’s JKM $15.56 per MMBtu in the first half, and U.S. exports to Asia rose 108% (EIA). The IEA says the Strait of Hormuz disruption has affected around 20% of global LNG trade flows (IEA Global Methane Tracker 2026; see our Hormuz coverage). That is why EIA has U.S. exports averaging 17.6 Bcf/d this year and 18.6 next year (STEO). From 2024 to 2027 that is +6.7 Bcf/d, more new demand than any other use of gas (ENB calculation).
More is coming. At the end of October 2025, EIA counted 15.4 Bcf/d of U.S. export capacity and 13.9 Bcf/d more planned through 2029 (EIA). EIA also says U.S. capacity will nearly double by 2031 compared with December 2025 (EIA).
Data centers: big numbers, wide ranges
As of LBNL June 2026; EPRI Feb. 2026; ERCOT Apr. 15, 2026; PJM Jan. 2026; NERC Jan. 29, 2026
Every serious forecast says data centers will use a lot more power. They disagree on how much. Lawrence Berkeley National Laboratory found data centers used 176 TWh in 2023, about 4.4% of U.S. electricity (LBNL 2024). Its June 2026 update puts them at 649 TWh in 2030, or 11.8%, with a range of 521–843 TWh (LBNL 2025 Update). EPRI’s range is 9% to 17% of U.S. electricity by 2030, up from 4–5% now (EPRI).
The grid operators see the same wave. ERCOT’s preliminary forecast has Texas peak demand reaching 367,790 MW by 2032. The all-time record is 85,508 MW. ERCOT itself says the number will be revised once it sorts real projects from speculative ones (ERCOT). PJM, the largest U.S. grid, expects its summer peak to reach about 222,106 MW in 2036, up 65,733 MW in ten years (PJM). NERC’s forecast of 10-year growth in North American summer peak demand has gone from 55 GW in its 2022 LTRA to 224 GW in its 2025 LTRA (NERC). EIA expects commercial-sector power sales, the category that includes data centers, to grow 3.8% in 2026 (EIA).
Chart 3. NERC’s North American 10-year summer peak-demand growth forecast, by assessment year (GW). Source: NERC 2025 LTRA.
How much of that is gas? The wide range comes from the assumptions. Morgan Stanley’s probability-weighted base case is +4.8 Bcf/d by 2030, as reported by Investing.com (Investing.com). RBC’s Christopher Louney puts data-center gas at about 6.1 Bcf/d by 2030 (RBC Capital Markets). East Daley Analytics has used 4.2–6.1 Bcf/d, assuming gas covers about 40% of the new load, as reported on its site (East Daley). EQT, the country’s largest gas producer and an interested party, sees about 10 Bcf/d of new gas-fired power demand by 2030 in its base case and 18 in its upside case, counting both data centers and coal retirements (EQT).
The mandate-critical side of the debate is blunter. Isaac Orr and Mitch Rolling of the Energy Bad Boys (of Always On Energy Research, a mandate-critical energy think tank) modeled 24/7 data-center load in seven grid regions. They found new gas at $60–86 per MWh was the lowest-cost option in every one. Wind, solar and batteries sized to run around the clock cost $307/MWh in ERCOT, their cheapest region, about five times gas (Energy Bad Boys). They also count 151 GW of data-center-dedicated gas projects in states Trump won, against 6.25 GW in states he lost (Energy Bad Boys).
Their think tank, Always On Energy Research, warns against counting chickens. Georgia Power cut its forecast by 6 GW, and AEP Ohio’s requests fell from 30 GW to 13 GW once a tariff made customers put money down. PG&E reports data-center load factors near 67%, not the 80–90% many planners assume. If utilities overbuild for load that never shows up, ratepayers carry the stranded cost (AOER).
Plain-English takeaway: LNG is the bigger near-term claim on gas, and it is mostly under contract. Data centers are the bigger question mark. Both point the same way: more gas, more pipe, and more pressure on the power plants that serve you. For more, see ENB’s earlier pieces on the new energy boom, 20-year gas and LNG demand and whether data centers are raising rates.
Part 2. Where the gas comes from, and where it gets stuck
The Permian is getting gassier
As of EIA STEO Oct. 6, 2026; Waha prices through Oct. 9, 2026
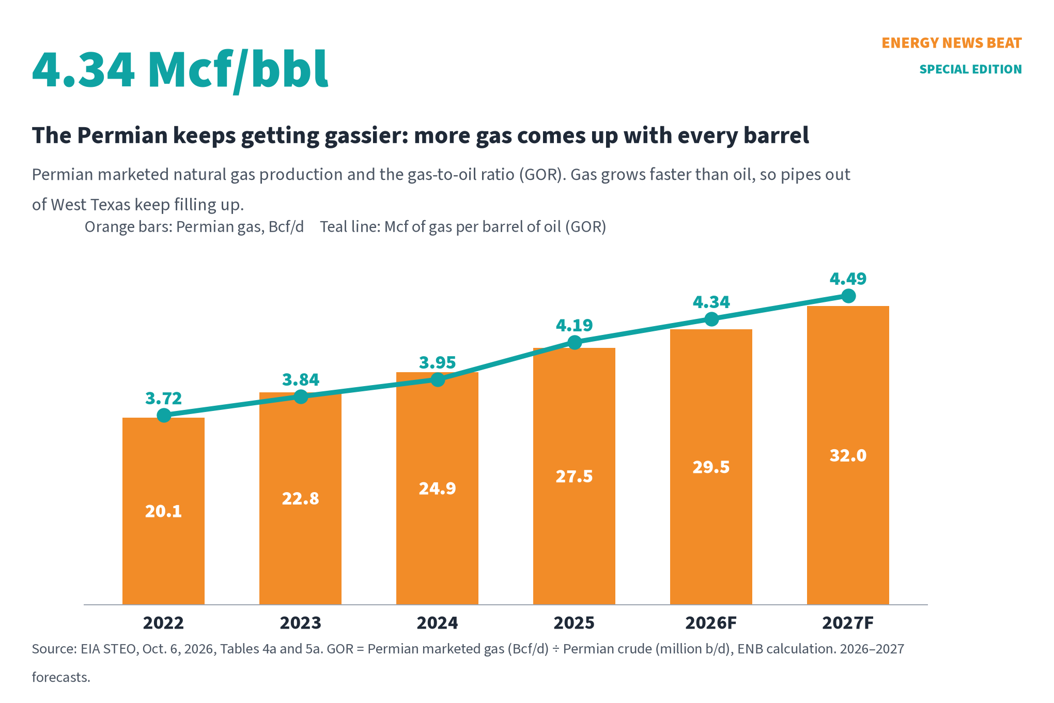
Most new U.S. gas does not come from gas wells. It is associated gas rich in NGLs that comes up with oil in West Texas and New Mexico. EIA’s numbers show Permian gas rising from 20.1 Bcf/d in 2022 to 29.5 in 2026 and 32.0 in 2027. Oil grows more slowly, so the gas-to-oil ratio climbs from 3.72 to 4.49 Mcf per barrel (EIA STEO; ENB calculation). U.S. marketed gas production rises from 113.1 Bcf/d in 2024 to 127.9 in 2027 (EIA STEO).
Chart 5. Permian marketed gas (bars) and gas-to-oil ratio (line), 2022–2027F. Source: EIA STEO; ENB calculation.
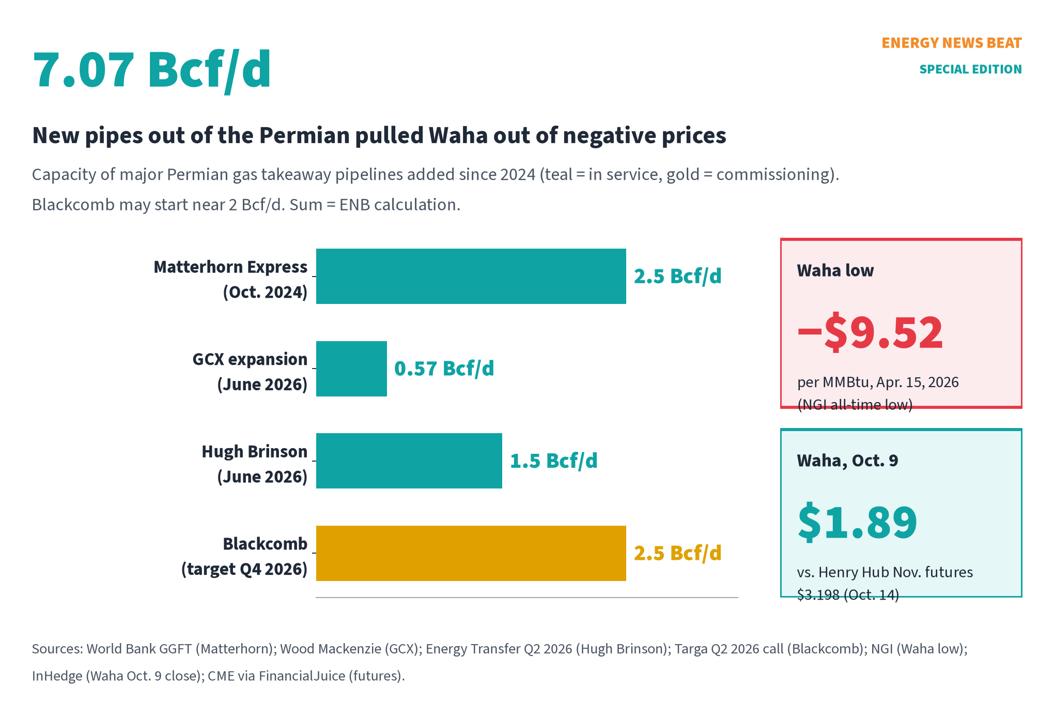
When the pipes fill up, producers may have to pay someone to take their gas. On April 15, Waha cash prices hit an all-time low of −$9.52 per MMBtu (NGI). New pipe has helped. Matterhorn Express (2.5 Bcf/d) started in late 2024, and the World Bank credits it with cutting U.S. flaring (World Bank). The GCX expansion (0.57 Bcf/d) began commissioning in June (Wood Mackenzie). Energy Transfer’s Hugh Brinson (1.5 Bcf/d) entered service in June (Energy Transfer). Blackcomb (2.5 Bcf/d) is targeted for the fourth quarter (Targa). By Oct. 9, Waha had climbed back to $1.89, still well under Henry Hub (InHedge).
Appalachia has the gas. The Northeast has the “no.”
As of court rulings Aug. 21 and Sept. 8, 2026; FERC deadline Nov. 19, 2026
Appalachia, the Marcellus and Utica, is the biggest gas basin in the country at about 37.1 Bcf/d this year (EIA STEO). The Mountain Valley Pipeline finally started in June 2024 with 2 Bcf/d of capacity, years late (Reuters). The pipes that would carry that gas into New York City and New England are still tied up in permits.
- NESE (Williams/Transco): a $1 billion, 400,000-dekatherm-a-day line under New York Harbor. The Second Circuit upheld New York’s water permit on Aug. 21 (ENR). On Sept. 8 the Third Circuit vacated New Jersey’s water-quality certificate and sent it back to the state (3rd Cir., No. 26-1252).
- Constitution: a 125-mile, 650,000-dekatherm-a-day line from Pennsylvania into New York. FERC’s environmental assessment found no significant impact, and the federal decision deadline is Nov. 19, 2026 (Federal Register). New York’s DEC wants a new environmental impact statement. Developers are targeting May 2028 (ENR; Williams).
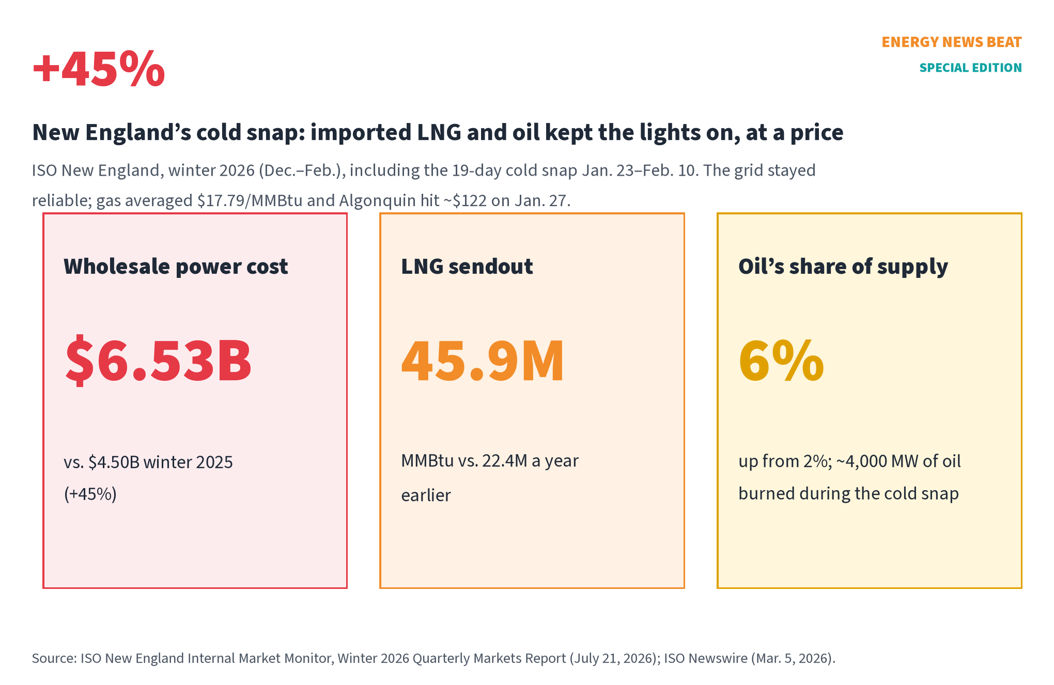
When pipes do not get built, New England fills the gap with tankers and oil. During this winter’s 19-day cold snap (Jan. 23–Feb. 10), the region’s LNG sendout was 45.9 million MMBtu, about double the prior winter. Oil generation averaged about 4,000 MW during the cold snap, and oil’s share of supply rose from 2% to 6%. Wholesale costs hit $6.53 billion, up 45% and the highest since 2014. Gas averaged $17.79/MMBtu, and Algonquin traded near $122 on Jan. 27 (ISO-NE Internal Market Monitor). DOE issued a 202(c) emergency order covering 57 New England resources from Jan. 25 to Feb. 14 (ISO-NE).
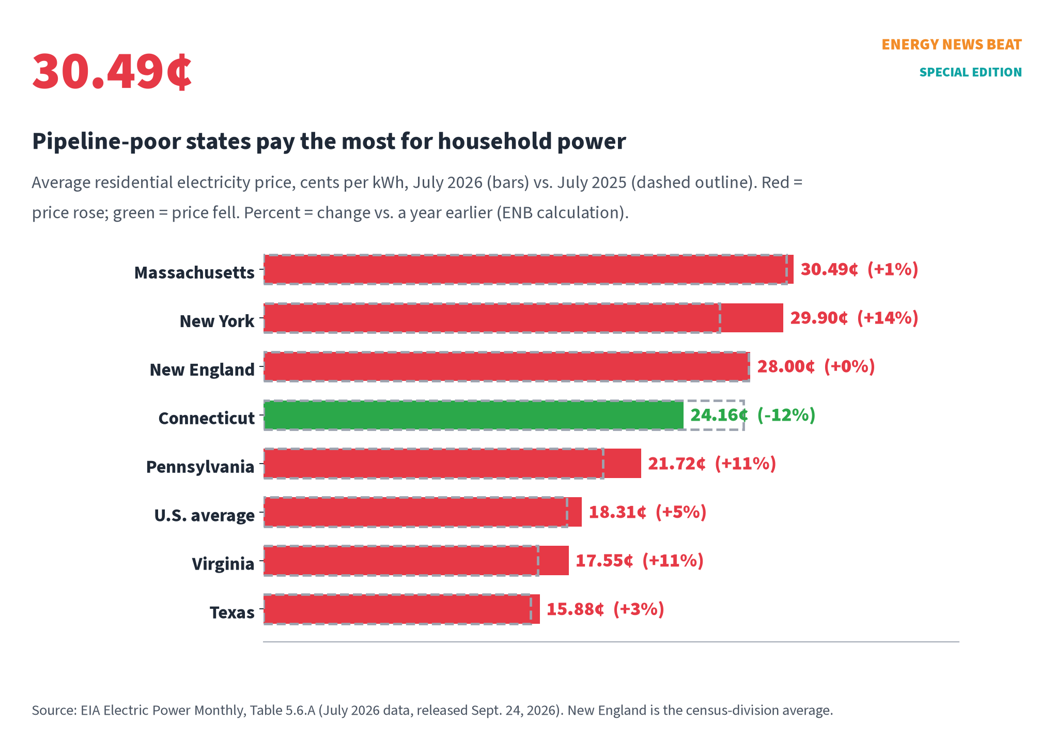
Prices are not only about pipes. Every state on that chart has its own mix of taxes, mandates, wires costs and weather. Connecticut’s price fell 12% this July. But the pattern is hard to miss. ENB reading: the states that have blocked gas pipes are among those paying the most. ENB covered the heating-oil side of this in “Nearly $1,700 to fill the tank.”
Part 3. How much gas on the grid is too much?
As of EIA STEO Oct. 6, 2026; FERC-NERC review Sept. 10, 2026
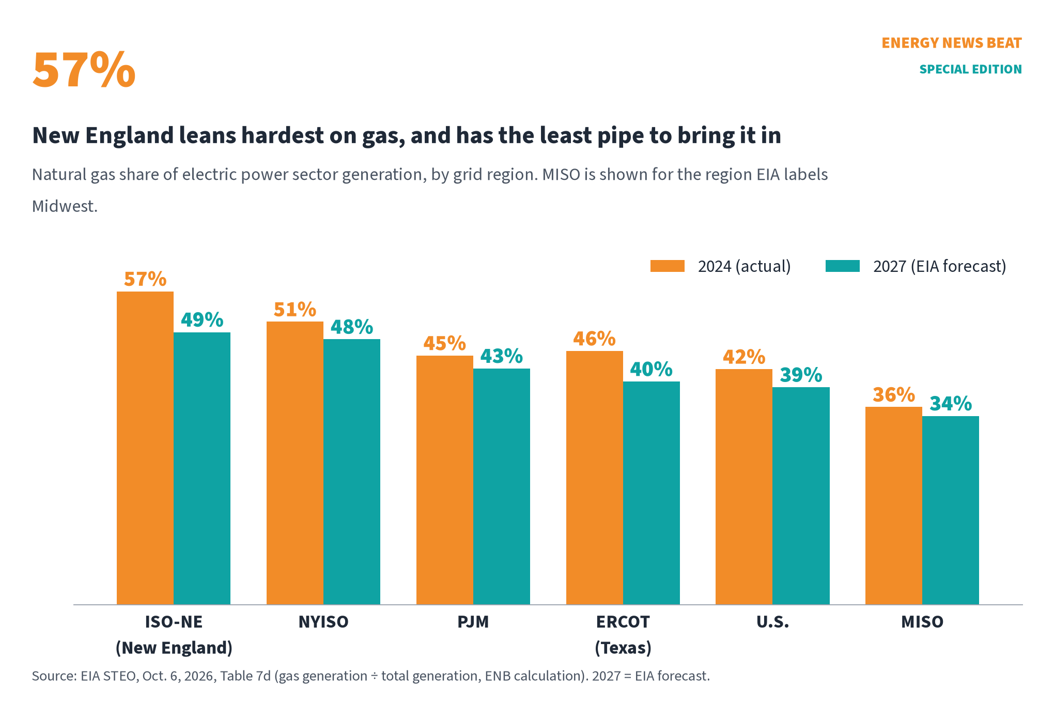
There is no magic number. The real question is whether gas is firm, meaning whether the plant has gas under contract on a pipeline that keeps flowing when it is 5°F outside. EIA puts gas at about 42% of U.S. power-sector generation in 2024 and 39% in 2027. The regional picture is different. New England was 57% gas in 2024, New York 51%, ERCOT 46%, PJM 45% and MISO 36% (EIA STEO Table 7d; ENB calculation).
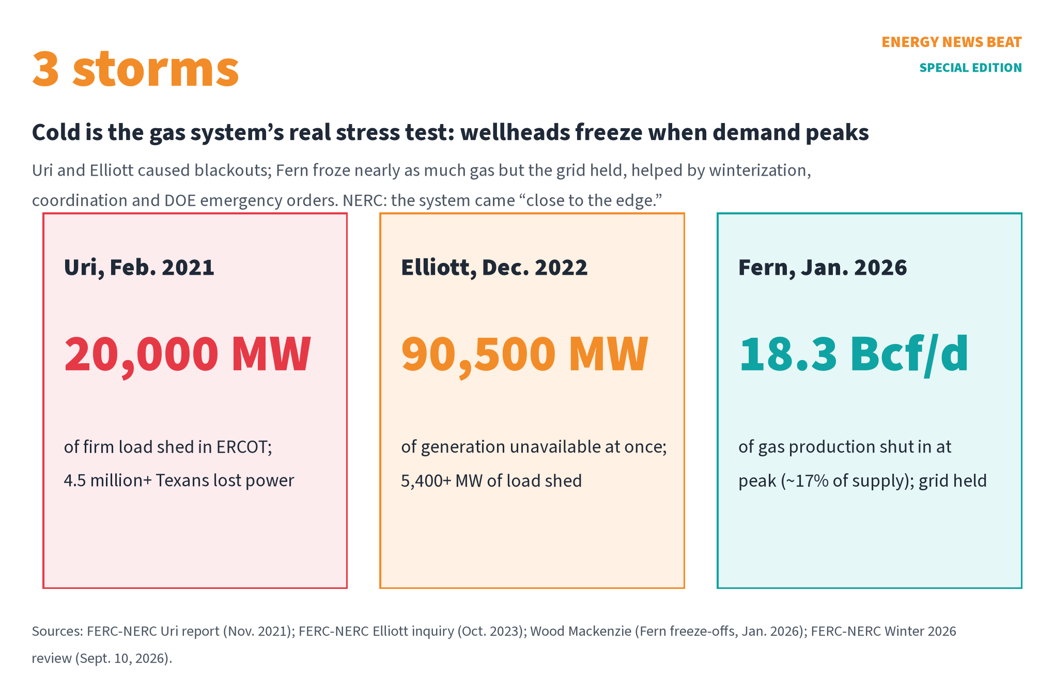
Winter is the test, and the record is mixed:
- Uri (Feb. 2021): ERCOT shed up to 20,000 MW of load. Generators logged 4,124 outages, derates or failed starts, and freezing and fuel problems caused most of the unplanned outages (FERC-NERC).
- Elliott (Dec. 2022): 90,500 MW of generation was unavailable at the same time across the East, and utilities shed more than 5,400 MW of firm load (FERC-NERC).
- Fern (Jan. 2026): 3 Bcf/d of gas production froze off at the peak, about 17% of supply, and cumulative losses topped 120 Bcf (Wood Mackenzie). This time the grid held, with no significant disruptions. FERC and NERC credited winterization, coordination and emergency orders, and called for more gas infrastructure. NERC CEO Jim Robb said the system was “close to the edge” (FERC-NERC).
NERC’s 2025 long-term assessment warns that new resources are not arriving as fast as demand. It recommends managing generator retirements and coordinating electric and gas planning and operations (NERC). In PJM, the 2028/29 capacity auction cleared at the $325/MW-day price cap. Total cost was about $16.4 billion, and the region came up 6,831 MW short of its reliability target (PJM; Utility Dive). ENB has followed PJM’s emergency steps here and here.
ENB reading: Gas is the right backbone for a fast-growing grid. It is cheap, dispatchable and American. But a grid that runs 50%-plus on gas without firm pipeline capacity, dual-fuel backup or onsite storage is betting the coldest night of the year on wellheads not freezing. Diversity is insurance. Coal piles, nuclear fuel and oil tanks do not depend on a pipeline when it is 5°F.
Part 4. Coal as the bridge until nuclear scales: both sides
What DOE is doing
As of DOE 2026 202(c) orders page, checked Oct. 15, 2026
DOE has used Section 202(c) of the Federal Power Act again and again this year to keep plants that were slated to retire running. Its 2026 orders page lists orders covering Campbell in Michigan (1,560 MW, through Nov. 14), Eddystone 3 and 4 in Pennsylvania (through Nov. 20), Centralia 2 in Washington, Craig 1 in Colorado, Schahfer 17/18 and Culley 2 in Indiana, and a PJM-wide order effective Oct. 13–16 (DOE). Retirements are slowing on their own as well. In 2025 utilities planned to retire 12.3 GW but retired only 4.6 GW, including just 2.6 GW of the 8.0 GW of coal on the list. Another 6.4 GW of coal is scheduled for 2026 (EIA).
The case for the bridge (mandate-critical perspective)
Orr and Rolling (Energy Bad Boys / Always On Energy Research, mandate-critical) looked at 82 coal plants with FERC Form 1 data. They found existing coal runs at an average $45.57/MWh, with 77% of plants under $60. Campbell was among the cheapest at about $30/MWh and ran at 64–80% capacity factor during Fern. Their argument: retiring working plants before replacements exist is what got the grid into this hole (Energy Bad Boys; ENB coverage).
The case against
On Sept. 11 the D.C. Circuit unanimously vacated DOE’s first Campbell order. Judge Pillard wrote that the emergency power is narrow and that DOE had not shown an imminent emergency (D.C. Circuit opinion). Michigan Attorney General Dana Nessel, who brought the case and opposes the orders, called them unlawful (Michigan AG). Consumers Energy reported a $259 million net cost for complying from May 2025 through June 2026, and it wants FERC to spread that cost across the region (Utility Dive). The same Bad Boys analysis concedes that some plants are expensive: Schahfer ran about $110/MWh, second-highest of the 82, though it ran near full output during Fern (Energy Bad Boys).
Clean coal and carbon capture: real, but costly
Carbon capture works but has not been cheap. Petra Nova in Texas, a $1 billion project, captured 92.4% of the CO2 in the flue-gas slipstream it treated. It was placed in reserve shutdown in May 2020 when oil prices collapsed and restarted in September 2023, with a design rate of about 1.4 million tonnes a year (POWER). The Clean Air Task Force, an environmental group that supports CCS, notes it captured 83% of planned volume over 2017–2019 (CATF). SaskPower’s Boundary Dam 3 cost C$1.47 billion, and its output drops from 150 MW to about 115 MW when capture runs (CATF). It averaged 2,598 tonnes a day in the first quarter of 2026 (SaskPower). The Energy Bad Boys estimate coal with CCS and new nuclear at $122–187/MWh for data-center load, well above new gas but below their wind-solar-battery cases (Energy Bad Boys).
Nuclear: the destination, on a slow road
- Vogtle 3 & 4 (Georgia): online, but at a total cost AP reported at roughly $35 billion, more than double the original estimate (AP).
- Crane / Three Mile Island Unit 1 (Pennsylvania): Constellation plans fuel load in spring 2027 and power later that year. FERC let it reuse 760 MW of interconnection rights from Eddystone (Philadelphia Inquirer).
- Palisades (Michigan): fuel loading began in late August and paused after an assembly tipped. The NRC approved a plan to remove the damaged assembly on Oct. 13. The plant has not yet restarted (Michigan Advance).
- TVA Clinch River BWRX-300 (Tennessee): the first U.S. construction permit for this small modular reactor design was issued Sept. 28. TVA still needs an operating license (Federal Register; World Nuclear News).
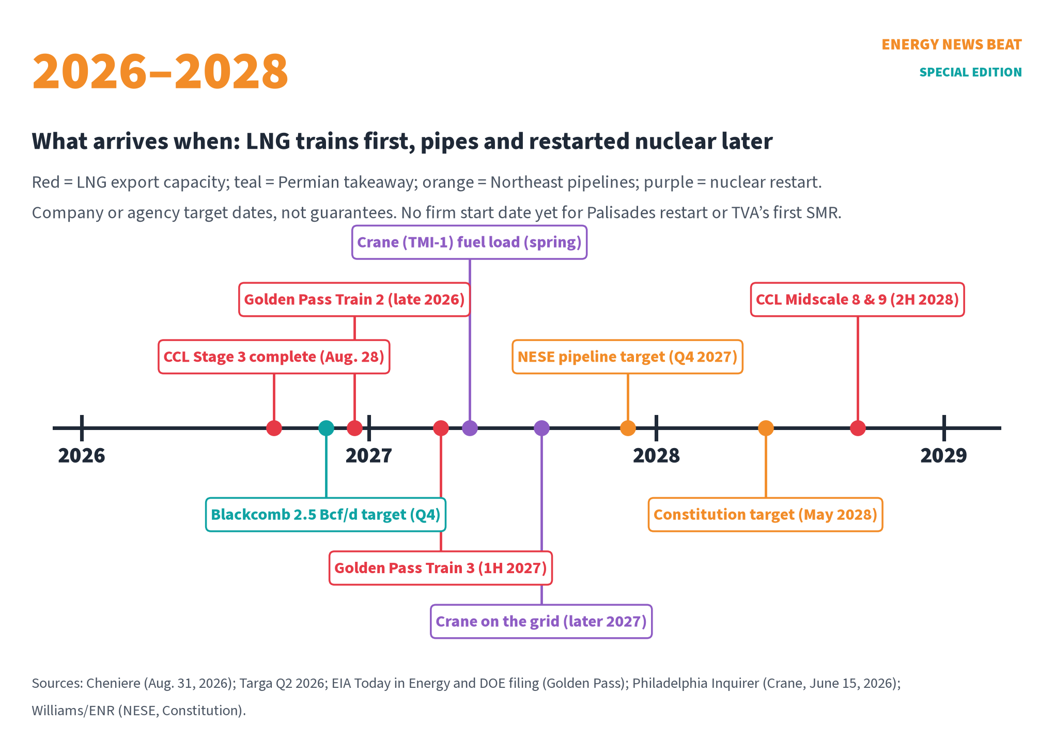
ENB reading: On the evidence, a bridge makes sense. Keep the low-cost, high-availability coal units running until the gas plants, pipes and reactors that replace them are actually online. Retire the expensive, rarely used units on a schedule. Then have someone other than local ratepayers pay for keeping them open in the name of regional reliability. Nuclear restarts are the fastest firm, carbon-free megawatts available, and new builds are measured in years, not quarters.
Part 5. Make every molecule count
As of EIA natural gas annual data released Sept. 30, 2026; World Bank June 23, 2026; IEA Global Methane Tracker 2026
Before we argue over who gets the gas, we should ask how much we lose before anyone gets it. Some losses are a cost of doing business: compressors and processing plants burn gas to move and clean it. Some is waste. And some is simply not measured nor sampled correctly within AGA standards, which affects the entire value chain from wellhead to burner tip, especially the net price to the producer.
Measurement and allocation
Every payment and pricing structure starts with a meter. Federal rules for onshore federal and Indian leases (43 CFR 3175) allow flow-rate uncertainty of ±3% on high-volume meters and ±2% on very-high-volume meters, and heating-value uncertainty of ±2% and ±1% (eCFR). GAO found that BLM’s gas-analysis reporting system, GARVS, “has never been operational,” so heating-value data are still handled manually (GAO-26-106475). In a separate report, GAO found $96 billion in federal oil and gas royalties over FY2014–2024 with net adjustments of about −$2.7 billion, and royalty management remains on GAO’s High-Risk list (GAO-26-107669). Standard wellhead midstream contracts only allow a 2% variance on measurement; however, the rule of thumb on larger high-pressure meters is 1%. Reese Energy Consulting is heavily involved in all basins, facilitating formal audits of these agreements and the measurement and sampling assets and practices of midstreamers, processors, and transporters.
ENB scenario (not a forecast): if measurement across the system were biased by just 1%, that would be about 1.18 Bcf/d of 2025 marketed production. At EIA’s 2025 Henry Hub average of $3.53, that is roughly $1.6 billion a year in gas value that moves between buyers, sellers and royalty owners (ENB calculation from EIA STEO). Errors go both ways, so auditing does not create gas. It decides which party is operating within standards and operating prudently.
Lost and unaccounted-for gas
All midstream operators, transporters, and utilities report F, L, and U – “Fuel and lost and unaccounted-for gas”, the difference between gas received and gas delivered. Part of this “loss” is actual fuel used in compression and plant operations necessary for getting wellhead gas into pipelines specifications and also moving it through various pressure increases to be able to enter the transmission systems. The lost and unaccounted for volumes reflect poor operating practices which result in molecules that will not be sold in the marketplace or end up with and end user. Reese’s auditing work over the years have uncovered tens of millions of dollars of value of this lost gas and have recovered over $35 million for U.S. gas producers. Every producing basin in the U.S. has this issue both from an accounting and operational standpoint. Prudent producers continually bring in this 3rd party expertise and part of their corporate governance program.
Flaring and venting
EIA reports that 335,163 million cubic feet were vented or flared in 2024, about 0.92 Bcf/d (ENB unit conversion), up from 271,682 MMcf in 2022 (EIA). The World Bank, using satellite data, says U.S. flaring fell 0.4 bcm (7%) in 2025, the largest absolute drop of any country, with flaring intensity falling from 1.1 to 1.0 cubic meters per barrel. It credits Matterhorn Express for much of that (World Bank GGFT). The lesson is simple: pipeline s cut flaring faster than lectures do.
Leaks and methane
EPA’s latest final inventory estimates U.S. natural gas systems emitted about 6,183 thousand tonnes of methane in 2022. Production accounted for 3,202 kt, gathering and boosting 1,528, transmission and storage 1,413, distribution 544 and processing 541 (EPA GHG Inventory; EPA). Converted at about 19.2 grams per cubic foot, that is roughly 0.88 Bcf/d of methane. That is an ENB unit conversion of an emissions estimate. This is pursuant to older, low pressure systems, bad operations, and must be monitored especially for safety reasons.
What could recovering it add?
We only cite a recovery number where a source gives one. The International Energy Agency (an intergovernmental agency that supports emissions cuts) says nearly 100 bcm a year could be made available globally by cutting oil and gas methane, and another 100 bcm by ending non-emergency flaring. About 15 bcm could come quickly from exporters and importers working together (IEA). That is about 9.7 Bcf/d and 1.4 Bcf/d (ENB unit conversions). We found no U.S.-specific Bcf/d recovery estimate from EIA, EPA, PHMSA or GAO, and we are not inventing one.
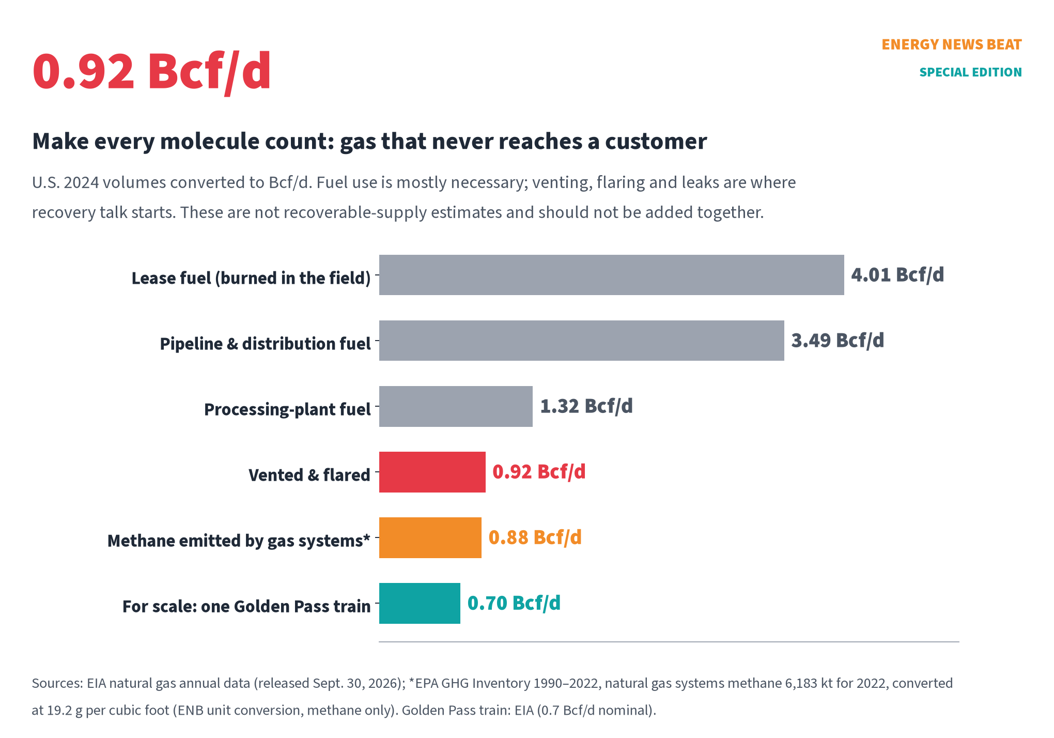
Why it matters:
- Consumers: every Bcf/d that reaches a pipeline instead of a flare stack is supply that helps keep Henry Hub, and your bill, in check.
- Producers: captured gas is sold gas, and fewer flares mean fewer regulatory fights.
- Royalty owners: a percent of meter error is real money, and GAO’s findings say the federal checks are still partly manual.
- Investors: gathering, compression and measurement upgrades are capital projects with a clear payback when takeaway capacity exists and Waha is positive.
Part 6. How consumers and investors see it
Consumers
- Pew Research Center (nonpartisan): 75% of U.S. adults say home energy costs have gone up in the last few years, including 42% who say a lot. Among those, 64% blame utilities seeking more money as a major reason, 43% blame data centers and 40% blame grid upgrades (survey March 16–22, 2026) (Pew).
- AP-NORC/EPIC (nonpartisan): 84% are concerned that data centers will raise local electricity prices (AP-NORC/EPIC).
- Industrial Energy Consumers of America (manufacturers’ advocacy, buyers of gas): in January it asked DOE to suspend spot LNG exports to bring down gas and power prices, saying it is not against LNG exports (IECA).
Investors
- RBC Capital Markets (bank research): natural gas is powering the data-center boom, with about 6.1 Bcf/d of data-center gas by 2030 (RBC Capital Markets).
- Morgan Stanley (bank research, as reported): a probability-weighted +4.8 Bcf/d from data centers by 2030, and a U.S. gas market “on the cusp of a new cycle of demand growth” (com).
- EQT (producer, benefits from higher demand): about 10 Bcf/d of new gas-fired power demand by 2030 in its base case and 18 in its upside case (EQT).
- PJM capacity market: the 2028/29 auction cleared at the cap at about $16.4 billion. That is revenue for generators and cost for ratepayers (PJM).
Where they agree: both groups want more firm supply. Where they split: investors see gas demand as a growth story. Consumers see higher bills and ask who pays for the new wires and plants. The fair answer is that large new loads pay for what they cause.
What to watch next
- 10: EIA’s next Short-Term Energy Outlook, with updated LNG and power-burn forecasts (EIA).
- 14–Dec. 25: current DOE 202(c) orders for Campbell, Eddystone, Wagner, Stanton, Centralia, Schahfer, Culley and Craig expire on a rolling basis unless renewed (DOE).
- 19: FERC’s federal authorization deadline for the Constitution pipeline (Federal Register).
- Q4 2026: Blackcomb full service (Targa); Golden Pass Train 2 (Golden Pass filing to DOE).
- Mid-to-late December: ERCOT’s revised long-term load forecast (ERCOT).
- Winter 2026–27: NERC’s winter reliability assessment, and whether New England again leans on LNG and oil (ISO-NE).
- 2027: Crane restart; Golden Pass Train 3; the NESE target date (Q4 2027) (Inquirer; EIA; ENR).
The bottom line
America does not have a gas shortage. It has a pipe and a policy problem, and a winter problem. LNG exports are the biggest new customer, and they make America stronger abroad. Data centers could be the next one, if they pay their way. Families are on track to pay about $221 more this year for electricity than in 2024 (EIA forecast; ENB calculation), and New Englanders far more. The fix is not to pick one customer over another. It is to build the pipes, keep working plants open until their replacements run, bring nuclear back, and stop wasting the gas we already produce. Energy security starts at home.
Have a different read on the numbers? Tell us. At Energy News Beat, we would rather be corrected than be wrong. More: ENB data-center coverage • Energy security starts at home.

https://reeseenergyconsulting.com/
For Natural Gas Auditing, reach out to the Reese Energy Consulting Team.
Appendices
At Energy News Beat we Make Appendices Great Again.
Appendix A. Sources and perspective labels
| # | Source | Publisher | Date / time | Perspective |
| 1 | Short-Term Energy Outlook, October 2026 (report and STEO_m.xlsx data tables) | U.S. Energy Information Administration (EIA) | Oct. 6, 2026 (next release Nov. 10, 2026) | Government statistics (independent) |
| 2 | STEO October 2026 monthly data workbook (Tables 4, 5, 7, 8) | EIA | Oct. 6, 2026 | Government statistics (independent) |
| 3 | EIA press release on the October 2026 STEO (electricity demand, data centers) | EIA | Oct. 6, 2026 | Government statistics (independent) |
| 4 | U.S. LNG exports rose 23% in the first half of 2026 because of higher capacity | EIA, Today in Energy | Sept. 1, 2026 | Government statistics (independent) |
| 5 | Golden Pass LNG ships its first cargo (Today in Energy) | EIA, Today in Energy | 2026 | Government statistics (independent) |
| 6 | North America LNG export capacity set to more than double by 2029 | EIA, Today in Energy | Oct. 2025 | Government statistics (independent) |
| 7 | U.S. LNG exports, 2016–2025, and capacity outlook | EIA, Today in Energy | 2026 | Government statistics (independent) |
| 8 | Planned vs. actual U.S. generator retirements in 2025; 2026 schedule | EIA, Today in Energy | 2026 | Government statistics (independent) |
| 9 | Electric Power Monthly Table 5.6.A: average price of electricity by state, July 2026 and July 2025 | EIA | Released Sept. 24, 2026 (July 2026 data) | Government statistics (independent) |
| 10 | U.S. natural gas vented and flared (annual, MMcf) | EIA | Released Sept. 30, 2026 | Government statistics (independent) |
| 11 | U.S. natural gas gross withdrawals and production (annual) | EIA | Released Sept. 30, 2026 | Government statistics (independent) |
| 12 | U.S. natural gas consumption by end use, incl. lease, plant and pipeline fuel (annual) | EIA | Released Sept. 30, 2026 | Government statistics (independent) |
| 13 | Golden Pass LNG semi-annual report to DOE (Train 2 commissioning status) | Golden Pass LNG Terminal LLC filing, posted by DOE | Oct. 1, 2026 | Company filing to government |
| 14 | 2026 DOE 202(c) orders (Federal Power Act emergency orders) | U.S. Department of Energy, CESER | page checked Oct. 15, 2026 | Government (administration policy) |
| 15 | Michigan v. DOE, No. 25-1159 (D.C. Cir.) opinion vacating the first Campbell 202(c) order | U.S. Court of Appeals, D.C. Circuit | Sept. 11, 2026 | Court ruling |
| 16 | Federal appeals court vacates first DOE order forcing operation of J.H. Campbell coal plant | Michigan Attorney General Dana Nessel | Sept. 11, 2026 | State government (party to the case, opposes the orders) |
| 17 | Court rejects DOE ‘emergency’ order delaying coal plant retirement as overstep (incl. Consumers Energy $259M net cost) | Utility Dive | Sept. 2026 | Trade press |
| 18 | 2025 Long-Term Reliability Assessment (infographic and report) | North American Electric Reliability Corp. (NERC) | Jan. 29, 2026 | Grid reliability regulator (independent) |
| 19 | Resource adequacy risks intensify across North America as demand growth surges | NERC | Jan. 2026 | Grid reliability regulator (independent) |
| 20 | FERC, NERC review shows bulk-power system improvements during Winter 2026 Arctic cold period | FERC and NERC | Sept. 10, 2026 | Federal regulator (independent) |
| 21 | The February 2021 cold weather outages in Texas and the South Central United States (final report) | FERC, NERC and Regional Entities | Nov. 16, 2021 | Federal regulator (independent) |
| 22 | Inquiry into bulk-power system operations during December 2022 Winter Storm Elliott | FERC and NERC | Oct. 2023 | Federal regulator (independent) |
| 23 | ERCOT releases preliminary long-term load forecast for 2026–2032 | ERCOT | Apr. 15, 2026 | Grid operator |
| 24 | PJM 2026 Long-Term Load Forecast Report | PJM Interconnection | Jan. 2026 | Grid operator |
| 25 | 2028/2029 Base Residual Auction results report | PJM Interconnection | July 14, 2026 | Grid operator |
| 26 | PJM capacity prices hit price cap, reserve shortfall grows (incl. Jefferies comment) | Utility Dive | July 2026 | Trade press |
| 27 | Winter 2026 Quarterly Markets Report | ISO New England Internal Market Monitor | July 21, 2026 | Grid operator market monitor (independent unit) |
| 28 | Winter 2025/2026 recap: grid stays reliable during prolonged cold | ISO New England (ISO Newswire) | Mar. 5, 2026 | Grid operator |
| 29 | 43 CFR Subpart 3175: measurement of gas (uncertainty limits, §3175.31) | BLM / eCFR | current | Federal regulation |
| 30 | GAO-26-106475, Oil and Gas: actions needed to improve data sharing (gas measurement data, GARVS) | U.S. Government Accountability Office | Jan. 21, 2026 | Congressional watchdog (nonpartisan) |
| 31 | GAO-26-107669, federal oil and gas royalties: adjustments and revisions | U.S. Government Accountability Office | Dec. 15, 2025 | Congressional watchdog (nonpartisan) |
| 32 | Report to Congress on lost and unaccounted-for natural gas metrics | PHMSA, U.S. DOT | May 16, 2017 | Federal safety regulator |
| 33 | Inventory of U.S. Greenhouse Gas Emissions and Sinks: 1990–2022 (natural gas systems) | U.S. EPA | Apr. 2024 (latest final inventory) | Government statistics |
| 34 | Natural gas and petroleum systems in the GHG Inventory | U.S. EPA | page checked Oct. 2026 | Government statistics |
| 35 | Global Gas Flaring Tracker Report, June 2026 | World Bank, Global Flaring and Methane Reduction Partnership | June 23, 2026 | Multilateral development bank (pro-flaring-reduction program) |
| 36 | Global Methane Tracker 2026: key findings | International Energy Agency | 2026 | Intergovernmental agency (supports emissions cuts) |
| 37 | TVA Clinch River Nuclear Unit 1: construction permit and record of decision | Federal Register (NRC) | Oct. 5, 2026 (permit issued Sept. 28) | Federal regulator |
| 38 | First construction permit issued for BWRX-300 SMR in the US | World Nuclear News | Sept. 2026 | Nuclear trade press (industry association publication) |
| 39 | 2024 United States Data Center Energy Usage Report | Lawrence Berkeley National Laboratory | Dec. 2024 | National lab research (DOE-funded) |
| 40 | United States Data Center Energy Usage Report: 2025 Update | Lawrence Berkeley National Laboratory | June 2026 | National lab research (DOE-funded) |
| 41 | Powering Intelligence 2026: executive summary | Electric Power Research Institute (EPRI) | Feb. 2026 | Utility-funded research institute |
| 42 | Natural gas powers the data center boom (Christopher Louney) | RBC Capital Markets | May 2026 | Investment bank research |
| 43 | Morgan Stanley identifies best gas stocks amid AI data center boom | Investing.com (reporting Morgan Stanley research) | Feb. 2026 | Investment bank research (as reported) |
| 44 | Data centers could add 6 Bcf/d to gas demand: EDA forecast | East Daley Analytics | 2025 | Midstream analytics firm (commercial) |
| 45 | EQT Q2 2026 earnings presentation (gas demand outlook) | EQT Corp. | July 2026 | Producer (largest U.S. gas producer; benefits from higher demand) |
| 46 | Winter Storm Fern shuts in 18.3 bcfd of US gas production at its peak | Wood Mackenzie | Jan. 2026 | Energy consultancy |
| 47 | Gulf Coast Express expansion begins commissioning | Wood Mackenzie | June 2026 | Energy consultancy |
| 48 | Midday snapshot: natural gas cash prices slide sharply as Waha hits new low | NGI (Natural Gas Intelligence) | Apr. 15, 2026 | Energy trade press / price reporter |
| 49 | Waha price falls and its discount to Henry Hub widens | InHedge Intelligence | Oct. 2026 (data through Oct. 9) | Commodity analytics firm |
| 50 | NYMEX natural gas November futures settle at $3.1980/MMBtu | FinancialJuice (CME settlement) | Oct. 14, 2026 | Market news wire |
| 51 | Energy Transfer Q2 2026 earnings release (Hugh Brinson pipeline in service) | Energy Transfer / SEC EDGAR | Aug. 2026 | Company (SEC filing) |
| 52 | Targa Resources Q2 2026 earnings call transcript (Blackcomb on track for Q4 2026) | Benzinga | 2026 | Company remarks (transcript) |
| 53 | Cheniere announces substantial completion of CCL Stage 3 project | Cheniere Energy | Aug. 31, 2026 | Company (LNG exporter) |
| 54 | US Mountain Valley natural gas pipeline begins operations | Reuters | June 14, 2024 | Wire news |
| 55 | Court backs New York approval of $1B Williams gas pipeline | Engineering News-Record | Aug. 2026 | Trade press |
| 56 | NRDC v. NJDEP, No. 26-1252 (3d Cir.): order vacating New Jersey water quality certification for NESE | Justia (3rd Circuit opinion) | Sept. 8, 2026 | Court ruling |
| 57 | Feds advance 125-mile Constitution gas pipeline for NY despite challenge | Engineering News-Record | Sept. 2026 | Trade press |
| 58 | FERC environmental assessment notice, Constitution Pipeline (federal authorization deadline Nov. 19, 2026) | Federal Register | Aug. 26, 2026 | Federal regulator |
| 59 | Constitution Pipeline project page | Williams Companies | checked Oct. 2026 | Company (pipeline developer) |
| 60 | Petra Nova carbon capture unit is up and running again, says JX Nippon | POWER Magazine | Sept. 2023 | Trade press |
| 61 | BD3 status update: Q1 2026 | SaskPower | 2026 | Utility (plant owner) |
| 62 | Carbon capture and storage: what can we learn from the project track record? | Clean Air Task Force | 2023 | Environmental advocacy group (supports CCS as a climate tool) |
| 63 | A second new nuclear reactor is completed in Georgia. The carbon-free power comes at a high price | Associated Press | Apr. 2024 | Wire news |
| 64 | Regulators approve plan to remove damaged fuel assembly at Palisades | Michigan Advance | Oct. 15, 2026 | Nonprofit state news |
| 65 | Three Mile Island nuclear plant on track to reopen next year | Philadelphia Inquirer | June 15, 2026 | Regional news |
| 66 | The Renewable Data Center Fantasy (Mitch Rolling and Isaac Orr) | Energy Bad Boys (Substack) | Aug. 22, 2026 | Mandate-critical / energy think tank (Energy Bad Boys = Isaac Orr & Mitch Rolling of Always On Energy Research) |
| 67 | Debunking the Myth of Expensive Coal Plants (Mitch Rolling and Isaac Orr) | Energy Bad Boys (Substack) | June 27, 2026 | Mandate-critical / energy think tank (Energy Bad Boys = Isaac Orr & Mitch Rolling of Always On Energy Research) |
| 68 | A Nation Divided by Natural Gas | Energy Bad Boys (Substack) | Sept. 12, 2026 | Mandate-critical / energy think tank (Energy Bad Boys = Isaac Orr & Mitch Rolling of Always On Energy Research) |
| 69 | Data Centers: Counting Gigawatts Before They Hatch | Always On Energy Research | June 2026 | Mandate-critical / energy think tank (Always On Energy Research; same authors as Energy Bad Boys) |
| 70 | Many Americans hold utility companies responsible for rising home energy bills | Pew Research Center | May 6, 2026 (survey March 16–22) | Nonpartisan survey research |
| 71 | 2026 AP-NORC/EPIC energy poll: press release | AP-NORC Center and University of Chicago EPIC | Sept. 2026 | Nonpartisan survey research |
| 72 | Letter to Secretary Wright urging suspension of spot LNG exports | Industrial Energy Consumers of America (IECA) | Jan. 28, 2026 | Manufacturers’ advocacy group (gas buyers; favors limits on LNG exports) |
| 73 | The New Energy Boom: Data Centers, LNG and America’s Gas Advantage | Energy News Beat | 2026 | ENB coverage |
| 74 | What Does the Demand for Natural Gas and LNG Look Like for the Next 20 Years? | Energy News Beat | archive | ENB coverage |
| 75 | Debunking the Myth of Expensive Coal Plants: Energy Bad Boys Bring the Receipts | Energy News Beat | 2026 | ENB coverage |
| 76 | Are Data Centers Driving Up Electricity Rates? Who Is Responsible? | Energy News Beat | 2026 | ENB coverage |
| 77 | Largest US Power Grid PJM Escalates Emergency Actions to Avoid Blackouts | Energy News Beat | 2026 | ENB coverage |
| 78 | AI Buildout Drives 76% Power Bill Jump on Largest US Grid, But Is AI the Only Reason? | Energy News Beat | 2026 | ENB coverage |
| 79 | Energy Security Starts at Home: Preparing for the Grid of Tomorrow (Conversations in Energy) | Energy News Beat | archive | ENB coverage |
| 80 | Hormuz Traffic Sinks and Saudi Oil Comes Under Fire: How Many Escape Routes Are Left? | Energy News Beat | Oct. 2026 | ENB coverage |
| 81 | Nearly $1,700 to Fill the Tank: The Heating Oil Shock Hits Northeast Kitchen Tables | Energy News Beat | Oct. 2026 | ENB coverage |
| 82 | Energy News Beat: data center coverage | Energy News Beat | ongoing | ENB coverage |
Appendix B. Key figures
| Figure | Value | Source |
| Avg. U.S. household electric bill 2024 / 2026F | $1,710 / $1,931 (+$221) | EIA STEO; ENB CALC |
| Residential price / use 2026F | 18.24¢/kWh; 10,587 kWh/yr | EIA STEO |
| July 2026 residential: MA / NY / U.S. / TX | 30.49 / 29.90 / 18.31 / 15.88 ¢/kWh | EIA EPM 5.6.A |
| U.S. LNG exports 2022 / 2025 / 2026F / 2027F | 10.59 / 15.09 / 17.57 / 18.62 Bcf/d | EIA STEO |
| LNG exports 1H26 / 2H26F / 1H27F | 17.4 / 17.3 / 18.7 Bcf/d | EIA TIE |
| Planned U.S. LNG capacity 2025–2029 | 13.9 Bcf/d | EIA TIE |
| U.S. power-sector gas burn 2024 / 2026F / 2027F | 36.78 / 36.98 / 37.03 Bcf/d | EIA STEO |
| Henry Hub 2025 / 2026F; Nov futures Oct. 14 | $3.53 / $3.48; $3.198 | EIA STEO; CME |
| Waha all-time low / Oct. 9 close | −$9.52 (Apr. 15) / $1.89 | NGI; InHedge |
| Permian gas / GOR 2026F | 29.53 Bcf/d; 4.34 Mcf/bbl | EIA STEO; ENB CALC |
| Appalachia / Haynesville 2026F | 37.12 / 16.83 Bcf/d | EIA STEO |
| Gas share of gen 2024: US / ISO-NE / ERCOT / PJM | 42.5% / 56.6% / 45.8% / 45.0% | EIA STEO 7d; ENB CALC |
| LBNL data centers 2023 / 2030 | 176 TWh (4.4%); 649 TWh (11.8%) | LBNL 2024; LBNL 2025 |
| EPRI share of U.S. electricity by 2030 | 9–17% | EPRI |
| Data-center gas by 2030: MS / RBC / EQT base | 4.8 / 6.1 / ~10 Bcf/d | MS via Investing.com; RBC; EQT (MS/RBC as reported) |
| NERC N. American 10-yr summer peak growth, 2022→2025 LTRA | 55 → 224 GW | NERC |
| ERCOT peak 2023 record / 2032 preliminary | 85,508 / 367,790 MW | ERCOT |
| PJM summer peak 2036 / 10-yr add | 222,106 / +65,733 MW | PJM |
| PJM 2028/29 BRA | $325/MW-day; $16.4B; 6,831 MW short | PJM |
| ISO-NE winter 2026 wholesale cost / LNG sendout | $6.53B; 45.9 million MMBtu | ISO-NE IMM |
| Fern peak freeze-offs | 18.3 Bcf/d (~17% of supply) | WoodMac |
| Uri load shed / Elliott coincident outages | 20,000 MW / 90,500 MW | FERC-NERC; FERC-NERC |
| Campbell 202(c) net cost | $259M (Consumers Energy; May 2025–June 30, 2026) | Utility Dive |
| EBB: avg existing coal / share under $60 | $45.57/MWh; 77% | Energy Bad Boys |
| EBB: new gas for 24/7 DC load | $60–86/MWh | Energy Bad Boys |
| Vented & flared 2024 | 335,163 MMcf ≈ 0.92 Bcf/d | EIA; ENB UNIT |
| EPA gas-systems methane 2022 | 6,183 kt ≈ 0.88 Bcf/d | EPA; ENB UNIT (not recovery) |
| IEA global methane made available | ~100 bcm ≈ 9.7 Bcf/d | IEA; ENB UNIT |
| World Bank U.S. flaring cut 2025 | −0.4 bcm (−7%) | World Bank |
| Pew: energy costs up / blame utilities / DCs | 75% / 64% / 43% | Pew |
| AP-NORC/EPIC: concerned DCs raise prices | 84% | AP-NORC |
Appendix C. Chart index
| Chart | What it shows | Primary sources |
| 1. Household bill | Annual bill 2022–2027F | EIA STEO; ENB CALC |
| 2. Gas demand stack | U.S. gas uses + exports, 2022–2027F | EIA STEO |
| 3. NERC forecast | N. American 10-year summer peak growth by LTRA year | NERC |
| 4. 2030 forecasts | LNG capacity vs. data-center gas forecasts | EIA; RBC; MS; EQT |
| 5. Permian GOR | Permian gas and Mcf/bbl, 2022–2027F | EIA STEO |
| 6. Permian takeaway | Pipes since 2024; Waha prices | NGI; World Bank; operators |
| 7. ISO-NE winter | Winter 2026 cost, LNG, oil | ISO-NE IMM |
| 8. State prices | July residential ¢/kWh by state | EIA EPM |
| 9. Gas share by region | 2024 vs. 2027F | EIA STEO 7d |
| 10. Winter storms | Uri, Elliott, Fern | FERC-NERC; WoodMac |
| 11. Timeline | LNG, pipes, nuclear 2026–2028 | Companies; DOE; courts |
| 12. Molecules | Vented/flared, fuel use, methane | EIA; EPA |
Appendix D. Methodology
- STEO numbers come from EIA’s October 2026 STEO_m.xlsx. Annual figures are the average of the 12 monthly values for that year. 2026 and 2027 are EIA forecasts (labeled F).
- Gas share of generation = NGEPGEN_region ÷ TOEPGEN_region from STEO Table 7d (ENB CALC). EIA labels MISO-area numbers as Midwest (MW).
- Household bill = residential ¢/kWh × annual kWh per customer ÷ 100 (ENB CALC). National average; your bill will differ.
- Permian GOR = Permian marketed gas (Bcf/d) ÷ Permian crude (million b/d), which equals Mcf per barrel (ENB CALC).
- Bcf/d from annual MMcf = MMcf ÷ days in year ÷ 1,000. 2024 was a leap year (366 days). Labeled ENB UNIT.
- Methane tonnes → Bcf/d uses ~19.2 grams of methane per standard cubic foot. Labeled ENB UNIT. Not a recoverable-supply estimate.
- bcm → Bcf/d uses 1 bcm ≈ 35.3147 Bcf, then ÷ 365 (ENB UNIT).
- Perspective labels are assigned to every source in Appendix A. “Mandate-critical / energy think tank” marks Energy Bad Boys and Always On Energy Research — the same authors (Isaac Orr and Mitch Rolling). Advocacy groups, banks, producers and manufacturers are labeled as such.
Appendix E. Timeline
| Date | Event | Source |
| June 14, 2024 | Mountain Valley Pipeline in service (2 Bcf/d) | Reuters |
| Oct. 2024 | Matterhorn Express in service (2.5 Bcf/d) | World Bank |
| Jan. 23–Feb. 10, 2026 | ISO-NE 19-day cold snap; Fern freeze-offs | ISO-NE; WoodMac |
| Apr. 15, 2026 | Waha hits −$9.52/MMBtu; ERCOT preliminary LTLF | NGI; ERCOT |
| Apr. 22, 2026 | Golden Pass first cargo | EIA |
| June 13, 2026 | Hugh Brinson in service | Energy Transfer |
| June 23, 2026 | World Bank Global Gas Flaring Tracker | World Bank |
| July 14, 2026 | PJM 2028/29 BRA clears at $325/MW-day | PJM |
| Aug. 21, 2026 | 2nd Circuit upholds NY NESE water permit | ENR |
| Aug. 28, 2026 | Cheniere CCL Stage 3 substantial completion | Cheniere |
| Sept. 8, 2026 | 3rd Circuit vacates NJ NESE certificate | 3rd Cir. |
| Sept. 10, 2026 | FERC-NERC Winter 2026 review | FERC-NERC |
| Sept. 11, 2026 | D.C. Circuit vacates first Campbell order | D.C. Cir. |
| Sept. 28, 2026 | NRC issues TVA Clinch River BWRX-300 construction permit | Federal Register |
| Oct. 1, 2026 | Golden Pass DOE semi-annual: Train 2 commissioning | DOE filing |
| Oct. 6, 2026 | EIA October STEO released | EIA |
| Oct. 13, 2026 | NRC approves Palisades fuel-assembly retrieval | Michigan Advance |
| Oct. 14, 2026 | Nov. NYMEX gas settles $3.198 | FinancialJuice |
| Oct. 15, 2026 | This Special Edition published | ENB |
Appendix F. Glossary
| Term | Plain-English meaning |
| Bcf/d | Billion cubic feet per day. Roughly: one Bcf/d can fuel a few million homes or one large LNG train. |
| GOR | Gas-to-oil ratio: how much gas (Mcf) comes up with each barrel of oil. |
| Henry Hub | The main U.S. gas price benchmark, in Louisiana. |
| Waha | A Permian Basin gas price hub in West Texas. Often trades below Henry Hub when pipes are full. |
| LNG | Liquefied natural gas. Gas chilled so it can be shipped on tankers. |
| 202(c) | Section 202(c) of the Federal Power Act. Lets DOE order plants to run in an emergency. |
| BRA | Base Residual Auction. PJM’s main capacity market, which pays generators to be available. |
| LAUF | Lost and unaccounted-for gas. The difference between gas received and delivered; mixes meter error and leaks. |
| Firm transport | A pipeline contract that guarantees delivery capacity, usually year-round. |
| SMR | Small modular reactor. Factory-built nuclear units smaller than traditional plants. |
Appendix G. Related ENB coverage
The new energy boom: data centers, LNG and America’s gas advantage • What does gas and LNG demand look like for the next 20 years? • Are data centers driving up electricity rates? • PJM escalates emergency actions • AI buildout and the 76% bill jump • Energy Bad Boys on coal plant costs • Energy security starts at home • Hormuz and LNG escape routes • Heating oil shock in the Northeast • Data center category.
Appendix H. Corrections and caveats
- Vogtle total cost: AP and secondary sources cite figures near $35–36.8 billion depending on what is included. We use “about $35 billion” and link the AP story. Re-check if you need a precise figure for a filing.
- Blackcomb initial rate: company target is Q4 2026 at 2.5 Bcf/d nameplate; trade commentary has suggested a lower initial rate. We mark the target date as a target.
- World Bank absolute U.S. flare volume: we quote the −0.4 bcm (−7%) change. We do not assert a 2025 absolute volume without the report’s table.
- EPA methane Bcf/d: ENB UNIT conversion only; not recoverable supply and not additive with EIA vented/flared.
- Hormuz ~20% of LNG trade: attributed to the IEA Global Methane Tracker 2026, not the EIA STEO.
- Morgan Stanley, RBC and East Daley gas-for-data-center Bcf/d figures: cited as reported via their public pages or Investing.com; not re-fetched from primary research notes.
- MVP Southgate and some SMR cost numbers were left out of the charts where we could not verify a clean primary source today.
- Nothing in this package has been posted. Replace [ARTICLE LINK] in the Publish Kit with the live URL after publishing.
By Stuart Turley, host of the Energy News Beat podcast • Steve Reese, CEO, Reese Energy Consulting • Published Oct. 15, 2026 • EIA forecast data as of the Oct. 6, 2026 Short-Term Energy Outlook • Futures as of the Oct. 14 settlement • Analysis and opinion; Stu’s views are labeled • Not investment advice
Start with your bill
As of the EIA Short-Term Energy Outlook released Oct. 6, 2026 (next update Nov. 10)
Here is the number that matters at the kitchen table. ENB math from EIA’s forecasts: the average American household is on track to spend about $1,931 on electricity this year, up from about $1,710 in 2024. That is roughly $221 more a year, or about $18 a month, before a single new data center plugs in near you. We got there by multiplying EIA’s average residential price (18.24¢ per kWh in 2026) by its average use per home (about 10,587 kWh) (EIA STEO; ENB calculation).
Where you live changes the story. In July, households in Massachusetts paid 30.49¢ a kWh and New Yorkers paid 29.90¢, up 14% from a year earlier. Texans paid 15.88¢. The national average was 18.31¢ (EIA Electric Power Monthly, Table 5.6.A). On a 1,000-kWh month, that is about $305 in Massachusetts against $159 in Texas (ENB calculation).
This Article is written jointly with Steve Reese, CEO of Reese Energy Consulting, and Stu Turley, Energy News Beat, and we will be covering this article on a future episode with Steve and Stu on the Energy News Beat Podcast.
Natural gas is the reason those numbers move together. It made about 40% of America’s electricity in 2026, by EIA’s count, and about 57% of New England’s in 2024 (EIA STEO, Table 7d; ENB calculation). Gas itself is not expensive right now. November gas futures settled at $3.198 per MMBtu on Oct. 14 (CME settlement via FinancialJuice). The fight is over who gets the next molecule: the LNG tanker in Louisiana, the AI campus in Virginia or Texas, the factory, or the power plant that heats your home in January.
| The 60-second version
Demand: U.S. LNG exports averaged 10.6 Bcf/d in 2022. EIA expects 17.6 in 2026 and 18.6 in 2027 (EIA STEO). Data centers used about 4.4% of U.S. electricity in 2023. LBNL’s new reference case has them at 11.8% by 2030 (LBNL 2024; LBNL 2025 Update). Wall Street estimates for the gas behind them, as reported, run from +4.8 Bcf/d (Morgan Stanley via Investing.com) to +6.1 Bcf/d (RBC Capital Markets) by 2030. Supply: The gas is there. Production keeps rising, and the Permian keeps getting gassier, at about 4.34 Mcf of gas per barrel of oil in 2026 (EIA STEO; ENB calculation). The bottleneck is pipe. Waha gas in West Texas hit −$9.52 in April (NGI), while New England burned oil and imported LNG during January’s cold snap (ISO-NE market monitor). Grid risk: Gas is the backbone, and its weak spot is the deep freeze. Winter Storm Fern shut in 18.3 Bcf/d of production at its peak (Wood Mackenzie). The grid held, but NERC’s CEO said it came “close to the edge” (FERC-NERC). The bridge: DOE is using emergency orders to keep coal units running. Crane (Three Mile Island) is due back in 2027, Palisades is paused after a fuel-handling problem, and TVA holds the first SMR construction permit but no start date (DOE 202(c); Inquirer; Federal Register). Make every molecule count: America vented and flared about 0.92 Bcf/d in 2024 (EIA; ENB unit conversion). Better measurement, fewer leaks, and less flaring will not replace a pipeline, but they turn waste into sales and royalties. Much like AI – AI is worthless without verification, and natural gas can’t be invoiced, billed, or accounted for unless you have the right tools and accounting procedures in place. |
| Stu’s Take (opinion)
Energy security starts at home. Before we argue about who gets the gas, we owe American families power they can afford in January. I am bullish on LNG. Exports went from 0.5 Bcf/d in 2016 to 15.0 Bcf/d in 2025. That is energy dominance you can load on a ship, and it pays American workers and royalty owners. But exports are heading toward 18.6 Bcf/d in 2027, so we have to build the pipes at home to match. New England paid $6.53 billion for one winter of wholesale power, up 45%, as a cold snap drove gas to $17.79 and forced oil and LNG burn (ISO-NE IMM). In my view, blocked pipelines like Constitution are a big reason the region is so exposed (ENR on Constitution). Data centers are welcome, if they bring their own power or pay for it. A tech company should not be able to push the on-track $221-a-year bill increase (ENB math from EIA) any higher for a retired teacher in Ohio. The Energy Bad Boys (Isaac Orr and Mitch Rolling of Always On Energy Research, a mandate-critical energy think tank) put new gas at $60–86/MWh for round-the-clock data center load, the cheapest option in every grid region they studied. Do not shut down coal plants that still work until the replacement is running. Coal is the bridge and nuclear is the destination. The Vogtle bill, about $35 billion, tells you the bridge has to last a while. And let us stop wasting gas: 0.92 Bcf/d vented and flared is more than one Golden Pass train. |
Part 1. Who wants the gas
LNG: the biggest new customer is already here
As of EIA Today in Energy, Sept. 1, 2026; DOE filing Oct. 1, 2026
LNG is not a forecast anymore. U.S. LNG exports averaged 17.4 Bcf/d in the first half of 2026, up 23% from a year earlier. Plaquemines LNG was running at full capacity, and Corpus Christi Stage 3 was on six of its seven trains. Together, the two projects add 4.0 Bcf/d of nominal capacity (EIA). Cheniere declared Stage 3 complete on Aug. 28, bringing its platform to about 56 million tonnes a year (Cheniere). Golden Pass in Texas shipped its first cargo in April (EIA). Its Oct. 1 report to DOE says Train 2 is still being commissioned (Golden Pass filing to DOE).
The world wants it. Europe’s TTF benchmark averaged $14.74 and Asia’s JKM $15.56 per MMBtu in the first half, and U.S. exports to Asia rose 108% (EIA). The IEA says the Strait of Hormuz disruption has affected around 20% of global LNG trade flows (IEA Global Methane Tracker 2026; see our Hormuz coverage). That is why EIA has U.S. exports averaging 17.6 Bcf/d this year and 18.6 next year (STEO). From 2024 to 2027, that is +6.7 Bcf/d, more new demand than any other use of gas (ENB calculation).
More is coming. At the end of October 2025, EIA counted 15.4 Bcf/d of U.S. export capacity and 13.9 Bcf/d more planned through 2029 (EIA). EIA also says U.S. capacity will nearly double by 2031 compared with December 2025 (EIA).
Data centers: big numbers, wide ranges
As of LBNL June 2026; EPRI Feb. 2026; ERCOT Apr. 15, 2026; PJM Jan. 2026; NERC Jan. 29, 2026
Every serious forecast says data centers will use a lot more power. They disagree on how much. Lawrence Berkeley National Laboratory found data centers used 176 TWh in 2023, about 4.4% of U.S. electricity (LBNL 2024). Its June 2026 update puts them at 649 TWh in 2030, or 11.8%, with a range of 521–843 TWh (LBNL 2025 Update). EPRI’s range is 9% to 17% of U.S. electricity by 2030, up from 4–5% now (EPRI).
The grid operators see the same wave. ERCOT’s preliminary forecast has Texas peak demand reaching 367,790 MW by 2032. The all-time record is 85,508 MW. ERCOT itself says the number will be revised once it sorts real projects from speculative ones (ERCOT). PJM, the largest U.S. grid, expects its summer peak to reach about 222,106 MW in 2036, up 65,733 MW in ten years (PJM). NERC’s forecast of 10-year growth in North American summer peak demand has gone from 55 GW in its 2022 LTRA to 224 GW in its 2025 LTRA (NERC). EIA expects commercial-sector power sales, the category that includes data centers, to grow 3.8% in 2026 (EIA).
Chart 3. NERC’s North American 10-year summer peak-demand growth forecast, by assessment year (GW). Source: NERC 2025 LTRA.
How much of that is gas? The wide range comes from the assumptions. Morgan Stanley’s probability-weighted base case is +4.8 Bcf/d by 2030, as reported by Investing.com (Investing.com). RBC’s Christopher Louney puts data-center gas at about 6.1 Bcf/d by 2030 (RBC Capital Markets). East Daley Analytics has used 4.2–6.1 Bcf/d, assuming gas covers about 40% of the new load, as reported on its site (East Daley). EQT, the country’s largest gas producer and an interested party, sees about 10 Bcf/d of new gas-fired power demand by 2030 in its base case and 18 in its upside case, counting both data centers and coal retirements (EQT).
The mandate-critical side of the debate is blunter. Isaac Orr and Mitch Rolling of the Energy Bad Boys (of Always On Energy Research, a mandate-critical energy think tank) modeled 24/7 data-center load in seven grid regions. They found new gas at $60–86 per MWh was the lowest-cost option in every one. Wind, solar and batteries sized to run around the clock cost $307/MWh in ERCOT, their cheapest region, about five times gas (Energy Bad Boys). They also count 151 GW of data-center-dedicated gas projects in states Trump won, against 6.25 GW in states he lost (Energy Bad Boys).
Their think tank, Always On Energy Research, warns against counting chickens. Georgia Power cut its forecast by 6 GW, and AEP Ohio’s requests fell from 30 GW to 13 GW once a tariff made customers put money down. PG&E reports data-center load factors near 67%, not the 80–90% many planners assume. If utilities overbuild for load that never shows up, ratepayers carry the stranded cost (AOER).
Chart 4. Forecasts of added gas demand by about 2030 (Bcf/d), compared with planned LNG capacity. Methods differ, so the bars should not be added. Sources: EIA; EQT; RBC and Morgan Stanley as reported.
Plain-English takeaway: LNG is the bigger near-term claim on gas, and it is mostly under contract. Data centers are the bigger question mark. Both point the same way: more gas, more pipe, and more pressure on the power plants that serve you. For more, see ENB’s earlier pieces on the new energy boom, 20-year gas and LNG demand and whether data centers are raising rates.
Part 2. Where the gas comes from, and where it gets stuck
The Permian is getting gassier
As of EIA STEO Oct. 6, 2026; Waha prices through Oct. 9, 2026
Most new U.S. gas does not come from gas wells. It is associated gas rich in NGLs that comes up with oil in West Texas and New Mexico. EIA’s numbers show Permian gas rising from 20.1 Bcf/d in 2022 to 29.5 in 2026 and 32.0 in 2027. Oil grows more slowly, so the gas-to-oil ratio climbs from 3.72 to 4.49 Mcf per barrel (EIA STEO; ENB calculation). U.S. marketed gas production rises from 113.1 Bcf/d in 2024 to 127.9 in 2027 (EIA STEO).
When the pipes fill up, producers may have to pay someone to take their gas. On April 15, Waha cash prices hit an all-time low of −$9.52 per MMBtu (NGI). New pipe has helped. Matterhorn Express (2.5 Bcf/d) started in late 2024, and the World Bank credits it with cutting U.S. flaring (World Bank). The GCX expansion (0.57 Bcf/d) began commissioning in June (Wood Mackenzie). Energy Transfer’s Hugh Brinson (1.5 Bcf/d) entered service in June (Energy Transfer). Blackcomb (2.5 Bcf/d) is targeted for the fourth quarter (Targa). By Oct. 9, Waha had climbed back to $1.89, still well under Henry Hub (InHedge).
Appalachia has the gas. The Northeast has the “no.”
As of court rulings Aug. 21 and Sept. 8, 2026; FERC deadline Nov. 19, 2026
Appalachia, the Marcellus and Utica, is the biggest gas basin in the country at about 37.1 Bcf/d this year (EIA STEO). The Mountain Valley Pipeline finally started in June 2024 with 2 Bcf/d of capacity, years late (Reuters). The pipes that would carry that gas into New York City and New England are still tied up in permits.
- NESE (Williams/Transco): a $1 billion, 400,000-dekatherm-a-day line under New York Harbor. The Second Circuit upheld New York’s water permit on Aug. 21 (ENR). On Sept. 8 the Third Circuit vacated New Jersey’s water-quality certificate and sent it back to the state (3rd Cir., No. 26-1252).
- Constitution: a 125-mile, 650,000-dekatherm-a-day line from Pennsylvania into New York. FERC’s environmental assessment found no significant impact, and the federal decision deadline is Nov. 19, 2026 (Federal Register). New York’s DEC wants a new environmental impact statement. Developers are targeting May 2028 (ENR; Williams).
When pipes do not get built, New England fills the gap with tankers and oil. During this winter’s 19-day cold snap (Jan. 23–Feb. 10), the region’s LNG sendout was 45.9 million MMBtu, about double the prior winter. Oil generation averaged about 4,000 MW during the cold snap, and oil’s share of supply rose from 2% to 6%. Wholesale costs hit $6.53 billion, up 45% and the highest since 2014. Gas averaged $17.79/MMBtu, and Algonquin traded near $122 on Jan. 27 (ISO-NE Internal Market Monitor). DOE issued a 202(c) emergency order covering 57 New England resources from Jan. 25 to Feb. 14 (ISO-NE).
Prices are not only about pipes. Every state on that chart has its own mix of taxes, mandates, wire costs, and weather. Connecticut’s price fell 12% this July. But the pattern is hard to miss. ENB reading: the states that have blocked gas pipes are among those paying the most. ENB covered the heating-oil side of this in “Nearly $1,700 to fill the tank.”
Part 3. How much gas on the grid is too much?
As of EIA STEO Oct. 6, 2026; FERC-NERC review Sept. 10, 2026
There is no magic number. The real question is whether gas is firm, meaning whether the plant has gas under contract on a pipeline that keeps flowing when it is 5°F outside. EIA puts gas at about 42% of U.S. power-sector generation in 2024 and 39% in 2027. The regional picture is different. New England was 57% gas in 2024, New York 51%, ERCOT 46%, PJM 45%, and MISO 36% (EIA STEO Table 7d; ENB calculation).
Winter is the test, and the record is mixed:
- Uri (Feb. 2021): ERCOT shed up to 20,000 MW of load. Generators logged 4,124 outages, derates or failed starts, and freezing and fuel problems caused most of the unplanned outages (FERC-NERC).
- Elliott (Dec. 2022): 90,500 MW of generation was unavailable at the same time across the East, and utilities shed more than 5,400 MW of firm load (FERC-NERC).
- Fern (Jan. 2026): 3 Bcf/d of gas production froze off at the peak, about 17% of supply, and cumulative losses topped 120 Bcf (Wood Mackenzie). This time the grid held, with no significant disruptions. FERC and NERC credited winterization, coordination and emergency orders, and called for more gas infrastructure. NERC CEO Jim Robb said the system was “close to the edge” (FERC-NERC).
NERC’s 2025 long-term assessment warns that new resources are not arriving as fast as demand. It recommends managing generator retirements and coordinating electric and gas planning and operations (NERC). In PJM, the 2028/29 capacity auction cleared at the $325/MW-day price cap. Total cost was about $16.4 billion, and the region came up 6,831 MW short of its reliability target (PJM; Utility Dive). ENB has followed PJM’s emergency steps here and here.
ENB reading: Gas is the right backbone for a fast-growing grid. It is cheap, dispatchable, and American. But a grid that runs 50%-plus on gas without firm pipeline capacity, dual-fuel backup or onsite storage is betting the coldest night of the year on wellheads not freezing. Diversity is insurance. Coal piles, nuclear fuel and oil tanks do not depend on a pipeline when it is 5°F.
Part 4. Coal as the bridge until nuclear scales: both sides
What DOE is doing
As of DOE 2026 202(c) orders page, checked Oct. 15, 2026
DOE has used Section 202(c) of the Federal Power Act again and again this year to keep plants that were slated to retire running. Its 2026 orders page lists orders covering Campbell in Michigan (1,560 MW, through Nov. 14), Eddystone 3 and 4 in Pennsylvania (through Nov. 20), Centralia 2 in Washington, Craig 1 in Colorado, Schahfer 17/18 and Culley 2 in Indiana, and a PJM-wide order effective Oct. 13–16 (DOE). Retirements are slowing on their own as well. In 2025 utilities planned to retire 12.3 GW but retired only 4.6 GW, including just 2.6 GW of the 8.0 GW of coal on the list. Another 6.4 GW of coal is scheduled for 2026 (EIA).
The case for the bridge (mandate-critical perspective)
Orr and Rolling (Energy Bad Boys / Always On Energy Research, mandate-critical) looked at 82 coal plants with FERC Form 1 data. They found existing coal runs at an average $45.57/MWh, with 77% of plants under $60. Campbell was among the cheapest at about $30/MWh and ran at 64–80% capacity factor during Fern. Their argument: retiring working plants before replacements exist is what got the grid into this hole (Energy Bad Boys; ENB coverage).
The case against
On Sept. 11 the D.C. Circuit unanimously vacated DOE’s first Campbell order. Judge Pillard wrote that the emergency power is narrow and that DOE had not shown an imminent emergency (D.C. Circuit opinion). Michigan Attorney General Dana Nessel, who brought the case and opposes the orders, called them unlawful (Michigan AG). Consumers Energy reported a $259 million net cost for complying from May 2025 through June 2026, and it wants FERC to spread that cost across the region (Utility Dive). The same Bad Boys analysis concedes that some plants are expensive: Schahfer ran about $110/MWh, second-highest of the 82, though it ran near full output during Fern (Energy Bad Boys).
Clean coal and carbon capture: real, but costly
Carbon capture works but has not been cheap. Petra Nova in Texas, a $1 billion project, captured 92.4% of the CO2 in the flue-gas slipstream it treated. It was placed in reserve shutdown in May 2020 when oil prices collapsed and restarted in September 2023, with a design rate of about 1.4 million tonnes a year (POWER). The Clean Air Task Force, an environmental group that supports CCS, notes it captured 83% of planned volume over 2017–2019 (CATF). SaskPower’s Boundary Dam 3 cost C$1.47 billion, and its output drops from 150 MW to about 115 MW when capture runs (CATF). It averaged 2,598 tonnes a day in the first quarter of 2026 (SaskPower). The Energy Bad Boys estimate coal with CCS and new nuclear at $122–187/MWh for data-center load, well above new gas but below their wind-solar-battery cases (Energy Bad Boys).
Nuclear: the destination, on a slow road
- Vogtle 3 & 4 (Georgia): online, but at a total cost AP reported at roughly $35 billion, more than double the original estimate (AP).
- Crane / Three Mile Island Unit 1 (Pennsylvania): Constellation plans fuel load in spring 2027 and power later that year. FERC let it reuse 760 MW of interconnection rights from Eddystone (Philadelphia Inquirer).
- Palisades (Michigan): fuel loading began in late August and paused after an assembly tipped. The NRC approved a plan to remove the damaged assembly on Oct. 13. The plant has not yet restarted (Michigan Advance).
- TVA Clinch River BWRX-300 (Tennessee): The first U.S. construction permit for this small modular reactor design was issued Sept. 28. TVA still needs an operating license (Federal Register; World Nuclear News).
ENB reading: On the evidence, a bridge makes sense. Keep the low-cost, high-availability coal units running until the gas plants, pipes, and reactors that replace them are actually online. Retire the expensive, rarely used units on a schedule. Then have someone other than local ratepayers pay for keeping them open in the name of regional reliability. Nuclear restarts are the fastest firm, carbon-free megawatts available, and new builds are measured in years, not quarters.
Part 5. Make every molecule count
As of EIA natural gas annual data released Sept. 30, 2026; World Bank June 23, 2026; IEA Global Methane Tracker 2026
Before we argue over who gets the gas, we should ask how much we lose before anyone gets it. Some losses are a cost of doing business: compressors and processing plants burn gas to move and clean it. Some is waste. And some is simply not measured or sampled correctly within AGA standards, which affects the entire value chain from wellhead to burner tip, especially the net price to the producer.
Measurement and allocation
Every payment and pricing structure starts with a meter. Federal rules for onshore federal and Indian leases (43 CFR 3175) allow flow-rate uncertainty of ±3% on high-volume meters and ±2% on very-high-volume meters, and heating-value uncertainty of ±2% and ±1% (eCFR). GAO found that BLM’s gas-analysis reporting system, GARVS, “has never been operational,” so heating-value data are still handled manually (GAO-26-106475). In a separate report, GAO found $96 billion in federal oil and gas royalties over FY2014–2024 with net adjustments of about −$2.7 billion, and royalty management remains on GAO’s High-Risk list (GAO-26-107669). Standard wellhead midstream contracts only allow a 2% variance on measurement; however, the rule of thumb on larger high-pressure meters is 1%. Reese Energy Consulting is heavily involved in all basins, facilitating formal audits of these agreements and the measurement and sampling assets and practices of midstreamers, processors, and transporters.
ENB scenario (not a forecast): if measurement across the system were biased by just 1%, that would be about 1.18 Bcf/d of 2025 marketed production. At EIA’s 2025 Henry Hub average of $3.53, that is roughly $1.6 billion a year in gas value that moves between buyers, sellers, and royalty owners (ENB calculation from EIA STEO). Errors go both ways, so auditing does not create gas. It decides which party is operating within standards and operating prudently.
Lost and unaccounted-for gas
All midstream operators, transporters, and utilities report F, L, and U – “Fuel and lost and unaccounted-for gas”, the difference between gas received and gas delivered. Part of this “loss” is actual fuel used in compression and plant operations necessary for getting wellhead gas into pipeline specifications and also moving it through various pressure increases to be able to enter the transmission systems. The lost and unaccounted for volumes reflect poor operating practices which result in molecules that will not be sold in the marketplace or end up with an end user. Reese’s auditing work over the years has uncovered tens of millions of dollars of value of this lost gas and has recovered over $35 million for U.S. gas producers. Every producing basin in the U.S. has this issue both from an accounting and operational standpoint. Prudent producers continually bring in this 3rd party expertise and part of their corporate governance program.
Flaring and venting
EIA reports that 335,163 million cubic feet were vented or flared in 2024, about 0.92 Bcf/d (ENB unit conversion), up from 271,682 MMcf in 2022 (EIA). The World Bank, using satellite data, says U.S. flaring fell 0.4 bcm (7%) in 2025, the largest absolute drop of any country, with flaring intensity falling from 1.1 to 1.0 cubic meters per barrel. It credits Matterhorn Express for much of that (World Bank GGFT). The lesson is simple: pipelines cut flaring faster than lectures do.
Leaks and methane
EPA’s latest final inventory estimates U.S. natural gas systems emitted about 6,183 thousand tonnes of methane in 2022. Production accounted for 3,202 kt, gathering and boosting 1,528, transmission and storage 1,413, distribution 544 and processing 541 (EPA GHG Inventory; EPA). Converted at about 19.2 grams per cubic foot, that is roughly 0.88 Bcf/d of methane. That is an ENB unit conversion of an emissions estimate. This is pursuant to older, low-pressure systems, bad operations, and must be monitored, especially for safety reasons.
What could recovering it add?
We only cite a recovery number where a source gives one. The International Energy Agency (an intergovernmental agency that supports emissions cuts) says nearly 100 bcm a year could be made available globally by cutting oil and gas methane, and another 100 bcm by ending non-emergency flaring. About 15 bcm could come quickly from exporters and importers working together (IEA). That is about 9.7 Bcf/d and 1.4 Bcf/d (ENB unit conversions). We found no U.S.-specific Bcf/d recovery estimate from EIA, EPA, PHMSA or GAO, and we are not inventing one.
Why it matters:
- Consumers: every Bcf/d that reaches a pipeline instead of a flare stack is supply that helps keep Henry Hub, and your bill, in check.
- Producers: captured gas is sold gas, and fewer flares mean fewer regulatory fights.
- Royalty owners: a percent of meter error is real money, and GAO’s findings say the federal checks are still partly manual.
- Investors: gathering, compression and measurement upgrades are capital projects with a clear payback when takeaway capacity exists and Waha is positive.
Part 6. How consumers and investors see it
Consumers
- Pew Research Center (nonpartisan): 75% of U.S. adults say home energy costs have gone up in the last few years, including 42% who say a lot. Among those, 64% blame utilities seeking more money as a major reason, 43% blame data centers and 40% blame grid upgrades (survey March 16–22, 2026) (Pew).
- AP-NORC/EPIC (nonpartisan): 84% are concerned that data centers will raise local electricity prices (AP-NORC/EPIC).
- Industrial Energy Consumers of America (manufacturers’ advocacy, buyers of gas): in January it asked DOE to suspend spot LNG exports to bring down gas and power prices, saying it is not against LNG exports (IECA).
Investors
- RBC Capital Markets (bank research): natural gas is powering the data-center boom, with about 6.1 Bcf/d of data-center gas by 2030 (RBC Capital Markets).
- Morgan Stanley (bank research, as reported): a probability-weighted +4.8 Bcf/d from data centers by 2030, and a U.S. gas market “on the cusp of a new cycle of demand growth” (com).
- EQT (producer, benefits from higher demand): about 10 Bcf/d of new gas-fired power demand by 2030 in its base case and 18 in its upside case (EQT).
- PJM capacity market: the 2028/29 auction cleared at the cap at about $16.4 billion. That is revenue for generators and cost for ratepayers (PJM).
Where they agree: both groups want more firm supply. Where they split: investors see gas demand as a growth story. Consumers see higher bills and ask who pays for the new wires and plants. The fair answer is that large new loads pay for what they cause.
What to watch next
- 10: EIA’s next Short-Term Energy Outlook, with updated LNG and power-burn forecasts (EIA).
- 14–Dec. 25: current DOE 202(c) orders for Campbell, Eddystone, Wagner, Stanton, Centralia, Schahfer, Culley and Craig expire on a rolling basis unless renewed (DOE).
- 19: FERC’s federal authorization deadline for the Constitution pipeline (Federal Register).
- Q4 2026: Blackcomb full service (Targa); Golden Pass Train 2 (Golden Pass filing to DOE).
- Mid-to-late December: ERCOT’s revised long-term load forecast (ERCOT).
- Winter 2026–27: NERC’s winter reliability assessment, and whether New England again leans on LNG and oil (ISO-NE).
- 2027: Crane restart; Golden Pass Train 3; the NESE target date (Q4 2027) (Inquirer; EIA; ENR).
The bottom line
America does not have a gas shortage. It has a pipe and a policy problem, and a winter problem. LNG exports are the biggest new customer, and they make America stronger abroad. Data centers could be the next one, if they pay their way. Families are on track to pay about $221 more this year for electricity than in 2024 (EIA forecast; ENB calculation), and New Englanders far more. The fix is not to pick one customer over another. It is to build the pipes, keep working plants open until their replacements run, bring nuclear back, and stop wasting the gas we already produce. Energy security starts at home.
Have a different read on the numbers? Tell us. At Energy News Beat, we would rather be corrected than be wrong. More: ENB data-center coverage • Energy security starts at home.
https://reeseenergyconsulting.com/
For Natural Gas Auditing, reach out to the Reese Energy Consulting Team.
Appendices
At Energy News Beat we Make Appendices Great Again.
Appendix A. Sources and perspective labels
| # | Source | Publisher | Date / time | Perspective |
| 1 | Short-Term Energy Outlook, October 2026 (report and STEO_m.xlsx data tables) | U.S. Energy Information Administration (EIA) | Oct. 6, 2026 (next release Nov. 10, 2026) | Government statistics (independent) |
| 2 | STEO October 2026 monthly data workbook (Tables 4, 5, 7, 8) | EIA | Oct. 6, 2026 | Government statistics (independent) |
| 3 | EIA press release on the October 2026 STEO (electricity demand, data centers) | EIA | Oct. 6, 2026 | Government statistics (independent) |
| 4 | U.S. LNG exports rose 23% in the first half of 2026 because of higher capacity | EIA, Today in Energy | Sept. 1, 2026 | Government statistics (independent) |
| 5 | Golden Pass LNG ships its first cargo (Today in Energy) | EIA, Today in Energy | 2026 | Government statistics (independent) |
| 6 | North America LNG export capacity set to more than double by 2029 | EIA, Today in Energy | Oct. 2025 | Government statistics (independent) |
| 7 | U.S. LNG exports, 2016–2025, and capacity outlook | EIA, Today in Energy | 2026 | Government statistics (independent) |
| 8 | Planned vs. actual U.S. generator retirements in 2025; 2026 schedule | EIA, Today in Energy | 2026 | Government statistics (independent) |
| 9 | Electric Power Monthly Table 5.6.A: average price of electricity by state, July 2026 and July 2025 | EIA | Released Sept. 24, 2026 (July 2026 data) | Government statistics (independent) |
| 10 | U.S. natural gas vented and flared (annual, MMcf) | EIA | Released Sept. 30, 2026 | Government statistics (independent) |
| 11 | U.S. natural gas gross withdrawals and production (annual) | EIA | Released Sept. 30, 2026 | Government statistics (independent) |
| 12 | U.S. natural gas consumption by end use, incl. lease, plant and pipeline fuel (annual) | EIA | Released Sept. 30, 2026 | Government statistics (independent) |
| 13 | Golden Pass LNG semi-annual report to DOE (Train 2 commissioning status) | Golden Pass LNG Terminal LLC filing, posted by DOE | Oct. 1, 2026 | Company filing to government |
| 14 | 2026 DOE 202(c) orders (Federal Power Act emergency orders) | U.S. Department of Energy, CESER | page checked Oct. 15, 2026 | Government (administration policy) |
| 15 | Michigan v. DOE, No. 25-1159 (D.C. Cir.) opinion vacating the first Campbell 202(c) order | U.S. Court of Appeals, D.C. Circuit | Sept. 11, 2026 | Court ruling |
| 16 | Federal appeals court vacates first DOE order forcing operation of J.H. Campbell coal plant | Michigan Attorney General Dana Nessel | Sept. 11, 2026 | State government (party to the case, opposes the orders) |
| 17 | Court rejects DOE ‘emergency’ order delaying coal plant retirement as overstep (incl. Consumers Energy $259M net cost) | Utility Dive | Sept. 2026 | Trade press |
| 18 | 2025 Long-Term Reliability Assessment (infographic and report) | North American Electric Reliability Corp. (NERC) | Jan. 29, 2026 | Grid reliability regulator (independent) |
| 19 | Resource adequacy risks intensify across North America as demand growth surges | NERC | Jan. 2026 | Grid reliability regulator (independent) |
| 20 | FERC, NERC review shows bulk-power system improvements during Winter 2026 Arctic cold period | FERC and NERC | Sept. 10, 2026 | Federal regulator (independent) |
| 21 | The February 2021 cold weather outages in Texas and the South Central United States (final report) | FERC, NERC and Regional Entities | Nov. 16, 2021 | Federal regulator (independent) |
| 22 | Inquiry into bulk-power system operations during December 2022 Winter Storm Elliott | FERC and NERC | Oct. 2023 | Federal regulator (independent) |
| 23 | ERCOT releases preliminary long-term load forecast for 2026–2032 | ERCOT | Apr. 15, 2026 | Grid operator |
| 24 | PJM 2026 Long-Term Load Forecast Report | PJM Interconnection | Jan. 2026 | Grid operator |
| 25 | 2028/2029 Base Residual Auction results report | PJM Interconnection | July 14, 2026 | Grid operator |
| 26 | PJM capacity prices hit price cap, reserve shortfall grows (incl. Jefferies comment) | Utility Dive | July 2026 | Trade press |
| 27 | Winter 2026 Quarterly Markets Report | ISO New England Internal Market Monitor | July 21, 2026 | Grid operator market monitor (independent unit) |
| 28 | Winter 2025/2026 recap: grid stays reliable during prolonged cold | ISO New England (ISO Newswire) | Mar. 5, 2026 | Grid operator |
| 29 | 43 CFR Subpart 3175: measurement of gas (uncertainty limits, §3175.31) | BLM / eCFR | current | Federal regulation |
| 30 | GAO-26-106475, Oil and Gas: actions needed to improve data sharing (gas measurement data, GARVS) | U.S. Government Accountability Office | Jan. 21, 2026 | Congressional watchdog (nonpartisan) |
| 31 | GAO-26-107669, federal oil and gas royalties: adjustments and revisions | U.S. Government Accountability Office | Dec. 15, 2025 | Congressional watchdog (nonpartisan) |
| 32 | Report to Congress on lost and unaccounted-for natural gas metrics | PHMSA, U.S. DOT | May 16, 2017 | Federal safety regulator |
| 33 | Inventory of U.S. Greenhouse Gas Emissions and Sinks: 1990–2022 (natural gas systems) | U.S. EPA | Apr. 2024 (latest final inventory) | Government statistics |
| 34 | Natural gas and petroleum systems in the GHG Inventory | U.S. EPA | page checked Oct. 2026 | Government statistics |
| 35 | Global Gas Flaring Tracker Report, June 2026 | World Bank, Global Flaring and Methane Reduction Partnership | June 23, 2026 | Multilateral development bank (pro-flaring-reduction program) |
| 36 | Global Methane Tracker 2026: key findings | International Energy Agency | 2026 | Intergovernmental agency (supports emissions cuts) |
| 37 | TVA Clinch River Nuclear Unit 1: construction permit and record of decision | Federal Register (NRC) | Oct. 5, 2026 (permit issued Sept. 28) | Federal regulator |
| 38 | First construction permit issued for BWRX-300 SMR in the US | World Nuclear News | Sept. 2026 | Nuclear trade press (industry association publication) |
| 39 | 2024 United States Data Center Energy Usage Report | Lawrence Berkeley National Laboratory | Dec. 2024 | National lab research (DOE-funded) |
| 40 | United States Data Center Energy Usage Report: 2025 Update | Lawrence Berkeley National Laboratory | June 2026 | National lab research (DOE-funded) |
| 41 | Powering Intelligence 2026: executive summary | Electric Power Research Institute (EPRI) | Feb. 2026 | Utility-funded research institute |
| 42 | Natural gas powers the data center boom (Christopher Louney) | RBC Capital Markets | May 2026 | Investment bank research |
| 43 | Morgan Stanley identifies best gas stocks amid AI data center boom | Investing.com (reporting Morgan Stanley research) | Feb. 2026 | Investment bank research (as reported) |
| 44 | Data centers could add 6 Bcf/d to gas demand: EDA forecast | East Daley Analytics | 2025 | Midstream analytics firm (commercial) |
| 45 | EQT Q2 2026 earnings presentation (gas demand outlook) | EQT Corp. | July 2026 | Producer (largest U.S. gas producer; benefits from higher demand) |
| 46 | Winter Storm Fern shuts in 18.3 bcfd of US gas production at its peak | Wood Mackenzie | Jan. 2026 | Energy consultancy |
| 47 | Gulf Coast Express expansion begins commissioning | Wood Mackenzie | June 2026 | Energy consultancy |
| 48 | Midday snapshot: natural gas cash prices slide sharply as Waha hits new low | NGI (Natural Gas Intelligence) | Apr. 15, 2026 | Energy trade press / price reporter |
| 49 | Waha price falls and its discount to Henry Hub widens | InHedge Intelligence | Oct. 2026 (data through Oct. 9) | Commodity analytics firm |
| 50 | NYMEX natural gas November futures settle at $3.1980/MMBtu | FinancialJuice (CME settlement) | Oct. 14, 2026 | Market news wire |
| 51 | Energy Transfer Q2 2026 earnings release (Hugh Brinson pipeline in service) | Energy Transfer / SEC EDGAR | Aug. 2026 | Company (SEC filing) |
| 52 | Targa Resources Q2 2026 earnings call transcript (Blackcomb on track for Q4 2026) | Benzinga | 2026 | Company remarks (transcript) |
| 53 | Cheniere announces substantial completion of CCL Stage 3 project | Cheniere Energy | Aug. 31, 2026 | Company (LNG exporter) |
| 54 | US Mountain Valley natural gas pipeline begins operations | Reuters | June 14, 2024 | Wire news |
| 55 | Court backs New York approval of $1B Williams gas pipeline | Engineering News-Record | Aug. 2026 | Trade press |
| 56 | NRDC v. NJDEP, No. 26-1252 (3d Cir.): order vacating New Jersey water quality certification for NESE | Justia (3rd Circuit opinion) | Sept. 8, 2026 | Court ruling |
| 57 | Feds advance 125-mile Constitution gas pipeline for NY despite challenge | Engineering News-Record | Sept. 2026 | Trade press |
| 58 | FERC environmental assessment notice, Constitution Pipeline (federal authorization deadline Nov. 19, 2026) | Federal Register | Aug. 26, 2026 | Federal regulator |
| 59 | Constitution Pipeline project page | Williams Companies | checked Oct. 2026 | Company (pipeline developer) |
| 60 | Petra Nova carbon capture unit is up and running again, says JX Nippon | POWER Magazine | Sept. 2023 | Trade press |
| 61 | BD3 status update: Q1 2026 | SaskPower | 2026 | Utility (plant owner) |
| 62 | Carbon capture and storage: what can we learn from the project track record? | Clean Air Task Force | 2023 | Environmental advocacy group (supports CCS as a climate tool) |
| 63 | A second new nuclear reactor is completed in Georgia. The carbon-free power comes at a high price | Associated Press | Apr. 2024 | Wire news |
| 64 | Regulators approve plan to remove damaged fuel assembly at Palisades | Michigan Advance | Oct. 15, 2026 | Nonprofit state news |
| 65 | Three Mile Island nuclear plant on track to reopen next year | Philadelphia Inquirer | June 15, 2026 | Regional news |
| 66 | The Renewable Data Center Fantasy (Mitch Rolling and Isaac Orr) | Energy Bad Boys (Substack) | Aug. 22, 2026 | Mandate-critical / energy think tank (Energy Bad Boys = Isaac Orr & Mitch Rolling of Always On Energy Research) |
| 67 | Debunking the Myth of Expensive Coal Plants (Mitch Rolling and Isaac Orr) | Energy Bad Boys (Substack) | June 27, 2026 | Mandate-critical / energy think tank (Energy Bad Boys = Isaac Orr & Mitch Rolling of Always On Energy Research) |
| 68 | A Nation Divided by Natural Gas | Energy Bad Boys (Substack) | Sept. 12, 2026 | Mandate-critical / energy think tank (Energy Bad Boys = Isaac Orr & Mitch Rolling of Always On Energy Research) |
| 69 | Data Centers: Counting Gigawatts Before They Hatch | Always On Energy Research | June 2026 | Mandate-critical / energy think tank (Always On Energy Research; same authors as Energy Bad Boys) |
| 70 | Many Americans hold utility companies responsible for rising home energy bills | Pew Research Center | May 6, 2026 (survey March 16–22) | Nonpartisan survey research |
| 71 | 2026 AP-NORC/EPIC energy poll: press release | AP-NORC Center and University of Chicago EPIC | Sept. 2026 | Nonpartisan survey research |
| 72 | Letter to Secretary Wright urging suspension of spot LNG exports | Industrial Energy Consumers of America (IECA) | Jan. 28, 2026 | Manufacturers’ advocacy group (gas buyers; favors limits on LNG exports) |
| 73 | The New Energy Boom: Data Centers, LNG and America’s Gas Advantage | Energy News Beat | 2026 | ENB coverage |
| 74 | What Does the Demand for Natural Gas and LNG Look Like for the Next 20 Years? | Energy News Beat | archive | ENB coverage |
| 75 | Debunking the Myth of Expensive Coal Plants: Energy Bad Boys Bring the Receipts | Energy News Beat | 2026 | ENB coverage |
| 76 | Are Data Centers Driving Up Electricity Rates? Who Is Responsible? | Energy News Beat | 2026 | ENB coverage |
| 77 | Largest US Power Grid PJM Escalates Emergency Actions to Avoid Blackouts | Energy News Beat | 2026 | ENB coverage |
| 78 | AI Buildout Drives 76% Power Bill Jump on Largest US Grid, But Is AI the Only Reason? | Energy News Beat | 2026 | ENB coverage |
| 79 | Energy Security Starts at Home: Preparing for the Grid of Tomorrow (Conversations in Energy) | Energy News Beat | archive | ENB coverage |
| 80 | Hormuz Traffic Sinks and Saudi Oil Comes Under Fire: How Many Escape Routes Are Left? | Energy News Beat | Oct. 2026 | ENB coverage |
| 81 | Nearly $1,700 to Fill the Tank: The Heating Oil Shock Hits Northeast Kitchen Tables | Energy News Beat | Oct. 2026 | ENB coverage |
| 82 | Energy News Beat: data center coverage | Energy News Beat | ongoing | ENB coverage |
Appendix B. Key figures
| Figure | Value | Source |
| Avg. U.S. household electric bill 2024 / 2026F | $1,710 / $1,931 (+$221) | EIA STEO; ENB CALC |
| Residential price / use 2026F | 18.24¢/kWh; 10,587 kWh/yr | EIA STEO |
| July 2026 residential: MA / NY / U.S. / TX | 30.49 / 29.90 / 18.31 / 15.88 ¢/kWh | EIA EPM 5.6.A |
| U.S. LNG exports 2022 / 2025 / 2026F / 2027F | 10.59 / 15.09 / 17.57 / 18.62 Bcf/d | EIA STEO |
| LNG exports 1H26 / 2H26F / 1H27F | 17.4 / 17.3 / 18.7 Bcf/d | EIA TIE |
| Planned U.S. LNG capacity 2025–2029 | 13.9 Bcf/d | EIA TIE |
| U.S. power-sector gas burn 2024 / 2026F / 2027F | 36.78 / 36.98 / 37.03 Bcf/d | EIA STEO |
| Henry Hub 2025 / 2026F; Nov futures Oct. 14 | $3.53 / $3.48; $3.198 | EIA STEO; CME |
| Waha all-time low / Oct. 9 close | −$9.52 (Apr. 15) / $1.89 | NGI; InHedge |
| Permian gas / GOR 2026F | 29.53 Bcf/d; 4.34 Mcf/bbl | EIA STEO; ENB CALC |
| Appalachia / Haynesville 2026F | 37.12 / 16.83 Bcf/d | EIA STEO |
| Gas share of gen 2024: US / ISO-NE / ERCOT / PJM | 42.5% / 56.6% / 45.8% / 45.0% | EIA STEO 7d; ENB CALC |
| LBNL data centers 2023 / 2030 | 176 TWh (4.4%); 649 TWh (11.8%) | LBNL 2024; LBNL 2025 |
| EPRI share of U.S. electricity by 2030 | 9–17% | EPRI |
| Data-center gas by 2030: MS / RBC / EQT base | 4.8 / 6.1 / ~10 Bcf/d | MS via Investing.com; RBC; EQT (MS/RBC as reported) |
| NERC N. American 10-yr summer peak growth, 2022→2025 LTRA | 55 → 224 GW | NERC |
| ERCOT peak 2023 record / 2032 preliminary | 85,508 / 367,790 MW | ERCOT |
| PJM summer peak 2036 / 10-yr add | 222,106 / +65,733 MW | PJM |
| PJM 2028/29 BRA | $325/MW-day; $16.4B; 6,831 MW short | PJM |
| ISO-NE winter 2026 wholesale cost / LNG sendout | $6.53B; 45.9 million MMBtu | ISO-NE IMM |
| Fern peak freeze-offs | 18.3 Bcf/d (~17% of supply) | WoodMac |
| Uri load shed / Elliott coincident outages | 20,000 MW / 90,500 MW | FERC-NERC; FERC-NERC |
| Campbell 202(c) net cost | $259M (Consumers Energy; May 2025–June 30, 2026) | Utility Dive |
| EBB: avg existing coal / share under $60 | $45.57/MWh; 77% | Energy Bad Boys |
| EBB: new gas for 24/7 DC load | $60–86/MWh | Energy Bad Boys |
| Vented & flared 2024 | 335,163 MMcf ≈ 0.92 Bcf/d | EIA; ENB UNIT |
| EPA gas-systems methane 2022 | 6,183 kt ≈ 0.88 Bcf/d | EPA; ENB UNIT (not recovery) |
| IEA global methane made available | ~100 bcm ≈ 9.7 Bcf/d | IEA; ENB UNIT |
| World Bank U.S. flaring cut 2025 | −0.4 bcm (−7%) | World Bank |
| Pew: energy costs up / blame utilities / DCs | 75% / 64% / 43% | Pew |
| AP-NORC/EPIC: concerned DCs raise prices | 84% | AP-NORC |
Appendix C. Chart index
| Chart | What it shows | Primary sources |
| 1. Household bill | Annual bill 2022–2027F | EIA STEO; ENB CALC |
| 2. Gas demand stack | U.S. gas uses + exports, 2022–2027F | EIA STEO |
| 3. NERC forecast | N. American 10-year summer peak growth by LTRA year | NERC |
| 4. 2030 forecasts | LNG capacity vs. data-center gas forecasts | EIA; RBC; MS; EQT |
| 5. Permian GOR | Permian gas and Mcf/bbl, 2022–2027F | EIA STEO |
| 6. Permian takeaway | Pipes since 2024; Waha prices | NGI; World Bank; operators |
| 7. ISO-NE winter | Winter 2026 cost, LNG, oil | ISO-NE IMM |
| 8. State prices | July residential ¢/kWh by state | EIA EPM |
| 9. Gas share by region | 2024 vs. 2027F | EIA STEO 7d |
| 10. Winter storms | Uri, Elliott, Fern | FERC-NERC; WoodMac |
| 11. Timeline | LNG, pipes, nuclear 2026–2028 | Companies; DOE; courts |
| 12. Molecules | Vented/flared, fuel use, methane | EIA; EPA |
Appendix D. Methodology
- STEO numbers come from EIA’s October 2026 STEO_m.xlsx. Annual figures are the average of the 12 monthly values for that year. 2026 and 2027 are EIA forecasts (labeled F).
- Gas share of generation = NGEPGEN_region ÷ TOEPGEN_region from STEO Table 7d (ENB CALC). EIA labels MISO-area numbers as Midwest (MW).
- Household bill = residential ¢/kWh × annual kWh per customer ÷ 100 (ENB CALC). National average; your bill will differ.
- Permian GOR = Permian marketed gas (Bcf/d) ÷ Permian crude (million b/d), which equals Mcf per barrel (ENB CALC).
- Bcf/d from annual MMcf = MMcf ÷ days in year ÷ 1,000. 2024 was a leap year (366 days). Labeled ENB UNIT.
- Methane tonnes → Bcf/d uses ~19.2 grams of methane per standard cubic foot. Labeled ENB UNIT. Not a recoverable-supply estimate.
- bcm → Bcf/d uses 1 bcm ≈ 35.3147 Bcf, then ÷ 365 (ENB UNIT).
- Perspective labels are assigned to every source in Appendix A. “Mandate-critical / energy think tank” marks Energy Bad Boys and Always On Energy Research — the same authors (Isaac Orr and Mitch Rolling). Advocacy groups, banks, producers and manufacturers are labeled as such.
Appendix E. Timeline
| Date | Event | Source |
| June 14, 2024 | Mountain Valley Pipeline in service (2 Bcf/d) | Reuters |
| Oct. 2024 | Matterhorn Express in service (2.5 Bcf/d) | World Bank |
| Jan. 23–Feb. 10, 2026 | ISO-NE 19-day cold snap; Fern freeze-offs | ISO-NE; WoodMac |
| Apr. 15, 2026 | Waha hits −$9.52/MMBtu; ERCOT preliminary LTLF | NGI; ERCOT |
| Apr. 22, 2026 | Golden Pass first cargo | EIA |
| June 13, 2026 | Hugh Brinson in service | Energy Transfer |
| June 23, 2026 | World Bank Global Gas Flaring Tracker | World Bank |
| July 14, 2026 | PJM 2028/29 BRA clears at $325/MW-day | PJM |
| Aug. 21, 2026 | 2nd Circuit upholds NY NESE water permit | ENR |
| Aug. 28, 2026 | Cheniere CCL Stage 3 substantial completion | Cheniere |
| Sept. 8, 2026 | 3rd Circuit vacates NJ NESE certificate | 3rd Cir. |
| Sept. 10, 2026 | FERC-NERC Winter 2026 review | FERC-NERC |
| Sept. 11, 2026 | D.C. Circuit vacates first Campbell order | D.C. Cir. |
| Sept. 28, 2026 | NRC issues TVA Clinch River BWRX-300 construction permit | Federal Register |
| Oct. 1, 2026 | Golden Pass DOE semi-annual: Train 2 commissioning | DOE filing |
| Oct. 6, 2026 | EIA October STEO released | EIA |
| Oct. 13, 2026 | NRC approves Palisades fuel-assembly retrieval | Michigan Advance |
| Oct. 14, 2026 | Nov. NYMEX gas settles $3.198 | FinancialJuice |
| Oct. 15, 2026 | This Special Edition published | ENB |
Appendix F. Glossary
| Term | Plain-English meaning |
| Bcf/d | Billion cubic feet per day. Roughly: one Bcf/d can fuel a few million homes or one large LNG train. |
| GOR | Gas-to-oil ratio: how much gas (Mcf) comes up with each barrel of oil. |
| Henry Hub | The main U.S. gas price benchmark, in Louisiana. |
| Waha | A Permian Basin gas price hub in West Texas. Often trades below Henry Hub when pipes are full. |
| LNG | Liquefied natural gas. Gas chilled so it can be shipped on tankers. |
| 202(c) | Section 202(c) of the Federal Power Act. Lets DOE order plants to run in an emergency. |
| BRA | Base Residual Auction. PJM’s main capacity market, which pays generators to be available. |
| LAUF | Lost and unaccounted-for gas. The difference between gas received and delivered; mixes meter error and leaks. |
| Firm transport | A pipeline contract that guarantees delivery capacity, usually year-round. |
| SMR | Small modular reactor. Factory-built nuclear units smaller than traditional plants. |
Appendix G. Related ENB coverage
The new energy boom: data centers, LNG and America’s gas advantage • What does gas and LNG demand look like for the next 20 years? • Are data centers driving up electricity rates? • PJM escalates emergency actions • AI buildout and the 76% bill jump • Energy Bad Boys on coal plant costs • Energy security starts at home • Hormuz and LNG escape routes • Heating oil shock in the Northeast • Data center category.
Appendix H. Corrections and caveats
- Vogtle total cost: AP and secondary sources cite figures near $35–36.8 billion depending on what is included. We use “about $35 billion” and link the AP story. Re-check if you need a precise figure for a filing.
- Blackcomb initial rate: company target is Q4 2026 at 2.5 Bcf/d nameplate; trade commentary has suggested a lower initial rate. We mark the target date as a target.
- World Bank absolute U.S. flare volume: we quote the −0.4 bcm (−7%) change. We do not assert a 2025 absolute volume without the report’s table.
- EPA methane Bcf/d: ENB UNIT conversion only; not recoverable supply and not additive with EIA vented/flared.
- Hormuz ~20% of LNG trade: attributed to the IEA Global Methane Tracker 2026, not the EIA STEO.
- Morgan Stanley, RBC and East Daley gas-for-data-center Bcf/d figures: cited as reported via their public pages or Investing.com; not re-fetched from primary research notes.
- MVP Southgate and some SMR cost numbers were left out of the charts where we could not verify a clean primary source today.
- Nothing in this package has been posted. Replace [ARTICLE LINK] in the Publish Kit with the live URL after publishing.