

The largest U.S. regional transmission organization, PJM Interconnection, escalated emergency measures on July 3, 2026, issuing a federal alert to cut electricity consumption across its vast territory amid generator outages, overloaded high-voltage transmission lines, and surging air-conditioning demand from a prolonged heatwave.
PJM, which manages the electric grid for approximately 67 million people, activated demand-response programs directing utilities to reduce power to contracted large customers (such as factories and data centers) as a key step to prevent widespread blackouts. Wholesale electricity prices in constrained areas like northern Virginia spiked above $2,000 per megawatt-hour (MWh) — compared to roughly $40/MWh under normal conditions — driven largely by transmission congestion.
PJM Territory and Context
PJM coordinates wholesale electricity markets and grid operations across all or parts of 13 states plus Washington, D.C.: Delaware, Illinois, Indiana, Kentucky, Maryland, Michigan, New Jersey, North Carolina, Ohio, Pennsylvania, Tennessee, Virginia, and West Virginia.

PJM territory map (source: Energy Efficiency Alliance / PJM zones).
The region is experiencing record or near-record summer demand, with PJM forecasting peaks approaching or exceeding 166,000 MW — surpassing the previous summer record of about 165,563 MW set in 2006. Northern Virginia, home to the world’s largest concentration of data centers, has been particularly strained by transmission constraints.
PJM has issued a series of alerts since late June/early July 2026, including Hot Weather Alerts, Maximum Generation Alerts, and Load Management Alerts. On July 3, it activated emergency demand response after earlier pre-emergency measures. The U.S. Department of Energy issued emergency orders allowing temporary curtailment of large loads (data centers and other facilities ≥50 MW with backup generation) and waivers of certain environmental restrictions on fossil-fuel plants to maintain reliability through the holiday period. Demand eased on July 4 as the holiday reduced commercial load, with no major outages reported.
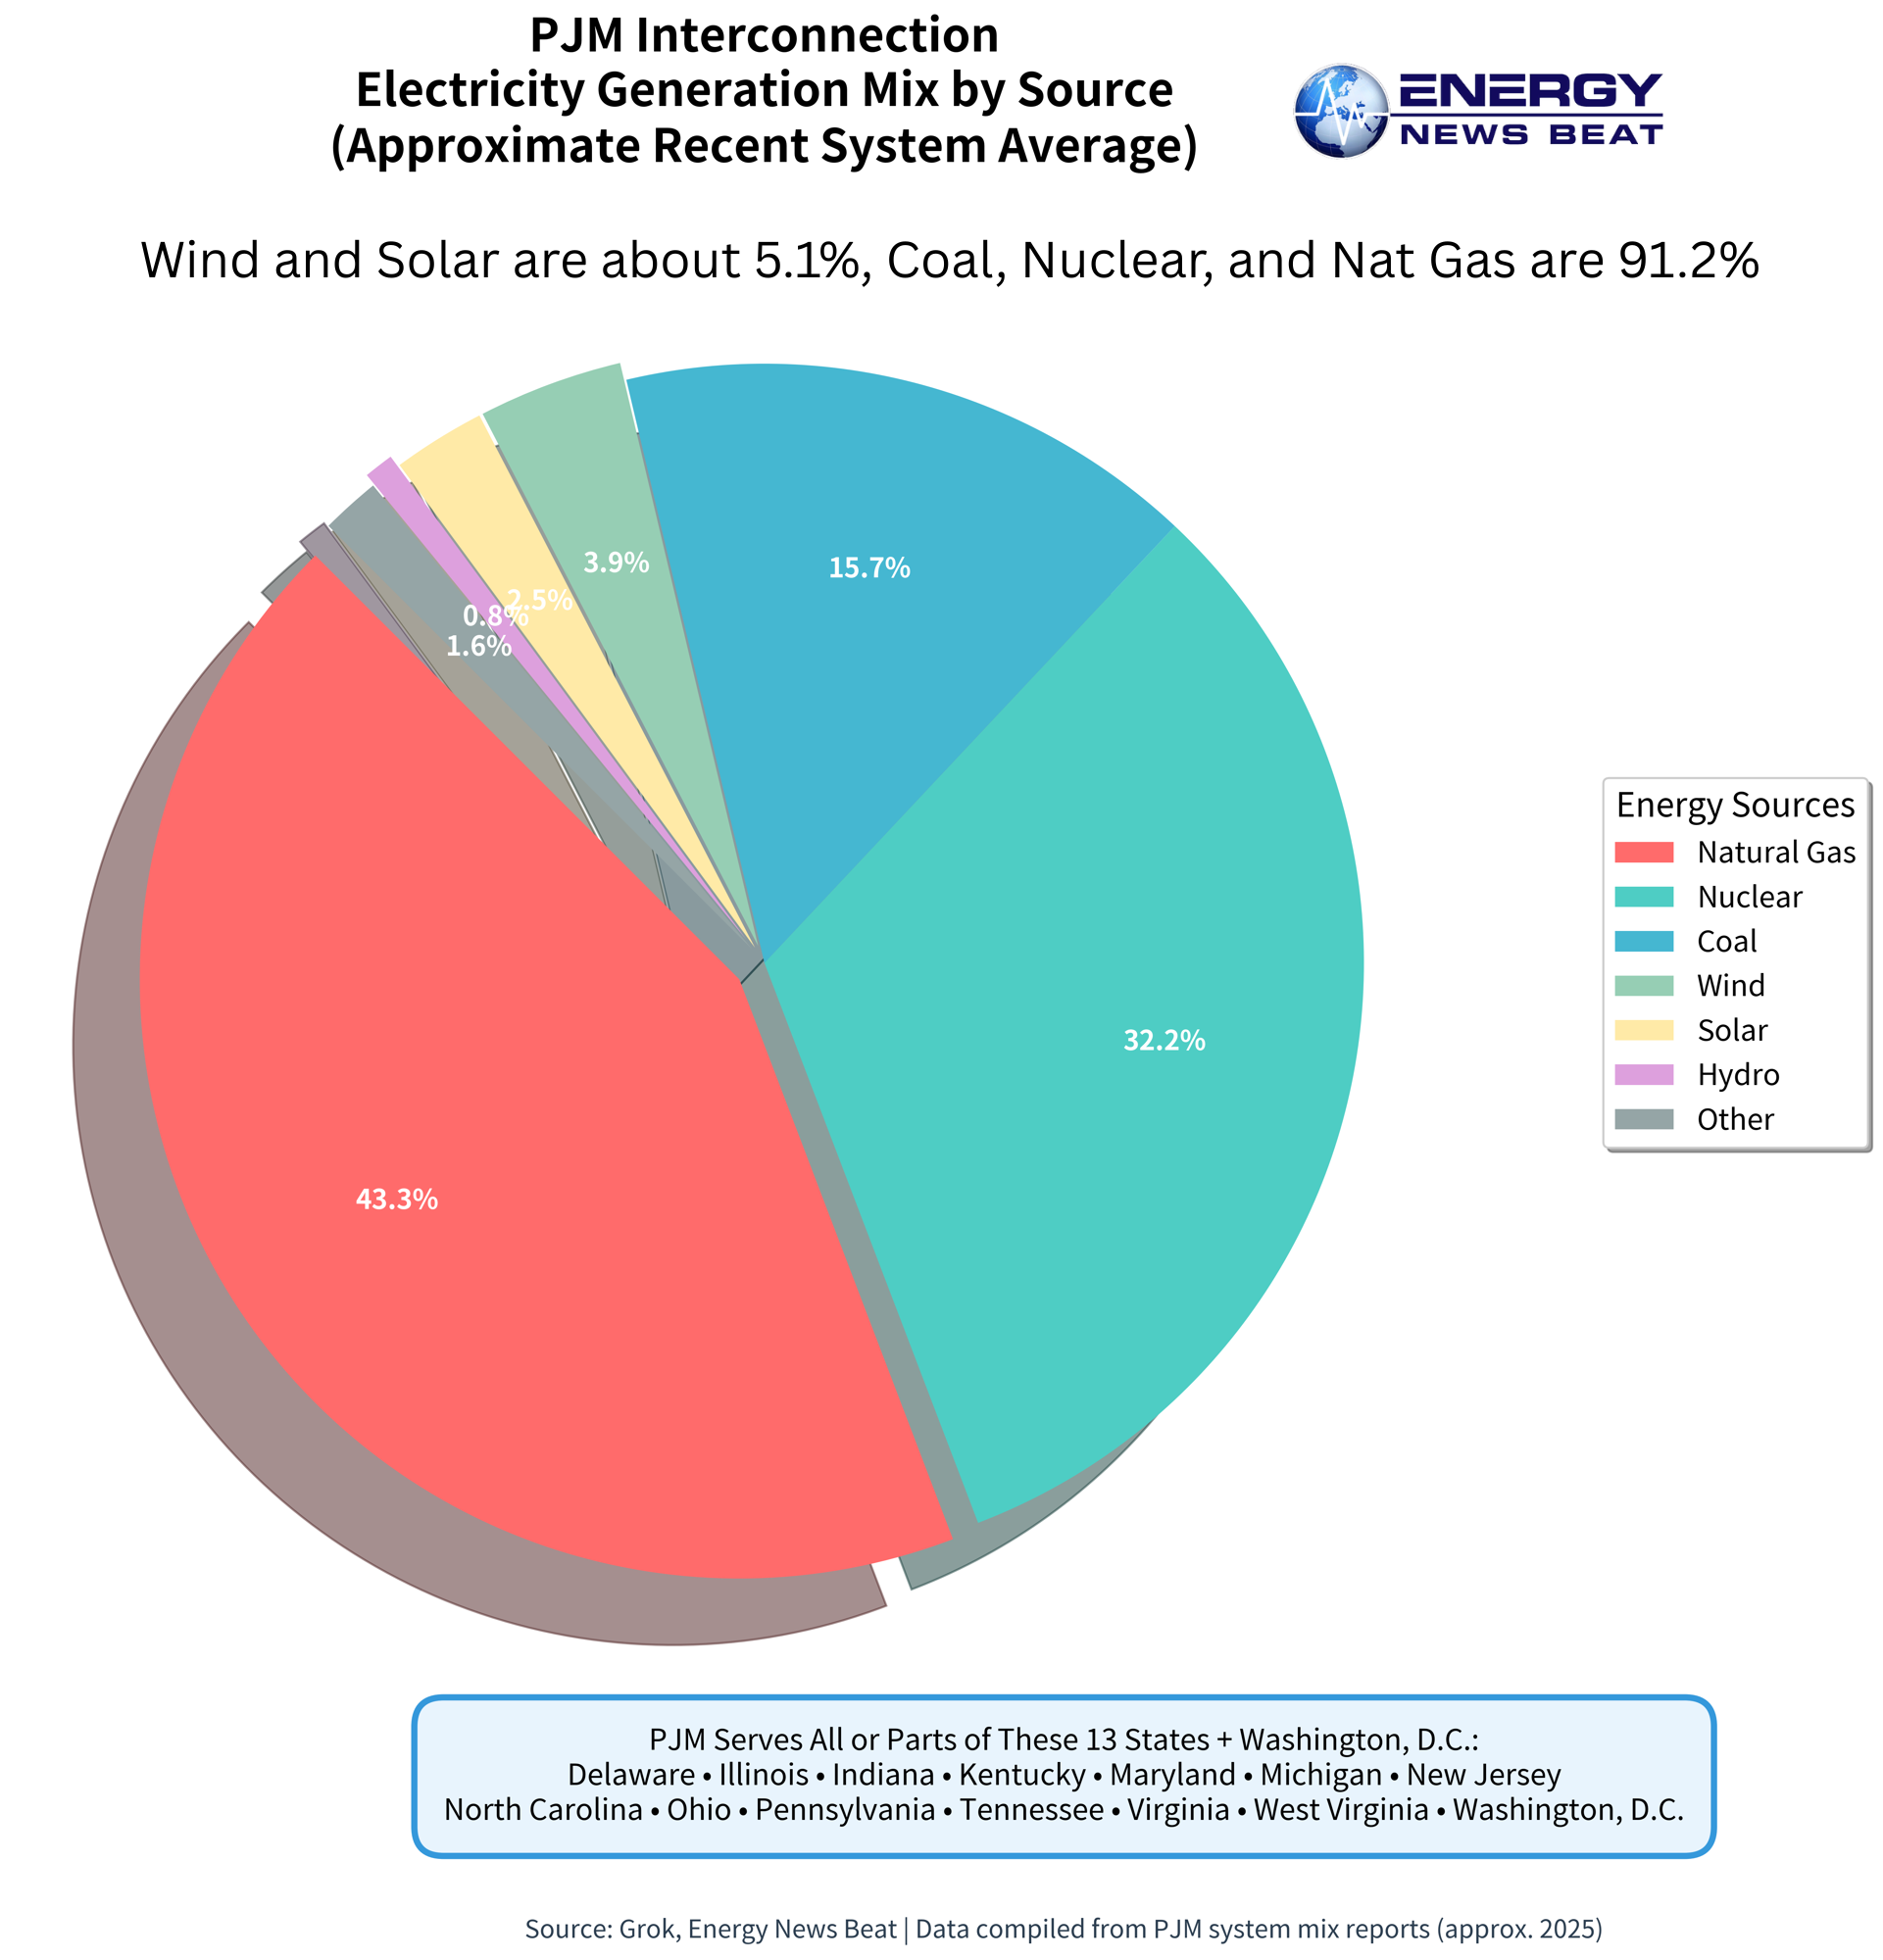
Energy Mix Across PJM States
PJM’s overall generation mix is dominated by natural gas (roughly 40–45% in recent periods), with significant nuclear (around 30–32%) and declining but still notable coal contributions. Renewables (wind, solar, hydro) make up a growing but still smaller share (around 7–12% combined in system mixes). The exact mix varies significantly by state due to local resources, policy, and infrastructure. Below are descriptions based on the latest available EIA data for March 2026 generation within each state (percentages reflect in-state production; actual consumption often includes imports/exports via the PJM market).
Delaware: Heavily reliant on natural gas (88.35%), with growing solar (16.06%). Minimal or no significant coal, nuclear, hydro, or wind generation reported in the period.
Illinois: Diverse and low-carbon leaning — nuclear (50.34%) leads, followed by wind (19.77%), natural gas (11.87%), coal (12.76%), and solar (6.43%). Strong nuclear and wind presence.Indiana: Balanced fossil with renewables — coal (38.78%), natural gas (34.53%), wind (14.89%), solar (8.39%), with minor hydro (0.36%).
Kentucky: Coal-dominant (67.31%), with natural gas (19.97%), hydro (7.44%), and emerging solar (4.72%).
Maryland: Mix of nuclear (35.77%), natural gas (32.59%), solar (11.78%), hydro (11.22%), coal (9.21%), and some wind (2.93%).
Michigan: Natural gas (40.58%) and nuclear (26.02%) lead, with coal (12.89%), wind (12.36%), solar (4.00%), and minor hydro (1.84%).
New Jersey: Primarily nuclear (50.31%) and natural gas (43.44%), with solar (12.14%) and negligible wind.
North Carolina: Natural gas (43.66%) and nuclear (29.26%) dominate, with solar (12.95%), coal (8.27%), hydro (4.26%), and minor wind (0.97%).
Ohio: Natural gas-heavy (59.53%), with coal (22.21%), nuclear (7.66%), solar (6.56%), wind (2.74%), and trace hydro (0.32%).
Pennsylvania: Natural gas (58.63%) and nuclear (32.53%) are primary, with small shares of coal (4.10%), wind (1.91%), solar (1.64%), and hydro (1.24%).
Tennessee: Nuclear (47.61%) leads, followed by coal (20.20%), natural gas (19.60%), hydro (10.62%), and solar (1.99%).
Virginia: Natural gas (50.73%) and nuclear (33.84%) dominate, with solar (11.96%), minor hydro (1.46%), coal (0.73%), and negligible wind.
West Virginia: Overwhelmingly coal (84.45%), with natural gas (5.84%), wind (5.22%), hydro (3.36%), and minor solar (0.93%).
Washington, D.C.: Generates very little power locally (imports ~98% from neighboring states via PJM).
Local generation is small-scale and increasingly renewable — primarily solar and biomass, with some natural gas capacity.
The primary energy source for local capacity is natural gas, but solar/biomass dominate actual in-District output in recent data.
These mixes reflect a transition: coal remains important in Appalachian states (WV, KY, IN), while nuclear and gas provide baseload and flexibility elsewhere. Solar is growing rapidly across the footprint, and wind is notable in the Midwest portions (IL, IN, MI).
Impact on Consumers
Consumers across the PJM region face short-term risks of higher electricity bills, as wholesale price spikes can flow through to retail rates, especially for customers on variable or market-based plans. Large commercial and industrial users enrolled in demand-response programs are first to curtail usage (often compensated), helping protect residential customers from broader blackouts or voltage reductions. However, prolonged high demand and constraints could lead to elevated summer bills amid heavy AC use. Data-center-heavy northern Virginia is a focal point of strain, indirectly affecting local economies and potentially commercial rates. Long-term, these events underscore reliability challenges as electrification, data centers, and extreme weather increase pressure on the grid.
Impact on Investors
Investors in utilities, independent power producers, transmission companies, and energy infrastructure stand to benefit from high wholesale prices and the urgent need for grid upgrades. Demand-response providers, battery storage developers, and flexible generation (gas peakers or hybrids) see immediate value. Transmission owners may accelerate investments to relieve congestion, particularly around data-center corridors in Virginia. Renewable and nuclear operators benefit from the diversity highlighted in state mixes, while policy responses could boost capacity markets or incentives for new resources.
Risks include regulatory scrutiny over emergency measures, potential reforms to capacity markets or environmental rules, and volatility in energy prices. Data-center operators and tech investors in high-growth areas like northern Virginia may encounter higher costs or reliability concerns, influencing site selection and expansion plans. Overall, the situation highlights investment opportunities in grid modernization, storage, and dispatchable clean resources to support growing demand.OutlookPJM successfully navigated the immediate July 2026 heat-driven stress without major outages through a combination of demand response, maximum generation, and federal emergency authorities. However, experts note that tightening reserve margins are ahead due to rising demand from data centers, electrification, and economic growth. Long-term solutions will require accelerated transmission buildout, new generation (gas for flexibility alongside renewables and nuclear), and demand-side innovations.
We will be writing articles on the different levels of grid-failure preparation for homes, budgets, and apartments of different sizes. We recommend that everyone have a plan before a grid failure.
These events serve as a stark reminder of the challenges facing the largest U.S. power grid as it balances reliability, affordability, and the clean energy transition.
- Reuters article (via Yahoo): “Largest US power grid PJM escalates emergency actions to avoid blackouts” (July 3, 2026) — https://www.yahoo.com/news/articles/largest-us-power-grid-pjm-190819959.html
- PJM official updates and emergency procedures: https://insidelines.pjm.com/ and https://emergencyprocedures.pjm.com/
- PJM territory and operations: https://www.pjm.com/about-pjm/who-we-are/territory-served and Wikipedia/PJM pages
- EIA electricity data via Choose Energy (March 2026 state generation mixes): https://www.chooseenergy.com/data-center/electricity-sources-by-state/
- EIA State Electricity Profiles: https://www.eia.gov/electricity/state/
- Additional context from Utility Dive, Electric Choice, and PJM State of the Market reports (various 2025–2026)
All information is current as of early July 2026. For the latest real-time grid conditions, visit PJM.com.