In a significant setback for Ireland’s ambitions as a European hub for tech and data centers, Amazon Web Services (AWS) has canceled plans for a €300 million server rack manufacturing plant in Dublin’s Ballycoolin industrial zone. The decision, driven by delays in securing reliable electricity connections from Ireland’s grid operator ESB Networks, underscores the growing tensions between the country’s digital economy boom and its strained energy infrastructure. The facility was expected to support Amazon’s expanding AI operations and create over 500 local jobs, but after months of negotiations, the project was scrapped due to grid connectivity issues.
This move comes amid broader restrictions on new data center connections in the greater Dublin area, imposed by the Commission for Regulation of Utilities until 2028, as data centers now consume more than 20% of Ireland’s total electricity demand.
Ireland’s power grid challenges are exacerbated by surging demand from tech giants like Amazon, Google, and Microsoft, who have flocked to the country for its favorable tax regime and skilled workforce. However, the cancellation raises questions about the sustainability of this growth, especially as AI-driven energy needs intensify. Amazon has shifted its focus to other regions, including a multibillion-dollar investment in Pennsylvania powered by nuclear energy, highlighting how grid limitations in Europe are pushing companies toward more reliable alternatives.
Ireland’s Energy Mix: A Heavy Reliance on Fossils and Renewables
Ireland’s energy landscape in 2024 reflects a nation in transition, but still heavily dependent on fossil fuels. According to the Sustainable Energy Authority of Ireland (SEAI), 82.7% of the country’s primary energy supply came from fossil fuels, with renewables accounting for just 14.1%.
Breaking it down:
Natural Gas: 32.3% of total energy supply, and a dominant 43% of electricity generation.
Oil: 46.2% of total energy, primarily for transport and heating.
Coal: 5.4%, down significantly but still present in the mix.
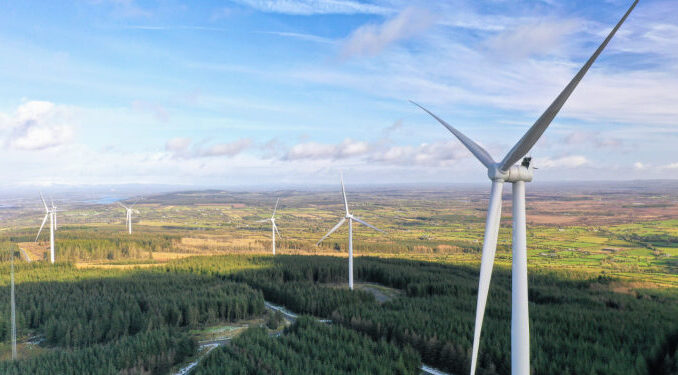
Renewables: Wind led at 32-33% of electricity generation, followed by solar at 3%, hydro at 0.6%, and other sources like biofuels.
Overall, renewables and net imports covered slightly over 50% of electricity needs in 2024, marking the first time fossil fuels fell below 50% in the power mix.
This shift is positive, with wind energy alone saving Ireland over €1.2 billion in gas imports and carbon credits in 2024. But how much did the Wind cost to install?
However, total energy production stood at 3 million tonnes of oil equivalent (toe), with renewables comprising 59% of that domestic output, followed by natural gas at 31%.
Energy Policies and the Push Toward Net Zero
Ireland has committed to ambitious climate goals under its Climate Action Plan 2024 and the European Green Deal. The country aims for net-zero greenhouse gas emissions by 2050, with an interim target of a 51% reduction by 2030 compared to 2018 levels.
Key policies include:Renewable Electricity Targets: 80% of electricity from renewables by 2030, up from around 40-50% in 2024.
Carbon Budgets: Legally binding limits on emissions, requiring net-zero CO2 emissions between 2035 and 2040 to align with Paris Agreement goals.
Energy Efficiency and Decarbonization: Measures in the National Energy and Climate Plan (NECP) focus on reducing fossil fuel dependency, promoting bioenergy, and enhancing grid infrastructure.
Sector-Specific Actions: Phasing out coal by 2025, expanding offshore wind, and incentivizing electric vehicles and heat pumps.
Despite these efforts, projections indicate Ireland may only achieve a 29% emissions reduction by 2030, falling short of targets due to delays in implementation and rising demand from sectors like data centers.
Energy Imports: Dependency on Foreign Sources
Ireland remains highly import-dependent, with 78.4% of its energy needs met through imports in 2023 (latest full-year data available).
The country imports 100% of its oil and coal, and about 77.5-79.5% of its natural gas.
Key sources include:
Natural Gas: Primarily from the UK via interconnectors (e.g., Moffat pipeline), with some from Norway and liquefied natural gas (LNG) terminals in the UK or Europe.
Oil: Sourced globally, with major suppliers including the US, Norway, and the Middle East.
Electricity: Net imports contributed 9.5% to gross electricity supply in 2023, mainly from the UK via subsea interconnectors.
Coal and Other Fuels: Imported from countries like Colombia and Russia (pre-sanctions), but volumes are declining.
This dependency exposes Ireland to global price volatility, as seen during the 2022 energy crisis triggered by the Ukraine war.
The Impact of Net Zero Policies on Electricity Prices
Net Zero policies have had a mixed impact on Ireland’s electricity prices. On one hand, the expansion of renewables like wind has lowered wholesale costs, reducing consumer bills by €840 million between 2000 and 2023 through displaced fossil fuel imports.
Wind farms claim to have saved €748 million on gas imports in 2024. But they have cost over $7.72 billion to install their wind projects.
Based on available data from SEAI reports and other sources, Ireland’s total installed onshore wind capacity (which constitutes nearly all of its wind power, as offshore is minimal at ~25 MW) stands at approximately 5,000 MW as of early 2025. Historical capacity additions are as follows (in MW, with cumulative totals at year-end):
|
Year
|
Annual Addition
|
Cumulative Capacity
|
|---|---|---|
|
Pre-2013
|
–
|
1,923
|
|
2013
|
219
|
1,923
|
|
2014
|
360
|
2,283
|
|
2015
|
168
|
2,451
|
|
2016
|
351
|
2,802
|
|
2017
|
518
|
3,319
|
|
2018
|
355
|
3,674
|
|
2019
|
453
|
4,126
|
|
2020
|
180
|
4,307
|
|
2021
|
32
|
4,339
|
|
2022
|
197
|
4,536
|
|
2023
|
203
|
4,739
|
|
2024
|
~261
|
~5,000
|
|
2025 (to date)
|
~100
|
~5,100
|
To arrive at the total spending on installation, we use historical onshore wind capital costs (CAPEX) per MW in Europe (including Ireland), which have declined over time due to technological advances, supply chain efficiencies, and economies of scale. Data from sources like IEA Wind Task 26, WindEurope, and academic studies show average costs starting at ~€1.7-1.8 million per MW in the early 2000s, dropping to ~€1.4-1.5 million per MW by the 2020s.Using an average of €1.7 million per MW for pre-2013 installations and €1.4 million per MW for 2013 onward (accounting for the trend), the calculation is:
- Pre-2013 (1,923 MW × €1.7 million/MW) = €3.27 billion
- 2013-2023 additions (2,816 MW × €1.4 million/MW) = €3.94 billion
- 2024 addition (~261 MW × €1.4 million/MW) = €0.37 billion
- 2025 addition to date (~100 MW × €1.4 million/MW) = €0.14 billion
Total: Approximately €7.72 billion. This figure represents private sector CAPEX for wind farm construction and installation (turbines, foundations, etc.), excluding ongoing operational costs, grid upgrades, or subsidies. Note that exact costs vary by project, and this is an estimate based on aggregated data; actual spending could be 10-15% higher or lower depending on site-specific factors like terrain or inflation.
However, the transition has also contributed to higher prices due to infrastructure investments, grid upgrades, and the intermittency of renewables, which requires backup from gas-fired plants.
Critics argue that aggressive decarbonization targets, combined with restrictions on new fossil fuel developments, have increased reliance on expensive imported gas during low-wind periods, driving up costs.
Delayed mitigation could risk carbon lock-in and stranded assets, potentially raising long-term prices further.
Overall, while Net Zero aims for affordability through clean energy, short-term challenges like grid constraints have amplified price pressures, especially amid global events. In other words, the additional power plants required and the actual costs of wind energy have not been factored into their narratives.
Average Electricity Prices: A Regional Comparison

Household electricity prices in Europe remain elevated, influenced by energy crises, taxes, and transition costs. Based on 2024 data (second half where available), here’s a comparison in € per kWh (including taxes):
|
Country/Region
|
Average Price (€/kWh)
|
Notes
|
|---|---|---|
|
EU Average
|
0.287
|
Household consumers. |
|
Ireland
|
0.3736
|
Among the highest in EU. |
|
UK
|
0.34
|
19% above EU average. |
|
Germany
|
0.394
|
Highest in EU. |
|
France
|
0.25
|
Lower due to nuclear dominance (approximate from regional trends). |
|
Denmark
|
0.3708
|
High taxes on energy. |
|
Italy
|
0.43
|
Elevated post-crisis. |
Prices vary by consumption band and include VAT/levies. Ireland’s high costs reflect import dependency and grid investments, while nuclear-heavy France benefits from stability.ConclusionAmazon’s decision to scrap its Irish AI facility is a wake-up call for Ireland’s energy sector. While Net Zero policies are driving renewable growth and emissions reductions—down 8.3% in 2023 to 30-year lows—the grid’s shortfall risks derailing tech investments.
Balancing energy security, affordability, and decarbonization will require accelerated infrastructure upgrades and diversified imports. As AI demand surges, Ireland must act swiftly to avoid more such setbacks.
The Bottom Line: Wind farms claim to have saved €748 million on gas imports in 2024. However, they have incurred costs of over $7.72 billion to install their wind projects. Net Zero equals deindustrialization and fiscal failure. When that occurs, regime changes could happen.
Is Oil & Gas Right for Your Portfolio?
Crude Oil, LNG, Jet Fuel price quote
ENB Top News
ENB
Energy Dashboard
ENB Podcast
ENB Substack


