But gasoline plunged and durable goods dropped. Food rose further from already painfully high levels.
By Wolf Richter for WOLF STREET.
Inflation in services accelerated in November for the second month in a row, to an annualized rate of 5.8%, driven by housing, healthcare, and insurance. Services is where about 65% of consumer spending goes, and it continues to be the driver of inflation.
But gasoline continued to plunge. Durable goods prices (cars, electronics, furniture, etc.) continued to drop, though used car prices suddenly jumped again – surprise, surprise. Food prices rose to a new record from already high levels. So here we go.
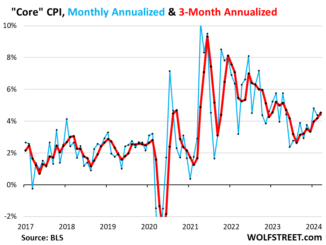
Core CPI, a measure of underlying inflation that excludes the volatile movements of food and energy products, rose by 0.28% in November from October (red line), according to the Consumer Price Index data released today by the Bureau of Labor Statistics.
Core CPI was pushed down by the decline in durable goods, but pushed up by the jump in core services.
The three-month moving average, which irons out the month-to-month ups and downs, also rose by 0.28%, the biggest increase since June (blue):
The Overall CPI inched up by 0.1% in November from October, driven down by the 6.0% month-to-month plunge in gasoline prices and the drop in durable goods. As you can see, this index jumps up and down a lot, driven by the often-massive movements of energy prices (red). The three-month average, rose by 0.18% (blue):
The year-over-year “Core” CPI rose by 4.0% year-over-year, same as in the prior month (red line).
The year-over-year overall CPI decelerated a hair to 3.1% (blue line), pushed down by the 8.9% year-over-year plunge in gasoline prices and by the 1.6% drop in durable goods, while the 5.5% increase in core services pushed in the opposite direction.
Core services got hotter, rents glow in the dark.
The CPI for core services (without energy services) on a month-to-month basis rose 0.47% in November from October, or by 5.8% annualized (blue line).
The three-month moving average rose by 0.46%, or 5.7% annualized, the sharpest increase since April (red line).
The acceleration of the three-month moving average in September, October, and November is very disconcerting:
Year-over-year, the core services CPI rose by a red-hot 5.5%, same as in the prior month, despite the 30% collapse of the messed-up year-over-year health insurance CPI within it that we’ll get to in a moment:
The “Rent of primary residence” CPI further accelerated to +0.48% in October (+5.9% annualized) and has been in this range since March, except for the outlier July, when it had dropped out of that range.
The Rent CPI is based on actual rents that tenants actually paid. The survey follows the same large group of rental houses and apartments over time and tracks what tenants, who come and go, actually pay in these units.
The “Owners’ equivalent of rent” CPI rose by 0.50% in November from October, or 6.2% annualized, a hair higher than in March.
The three-month moving average rose by 0.49%, the highest since June, and there hasn’t been any real improvement since May.
The OER index is based on what a large group of homeowners estimates their home would rent for, and is designed to estimate inflation of “shelter” as a service for homeowners.
What both CPIs for housing costs tell us is that the big month-to-month rent spikes in 2022 through February 2023 are over, and that the rent CPIs have settled at month-to-month increases of around 0.5%, or about 6% annualized, which also roughly matches what the largest landlords have reported in their earnings calls that they’re getting in rent increases. So about since March, it seems rent increases have gotten stuck at a rate close to 6%, and that’s very disconcerting.
Year-over-year, the Rent CPI increased by 6.9% (red in the chart below). And the CPI for OER increased by 6.7% (green):
“Asking rents…” The Zillow Observed Rent Index (ZORI) and other private-sector rent indices track “asking rents,” which are advertised rents of vacant units on the market. Because rentals don’t turn over that much, the ZORI’s spike in 2021 through mid-2022 never fully made it into the CPI indices because not many people actually ended up paying those asking rents.
This time of the year, the ZORI typically dips a little. In October it had dipped by 0.12% from the prior month, and in November it dipped by 0.23% to $1,982. The dips were smaller than a year earlier.
The chart shows the CPI Rent (blue, left scale) as index values, not percent change; and the ZORI in dollars (red, right scale). The left and right axes are set so that they both increase each by 50% from January 2017, with the ZORI up by 47% and the CPI Rent up by 35% since 2017:
Rent inflation vs. home-price inflation: The red line represents the CPI for Rent of Primary Residence (tracking actual rents). The purple line represents the Case-Shiller Home Price 20-Cities Composite Index. Both lines are index values set to 100 for January 2000:
The collapse of the health insurance CPI. November was the second month without the monthly push-down adjustments to the health insurance CPI, which started with the October CPI in 2022 and went through September 2023.
These odious health insurance adjustments had caused the health insurance CPI to collapse by nearly 4% month-to-month every month for 12 months through September, leading to the 37% year-over-year collapse by September. The problem arose because the pandemic healthcare distortions had blown up the model the BLS used to estimate health insurance costs, and the BLS was slow in changing the model. It has now tweaked the model. I discussed the old and new versions last month here: The Collapse of the Health Insurance CPI (How it Became Chickenshit).
Starting in October and continuing in November – and at least for the next four months – the health insurance CPI flipped the other way and jumped month-to-month by 1.1% for the second month in a row. Those two month-to-month increases reduced the year-over-year spike to +30.3% in November from +37.3% in September.
Here is the infamous chart of the Health Insurance CPI as index value, which back to where it had been in 2018, which is outrageously ridiculous. Now the index is reversing, and that little hook at the bottom represents the two months of 1.1% increases in a row:
Services CPI by category.
The table is sorted by weight of each service category in the overall CPI. The CPI for medical care services is the third largest item, with a weight of 6.3% in overall CPI, and over 10% in the core services CPI. The year-over-year drop of 0.9% was caused by 30% year-over-year collapse of the health insurance CPI within it.
Also note the continued spike in motor vehicle insurance.
Major Services without Energy
Weight in CPI
MoM
YoY
Services without Energy
62.7%
0.5%
5.5%
Owner’s equivalent of rent
25.8%
0.5%
6.7%
Rent of primary residence
7.7%
0.5%
6.9%
Medical care services & insurance
6.3%
0.6%
-0.9%
Food services (food away from home)
4.8%
0.4%
5.3%
Education and communication services
4.8%
0.1%
1.4%
Recreation services, admission, movies, concerts, sports events, club memberships
3.1%
0.1%
4.8%
Motor vehicle insurance
2.8%
1.0%
19.2%
Other personal services (dry-cleaning, haircuts, legal services…)
1.5%
0.3%
6.1%
Motor vehicle maintenance & repair
1.1%
0.3%
8.5%
Water, sewer, trash collection services
1.1%
0.3%
5.4%
Video and audio services, cable, streaming
1.0%
-0.2%
4.1%
Hotels, motels, etc.
0.9%
-1.1%
0.3%
Pet services, including veterinary
0.6%
-0.1%
6.4%
Airline fares
0.5%
-0.4%
-12.1%
Tenants’ & Household insurance
0.4%
0.5%
3.4%
Car and truck rental
0.1%
-2.2%
-10.7%
Postage & delivery services
0.1%
-0.6%
0.8%
Durable goods continue to drop, after huge spike.
The CPI for durable goods dropped 0.37% for the month and by 1.6% year-over-year, having now declined somewhat waveringly ever since the peak in July 2022, as the pandemic-era shortages, supply bottlenecks, and transportation chaos that created a historic price spike have receded
The index is dominated by new and used vehicles, information technology products (computers, smartphones, home network equipment, etc.), appliances, furniture, etc.
Major durable goods categories
MoM
YoY
Durable goods overall
-0.4%
-1.6%
New vehicles
-0.1%
1.3%
Used vehicles
1.6%
-3.8%
Information technology (computers, smartphones, etc.)
-2.7%
-8.3%
Sporting goods (bicycles, equipment, etc.)
-0.6%
-1.8%
Household furnishings (furniture, appliances, floor coverings, tools)
-0.7%
-0.3%
This chart shows the price level of the index, not the percent change:
New vehicles CPI has been roughly flat all year, after the 19% surge from April 2021 through March 2023. In November, it edged down by 0.1% month-to-month. Year-over-year, the index rose 1.3%.
For many years before the pandemic, the new vehicle CPI was essentially flat with some ups and downs, despite increases of actual vehicle prices. This is the effect of “hedonic quality adjustments” applied to the CPIs for new and used vehicles and also other products (here’s my chart and detailed explanation of hedonic quality adjustments).
The chart shows the price level as index value, not the percentage change:
Used vehicle CPI had spiked by 55% from February 2020 through January 2022. Since that peak, it has dropped by 11.5%. But it’s still up by 35% since February 2020.
Food & Energy.
The CPI for food at home – food bought at grocery stores and markets – rose by 0.2% month-to-month and by 2.9% year-over-year. Those increases come on top of already painfully high food prices that had spiked by 24% during the pandemic.
Food at home by category
MoM
YoY
Overall Food at home
0.1%
1.7%
Cereals and bakery products
0.5%
3.4%
Beef and veal
-0.3%
8.7%
Pork
-1.0%
-0.5%
Poultry
-0.9%
1.0%
Fish and seafood
0.4%
-1.5%
Eggs
2.2%
-22.3%
Dairy and related products
0.1%
-1.4%
Fresh fruits
1.6%
2.1%
Fresh vegetables
0.3%
-3.1%
Juices and nonalcoholic drinks
0.5%
3.6%
Coffee
0.4%
-0.1%
Fats and oils
0.5%
3.0%
Baby food & formula
-0.4%
7.6%
Alcoholic beverages at home
-0.1%
2.9%
Energy prices plunged, driven by the plunge in gasoline. Energy prices are linked to commodities which tend to jump up and down dramatically, which is why they’re excluded from “core” inflation measures to see the underlying inflation.
CPI for Energy, by Category
MoM
YoY
Overall Energy CPI
-2.3%
-5.4%
Gasoline
-6.0%
-8.9%
Utility natural gas to home
2.8%
-10.4%
Electricity service
1.4%
3.4%
Heating oil, propane, kerosene, firewood
-2.2%
-19.3%
Gasoline, which accounts for about half of the energy CPI, plunged by 6.0% month-to-month. Since the peak in June 2022, it has plunged by 31%.
Enjoy reading WOLF STREET and want to support it? You can donate. I appreciate it immensely. Click on the beer and iced-tea mug to find out how:
Would you like to be notified via email when WOLF STREET publishes a new article? Sign up here.
ENB Top News
ENB
Energy Dashboard
ENB Podcast
ENB Substack