

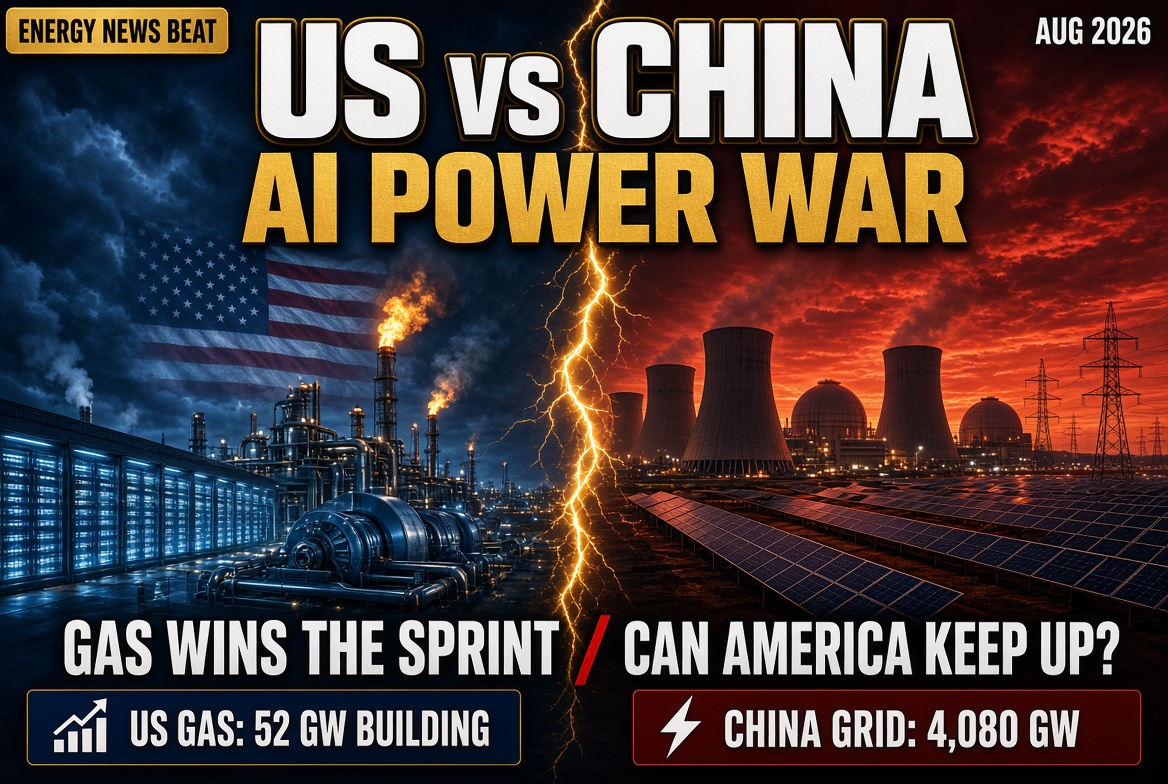
The United States has pulled ahead of China in building natural gas plants to feed AI data centers. That is a real, measurable shift. It is also not the whole race.
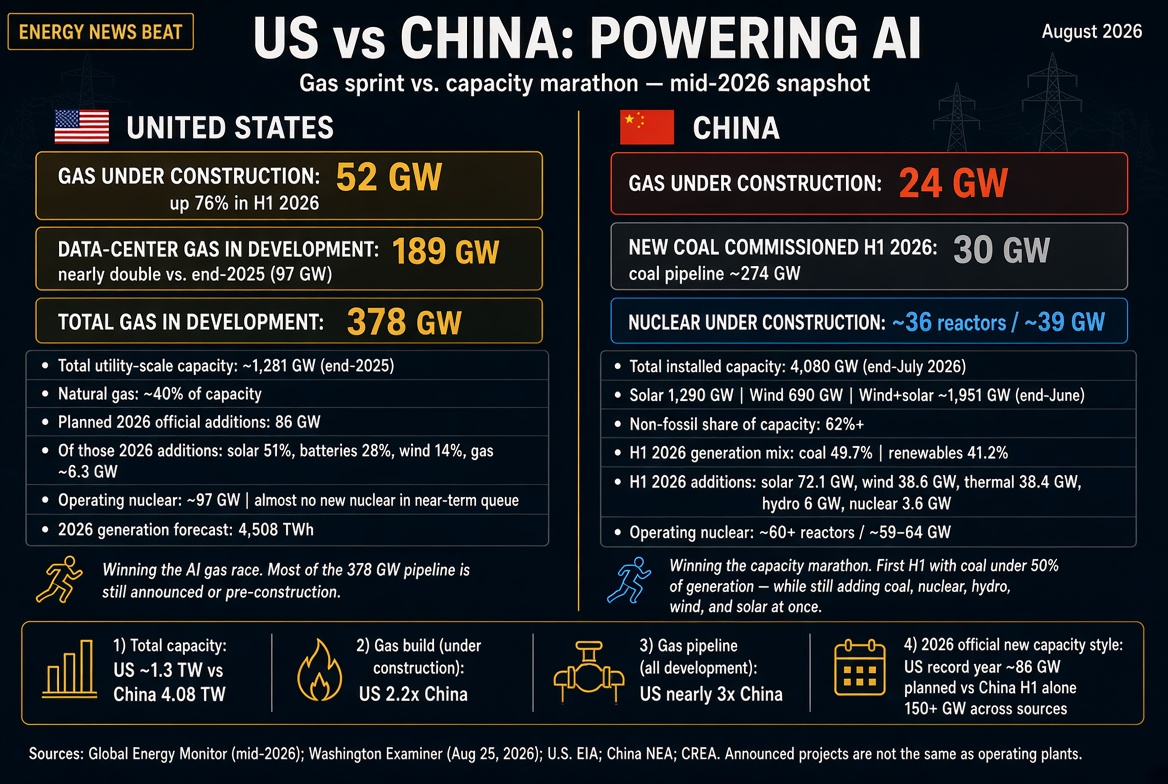
Global Energy Monitor’s mid-2026 update, reported by the Washington Examiner, shows U.S. gas projects under construction at 52 GW after a 76% jump in the first half of the year. About 16.9 GW of that is aimed directly at data centers. China has about 24 GW of gas under construction. On the broader pipeline — announced, pre-construction, and under construction — the U.S. has about 378 GW of gas in development, nearly three times China’s comparable gas pipeline. Data-center-tied U.S. gas proposals nearly doubled in six months, from 97 GW at the end of 2025 to 189 GW by mid-2026. One gigawatt is roughly enough to serve 750,000 homes.
That is the sprint. The question Energy News Beat readers should ask is whether a gas-and-AI buildout can keep up with the volume of coal, nuclear, hydro, wind, and solar China is still putting on the ground.
The U.S. grid, as it actually sits
The U.S. is not starting from zero. At the end of 2025, EIA put U.S. utility-scale generating capacity at about 1,281 GW. Natural gas was the largest slice at roughly 40% of capacity. Renewables were about 31.5% of capacity (including hydro), coal about 13%, and nuclear about 8%.
In generation terms, fossil fuels still produced most utility-scale electricity in 2025, with nuclear around 18% and renewables (including hydro) around 24%. EIA expects total U.S. generation of about 4,508 billion kWh in 2026, up from 4,430 billion kWh in 2025.
What is actually being added this year is not the same as what is being announced.EIA’s inventory of plants scheduled to come online in 2026 pointed to a record 86 GW of new utility-scale capacity if projects hit their dates: solar about 51% of those additions, battery storage about 28%, wind about 14%. Planned 2026 gas additions in that same EIA snapshot were only about 6.3 GW. In 2025, the country added about 53 GW of new capacity, the most since 2002. Through the first half of 2026, solar and wind generation were up 21% and 6% year-over-year, while coal generation fell 11%. Natural gas generation is forecast to rise modestly as data-center load grows.
That is the official near-term queue. GEM is tracking something much larger and much earlier: a 378 GW gas development stack, half of it marketed around data centers. Jenny Martos of GEM put the problem bluntly: it is “nearly impossible nowadays to guess what is a pie-in-the-sky proposal, and what has a real chance of getting built.” About two-thirds of gas capacity in development globally, including more than half of data-center-tied projects, still has no named turbine or engine manufacturer. Developers are shifting toward engines and aero-derivative units to dodge a multi-year combined-cycle turbine backlog. Engine capacity in development more than doubled in six months.
So the U.S. lead over China on gas is real in construction and in announcements. It is not yet real as a flood of new firm megawatts on the grid in 2026. Permits, interconnection, turbines, and steel still have a vote.
China’s mix this year: coal below 50% of generation, and still adding everything
China is operating on a different scale.
By the end of July 2026, China’s National Energy Administration put total installed generating capacity at 4.08 billion kW — 4,080 GW — up 11% year-over-year. Solar stood at 1,290 GW. Wind stood at 690 GW. Combined wind and solar were already about 1,951 GW by the end of June. Non-fossil sources accounted for more than 62% of installed capacity. Solar has tied coal as a top capacity source even while coal remains the workhorse of actual kilowatt-hours.
The generation mix is shifting, but it has not flipped to a gas-and-AI model.In the first half of 2026, coal-fired generation was 2.5 trillion kWh, or 49.7% of output — the first time coal’s share fell below 50% over a six-month period. Renewables generated nearly 2 trillion kWh, about 41.2% of total generation. Wind and solar together produced about 1.25 trillion kWh, or 24.6% of electricity consumption. That is a genuine milestone. It is also not a coal exit.
CREA and GEM’s H1 2026 coal review found China commissioned 30 GW of new coal plants in the first half, up 43% from a year earlier, while retiring only 2.7 GW. Another 25.4 GW started construction. The coal pipeline stands at about 274 GW, equal to roughly 22% of the operating coal fleet. CREA’s mid-year snapshot showed H1 additions of 72.1 GW of solar, 38.6 GW of wind, 38.4 GW of thermal, 6 GW of hydro, and 3.6 GW of nuclear. Thermal additions outran generation growth, utilization fell, and wind-and-solar curtailment jumped. China can add in six months what the U.S. official queue adds in a year.
Nuclear is the other baseload story Washington cannot ignore. As of spring 2026 China had about 60 operating reactors and roughly 59 GW in service. It also had about 36 reactors under construction, on the order of 39 GW, more than any other country and close to half of global nuclear construction. Additional units have been coming online through 2026, pushing operating capacity higher. The U.S. still has the world’s largest operating nuclear fleet, near 97 GW, but almost nothing new is entering the EIA near-term addition list.
China’s gas fleet is the laggard in this comparison, which is why the GEM scoreboard flipped. China uses gas more as a peaking and coastal-province tool than as the default AI fuel. Reporting from Brookings and others has pointed to Chinese data centers being sited against surplus hydro and solar in the interior, with policy pushing high clean-energy shares for new facilities. The U.S. is doing the opposite: buying speed and 24/7 firm power from domestic gas because the grid queue is slow and turbines, even late, still beat a new nuclear plant.
Can the U.S. keep up?
On raw gigawatts added, no. China already has more than three times U.S. installed capacity. It is still commissioning coal by the tens of gigawatts, nuclear by the reactor-dozen, and wind and solar by amounts that make a U.S. “record year” look like a rounding error.
On the specific problem of powering AI this decade, the U.S. has advantages China does not: the world’s largest gas production system, existing pipeline connectivity into ERCOT, PJM, and the Southeast, and developers willing to put captive plants behind the meter to skip interconnection hell. That is why the U.S. is now the world’s largest builder of gas plants and why Texas alone has a gas development stack that rivals entire countries.
The risk is that announcements get mistaken for electrons. A 189 GW data-center gas wish list does not keep servers on if turbines are sold out into 2029, if engines lock in higher heat rates, if local opposition and interconnection studies slip projects, or if ratepayers eat the cost of plants built for one customer class. GEM’s own warning is that the projects that clear those hurdles are “paying top dollar for turbines, locking in emissions, and pushing up electricity prices.”
The other risk is treating China’s coal-and-nuclear machine as yesterday’s news because coal’s share dipped under 50%. Share is not volume. China can cut coal’s percentage and still burn more coal in absolute terms if demand from industry, EVs, and data centers keeps rising — which it is. Curtailment data shows China is also wasting a large amount of wind and solar that never makes it to load. That is a grid-flexibility problem, not proof the coal build has stopped.
If the U.S. wants the gas lead to mean something beyond a headline, three things have to move at the same time: get announced gas plants into the ground on a two-to-four-year clock instead of a five-to-seven-year clock; restart real nuclear additions instead of press-release SMRs; and keep adding the solar, wind, and storage EIA already sees in the 2026 queue so gas is not asked to do every hour of every day. China is rolling out all of the above at once. The U.S. is winning the gas heat of the AI race. It has not yet shown it can win the full-power meet.
Appendix: Sources and links
Lead story and U.S.–China gas comparison
- Callie Patteson, “US pulls ahead of China in building natural gas to power AI data centers,” Washington Examiner, August 25, 2026. https://www.washingtonexaminer.com/policy/energy-and-environment/4699493/us-china-build-natural-gas-power-ai-data-centers/
- Washington Examiner, “Daily on Energy: U.S. building twice as much natural gas for AI as China,” August 25, 2026. https://www.washingtonexaminer.com/daily-on-energy/4700135/daily-on-energy-us-building-twice-natural-gas-ai-china/
- Global Energy Monitor, Global Oil and Gas Plant Tracker / mid-2026 update. https://globalenergymonitor.org/projects/global-oil-gas-plant-tracker
- Global Energy Monitor, “Betting big on data centers, U.S. now leads world for new gas power development.” https://globalenergymonitor.org/research/betting-big-data-centers-us-now-leads-world-new-gas-power-development
- WIRED, “Data Centers Are Driving an Alarming Gas Power Expansion in the US,” August 25, 2026. https://www.wired.com/story/us-data-centers-drive-gas-power-expansion/
- Oliver Milman / Yahoo News, “US building twice as much gas-fired capacity as China in AI boom,” August 25, 2026. https://www.yahoo.com/news/us/articles/us-building-twice-much-gas-100034982.html
- Heatmap News, “The U.S. Is Building Natural Gas Power Twice as Fast as China,” August 25, 2026. https://heatmap.news/energy/10-biggest-gas-plants
U.S. grid, generation, and capacity additions
- U.S. EIA, “New U.S. electric generating capacity expected to reach a record high in 2026,” February 20, 2026. https://www.eia.gov/todayinenergy/detail.php?id=67205
- U.S. EIA, “Electricity generation, capacity, and sales in the United States.” https://www.eia.gov/energyexplained/electricity/electricity-in-the-us-generation-capacity-and-sales.php
- U.S. EIA, Short-Term Energy Outlook, Electricity, Coal and Renewables (August 2026 cycle). https://www.eia.gov/outlooks/steo/report/elec_coal_renew.php
- U.S. EIA, Electric Power Monthly (data for June 2026, released August 26, 2026). https://www.eia.gov/electricity/monthly/
- U.S. EIA, “Solar power generation drives electricity generation growth over the next two years.” https://www.eia.gov/todayinenergy/detail.php?id=67005
- American Public Power Association, “America’s Electricity Generating Capacity.” https://www.publicpower.org/resource/americas-electricity-generating-capacity
- Electrek / SUN DAY Campaign summaries of EIA Form-860M capacity trends, 2026. https://electrek.co/2026/08/28/renewables-installed-capacity-to-beat-natural-gas-within-a-year-eia-data/
China capacity, generation mix, coal, nuclear
- National Energy Administration figures via China News Service / China Daily: installed capacity 4.08 billion kW as of end-July 2026; solar 1.29 billion kW; wind 690 million kW. http://global.chinadaily.com.cn/a/202608/26/WS6a8e3e21e4b06d4aa055a770.html and https://m.chinanews.com/wap/detail/chs/zw/10683760.shtml
- Global Times / NEA briefing, July 30, 2026: H1 coal share 49.7%; renewables 41.2% of generation. https://www.globaltimes.cn/page/202607/1367207.shtml
- State Council Information Office / Xinhua, “China’s coal-fired power output share falls below 50% for first time in H1.” http://english.scio.gov.cn/pressroom/2026-07/30/content_118625919.html
- CREA, “China Energy and Emissions Trends – July 2026 snapshot.” https://energyandcleanair.org/china-energy-and-emissions-trends-july-2026-snapshot/
- CREA and Global Energy Monitor, “China wasted enough wind and solar to cover all new power demand in H1 2026,” August 28, 2026. https://globalenergymonitor.org/article/china-wasted-enough-wind-and-solar-cover-all-new-power-demand-h1-2026
- Oxford Institute for Energy Studies, “China’s Messy Power Sector Mid-Game,” April 2026. https://www.oxfordenergy.org/wpcms/wp-content/uploads/2026/04/Comment-Chinas-Messy-Power-Sector-Mid-Game.pdf
- U.S. EIA, “China’s nuclear power capacity nearly doubled since 2016,” June 5, 2026. https://www.eia.gov/todayinenergy/detail.php?id=67746
- World Nuclear Association, “Plans For New Reactors Worldwide” (updated August 28, 2026). https://www.world-nuclear.org/information-library/current-and-future-generation/plans-for-new-reactors-worldwide.aspx
- Ember, China electricity data. https://ember-energy.org/countries-and-regions/china/
AI power strategies, U.S. vs China
- Brookings, “How will the United States and China power the AI race?” January 8, 2026. https://www.brookings.edu/articles/how-will-the-united-states-and-china-power-the-ai-race/
- Bloomberg, “US and China Diverge on Strategies to Power Their AI Data Centers,” July 28, 2025. https://www.bloomberg.com/news/newsletters/2025-07-28/us-and-china-diverge-on-strategies-to-power-their-ai-data-centers
- Carbon Brief, “AI boom means US is now ‘investing more’ in fossil-fuel power than China,” May 29, 2026. https://www.carbonbrief.org/ai-boom-means-us-is-now-investing-more-in-fossil-fuel-power-than-china
- OilPrice.com, “Washington Pivots to Gas, Coal and Nuclear for AI Baseload Power,” January 19, 2026. https://oilprice.com/Energy/Energy-General/Washington-Pivots-to-Gas-Coal-and-Nuclear-for-AI-Baseload-Power.html
- IEA, Electricity Mid-Year Update 2025, supply chapter. https://www.iea.org/reports/electricity-mid-year-update-2025/supply-renewables-grow-the-most-followed-by-gas-and-nuclear
Note: Capacity and generation figures mix nameplate capacity (GW installed) and energy output (TWh generated). Those are not interchangeable. Announced and pre-construction projects in GEM trackers routinely fail, shrink, or slip; EIA planned-addition tables are closer to near-term reality but still miss late-cycle data-center captive plants.