U.S. Treasury Secretary Scott Bessent has highlighted a core contradiction in Europe’s energy policy amid ongoing debates over Russian diesel supplies. In comments tied to a Trump administration arrangement for Russian diesel releases (initially 300,000 tonnes, with more to follow) to ease prices amid broader supply pressures, Bessent stated that Europe has transferred more money to Russia since the full-scale invasion of Ukraine than it has provided in support to Ukraine. He described European criticism of U.S. efforts to lower diesel costs as “completely cynical,” pointing to a failed energy policy that has left the continent funding the conflict while struggling with high prices and industrial strain.Iz
The numbers back this up. According to the Centre for Research on Energy and Clean Air (CREA) Russia Fossil Tracker, EU countries have paid Russia approximately €238.4 billion for fossil fuels since 24 February 2022. The breakdown is roughly €122.9 billion for gas (pipeline and LNG), €111.5 billion for oil (crude and products), and €3.9 billion for coal.Source Energyandcleanair.github
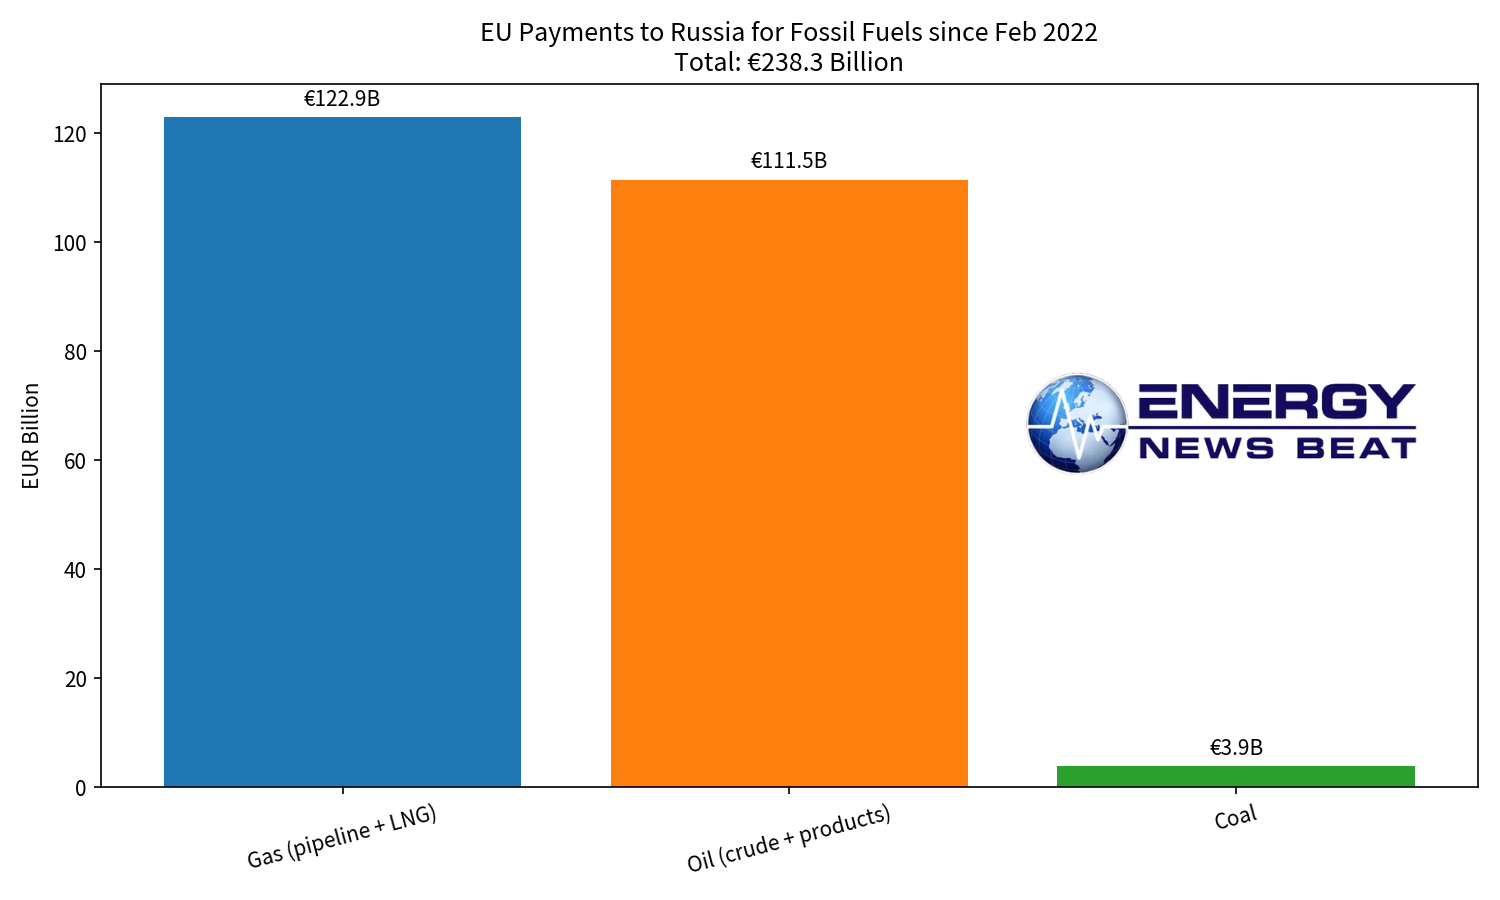
This cumulative figure exceeds many earlier snapshots (such as Reuters/CREA estimates of over €213 billion as of late 2025) as flows have continued.Reuters In 2024 alone, EU purchases of Russian fossil fuels totaled about €21.9 billion—more than the EU’s reported financial aid to Ukraine that year. Monthly spending has often hovered near or above €1 billion in recent periods, with gas (largely unsanctioned) dominating. Source The Guardian
Products and Country Breakdowns
Oil: Seaborne crude and refined products face EU embargoes (from late 2022/early 2023), but pipeline crude continues to Hungary and Slovakia via the Druzhba pipeline under exemptions. These two countries have been among the largest ongoing buyers; CREA has noted Hungary and Slovakia exploiting derogations for billions in pipeline oil since the invasion. Indirect flows also persist via refined products from Russian crude processed in places like India (a “refining loophole” Bessent has called out as Europe financing the war against itself).Source Politico
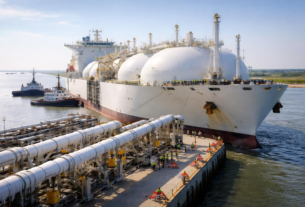
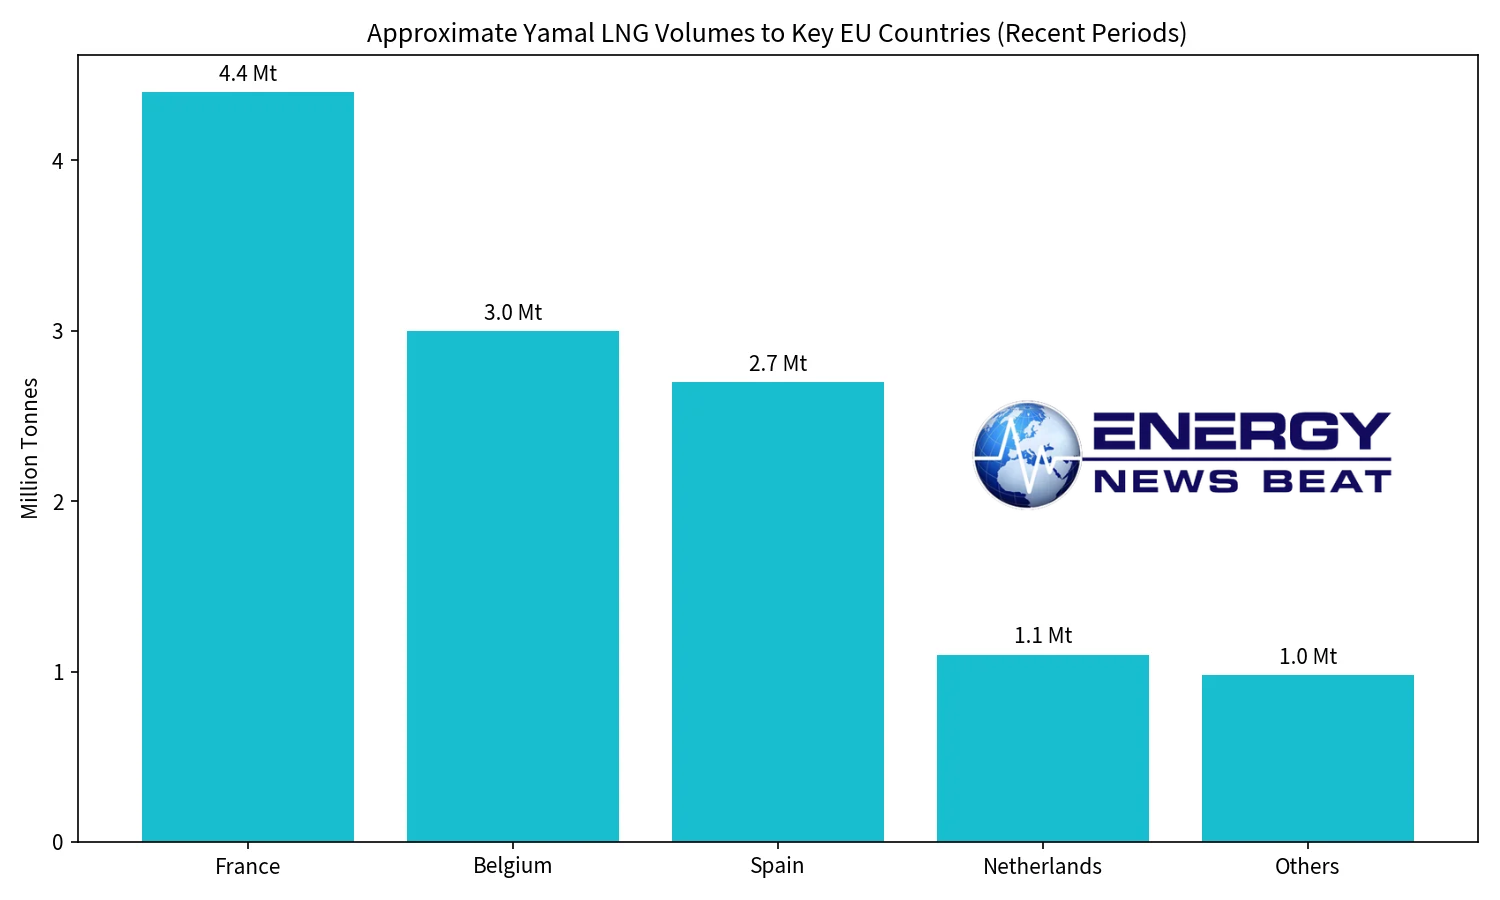
Gas: Pipeline volumes have fallen sharply (Nord Stream outages, Ukraine transit ends), but residual flows continue via TurkStream and other routes to Central Europe. LNG has surged as a substitute. Russia remains a major LNG supplier. Urgewald analysis of Kpler data shows the EU imported a record 12.18 million tonnes of Russian Arctic (Yamal) LNG in the first nine months of 2026 (up 9.5% year-on-year), paying an estimated €7.88 billion. Europe absorbed about 85% of Yamal’s deliveries. Top destinations include France (often the largest, with nearly three-quarters of some monthly volumes), Belgium (Zeebrugge terminal), Spain, and the Netherlands. France has seen periods of 30%+ of its LNG from Russia; Spain and Belgium have also posted large year-on-year increases in certain quarters. Source Urgewald
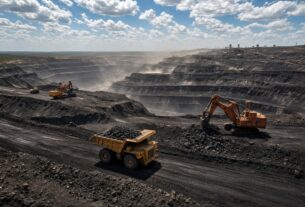
Coal: Largely phased out under bans, contributing only a small residual share.
An illustrative aggregation of reported country-level activity (drawing from CREA snapshots, news analysis, and ongoing flows) shows Hungary and Slovakia prominent for pipeline oil/gas, while Western European LNG terminals in France, Belgium, Spain, and the Netherlands drive much of the gas bill. Exact cumulative country totals vary by source and methodology (ship tracking, customs, pipeline data), but the pattern of concentrated buyers is consistent.Energyandcleanair
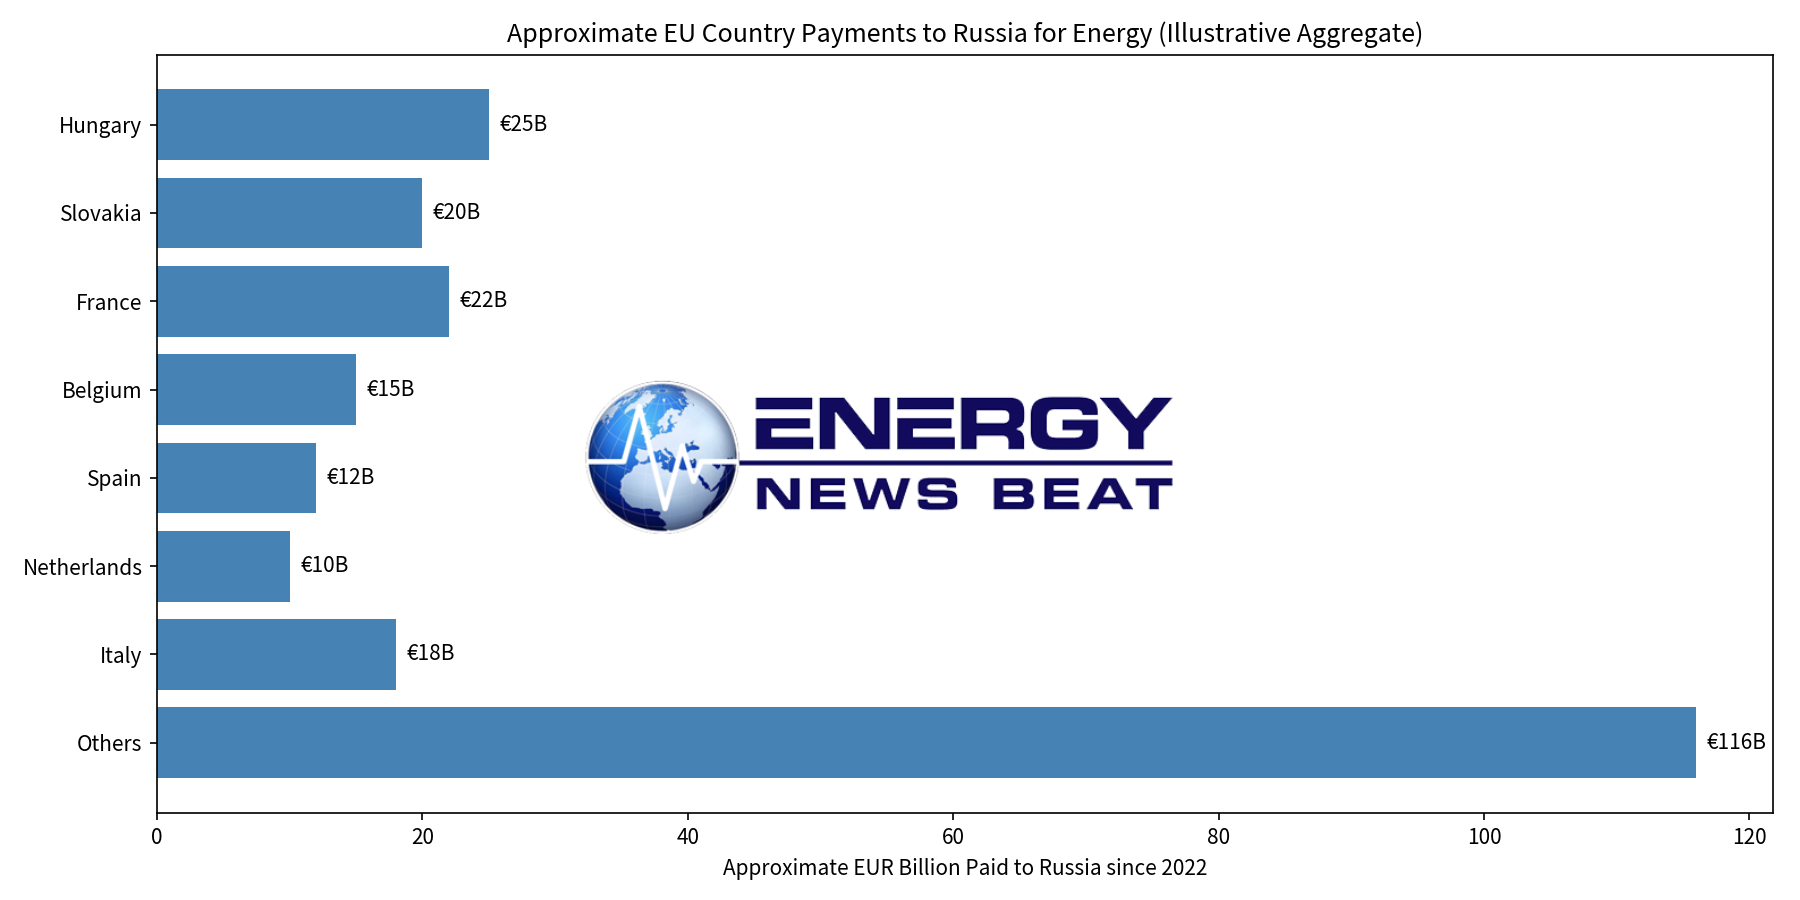
Note: Country chart is an approximate aggregate based on available CREA and reporting figures for illustrative purposes; precise real-time breakdowns are available via CREA’s tracker.
The Economic Toll at Home
Europe’s energy strategy has compounded the cost of these purchases. Post-2022 price spikes (exacerbated by reduced Russian pipeline gas) hit energy-intensive industries hard—chemicals, steel, autos, and manufacturing. Reports document elevated production costs, output reductions, and relocation pressures, contributing to competitiveness losses relative to the U.S. and Asia. Germany’s nuclear phase-out (last reactors closed in 2023) removed substantial zero-carbon baseload; analyses estimate it raised electricity prices (one study ~23% higher in a 2024 counterfactual without the full shutdown) and increased reliance on coal/gas, with lasting effects on industrial power costs that remain multiples of U.S. or Chinese levels.Foronuclear
Refining capacity has also eroded: Europe has lost roughly 20% since 2009 (around 30 refineries closed), becoming a larger net importer of diesel and other products. Recent closures and capacity cuts have heightened vulnerability to supply disruptions, exactly the kind of price pressure the U.S. diesel arrangement aims to address. Coal phase-outs and renewable expansion have not fully offset the loss of reliable, cheaper baseload, leaving the continent more exposed to expensive LNG and geopolitical volatility.Euronews
Bessent’s point lands because the rhetoric of comprehensive sanctions and support for Ukraine coexists with hundreds of billions still flowing to Moscow—primarily through long-term LNG contracts, pipeline exemptions, and trading chains. Phase-out timelines (gas by 2027–2028 under current plans, with short-term contract restrictions already in effect) have not yet halted the revenue. Meanwhile, European officials have criticized external deals aimed at stabilizing global product markets.
The data from CREA, Urgewald/Kpler, Eurostat, and contemporaneous reporting show a clear pattern: substantial, ongoing commercial payments to Russia alongside domestic energy and industrial strain. That is the measurable price of the policy gap.
Check out the World’s Greatest Podcast Show Notes at EnergyNewsBeat.co or EnergyNewsBeat.com. And subscribe to: The Energy News Beat Substack.
Appendices
At Energy News Beat we Make Appendices Great Again.
- CREA Russia Fossil Tracker: https://www.russiafossiltracker.com/ and widget https://energyandcleanair.github.io/russia_counter_widget/
- Reuters analysis of CREA data: https://www.reuters.com/business/energy/how-ukraines-european-allies-fuel-russias-war-economy-2025-10-10/
- Urgewald Yamal LNG analysis: https://www.urgewald.org/en/media/eu-imports-record-1218-million-tonnes-russian-arctic-lng-first-nine-months-2026
- Bessent comments (Izvestia/Fox reporting): https://iz.ru/en/2182466/2026-10-11/bessent-called-europes-statements-about-diesel-supplies-cynical
- Politico on Bessent refining loophole comments: https://www.politico.eu/article/scott-bessent-criticizes-eu-stupidity-over-russia-linked-oil-imports/
- X post referencing Bessent: https://x.com/MarcNixon24/status/2109359878188003567
- Euronews on refining capacity: https://www.euronews.com/2026/10/06/von-der-leyen-turns-to-europes-refineries-as-shrinking-capacity-raises-energy-security-con
- Additional CREA/Guardian reporting on 2024 figures: https://www.theguardian.com/world/2025/feb/24/eu-spends-more-russian-oil-gas-than-financial-aid-ukraine-report
Data evolve with new monthly shipments and price movements; CREA’s live tracker provides the most current aggregate.