


The U.S. Energy Information Administration (EIA) released its latest Weekly Petroleum Status Report on June 3, 2026, covering data for the week ending May 29, 2026. The report reveals a significant tightening in U.S. petroleum inventories, with a massive combined draw in commercial crude oil and Strategic Petroleum Reserve (SPR) stocks.
Analyst Ole S. Hansen of Saxo Bank highlighted the key takeaways in a widely circulated post on X, noting that combined U.S. commercial crude and SPR inventories have now fallen by around 90 million barrels from their recent peak—including a 16-million-barrel decline in the past week alone.
Key Highlights from the EIA Report
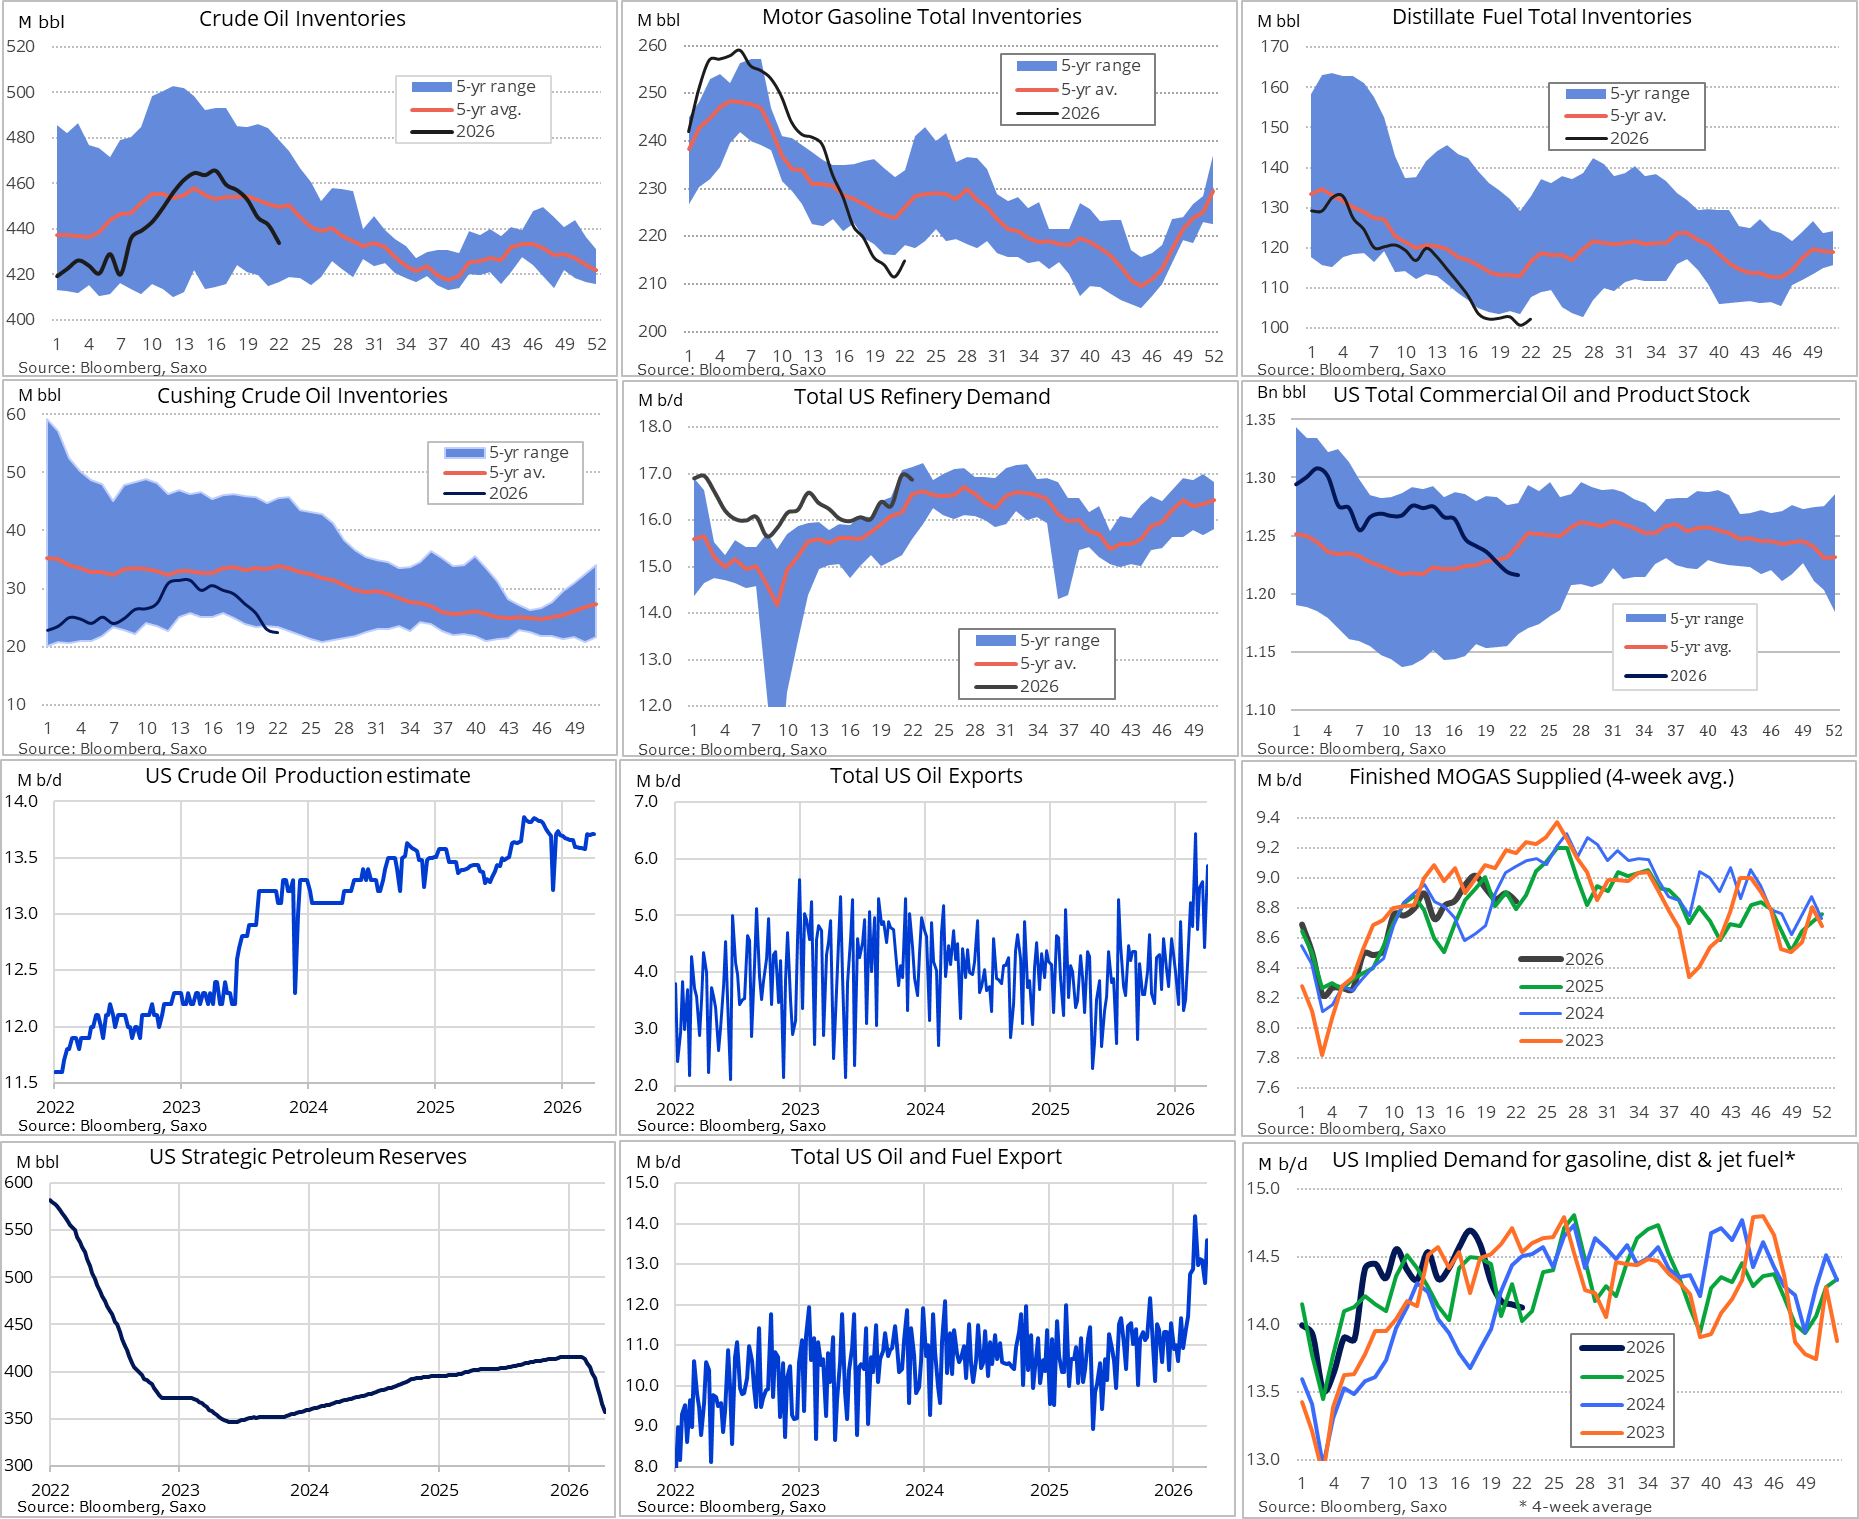
Crude Oil Inventories: U.S. commercial crude oil stocks (excluding SPR) fell by 8.0 million barrels to 433.7 million barrels—approximately 3% below the five-year average for this time of year.
SPR Draw: The Strategic Petroleum Reserve dropped by nearly 8.0 million barrels to 357.1 million barrels.
Combined Crude Draw: Total crude oil stocks (commercial + SPR) declined by approximately 17 million barrels, aligning closely with the analyst’s assessment of a major weekly draw.
Total Commercial Petroleum Inventories (excluding SPR): Fell by 2.6 million barrels to the lowest level since May 2025.
Product-specific movements showed some relief on the refined side:
Motor Gasoline: Inventories rose by 3.4 million barrels to 215.0 million barrels (still 5% below the five-year average).
Distillate Fuel Oil (Diesel): Stocks increased by 1.5 million barrels to 102.3 million barrels (3% below five-year average), narrowly avoiding a drop below the psychologically important 100-million-barrel threshold for the first time since 2003.
Kerosene-Type Jet Fuel: Inventories edged up by 0.4 million barrels to 45.4 million barrels.
Additional context from the report and analyst commentary:
Cushing, Oklahoma (the key delivery hub for WTI futures) saw inventories decline for the sixth straight week to 22.4 million barrels—edging closer to the widely cited operational minimum of around 20 million barrels.
U.S. crude production remained steady at 13.7 million barrels per day (down 120,000 bpd year-to-date).
Crude exports surged to nearly 6 million barrels per day, well above the pre-conflict 12-month average of 3.9 million bpd.
Refinery inputs averaged 16.9 million bpd (down 90,000 bpd week-over-week), with utilization at 94.7% of operable capacity.
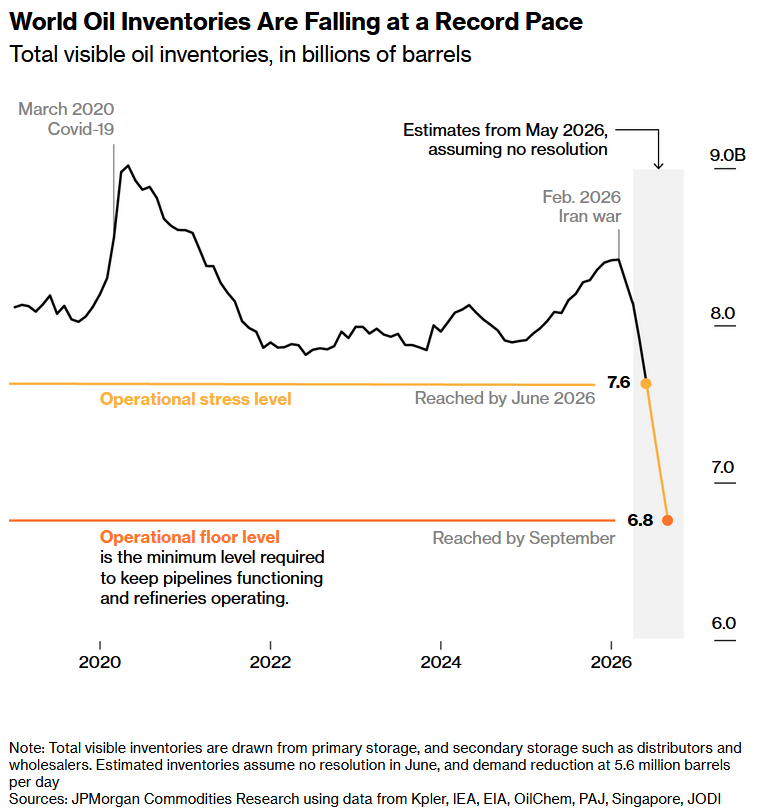
Other reports indicate that global inventories are approaching operational floor level soon.
Implications for Consumers
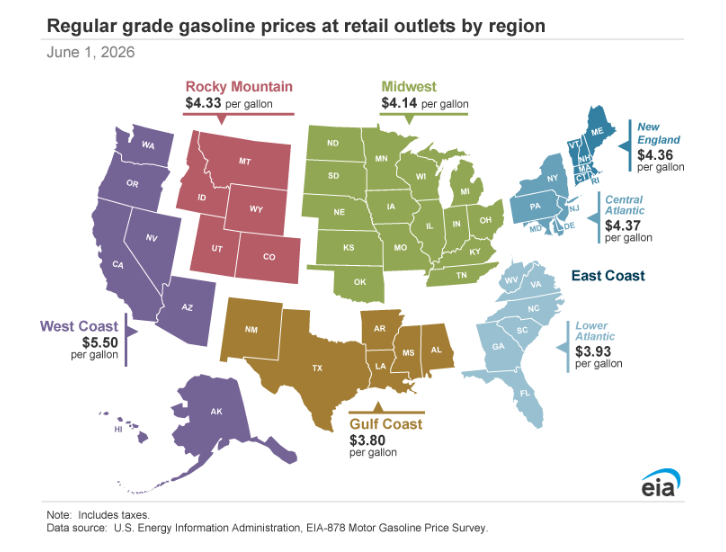
The sharp draw in crude inventories, combined with historically low SPR levels and tight Cushing stocks, points to a tightening physical market. While gasoline and distillate builds provided some buffer this week, the overall inventory decline—coupled with strong export demand—suggests upward pressure on crude prices could translate into higher pump prices in the coming weeks. American drivers and businesses reliant on diesel and jet fuel may face elevated costs this summer, especially if geopolitical factors (referenced in the analyst’s note regarding the “conflict”) continue to support robust U.S. exports.
Implications for Investors
For energy investors, this report is decidedly bullish. Persistently low inventories, a near-term floor forming at Cushing, and steady (but not surging) domestic production signal a supply-constrained environment that favors higher oil prices. Energy producers, particularly those with exposure to WTI and export-oriented infrastructure, stand to benefit. Refiners may see mixed results—strong utilization but potentially squeezed crack spreads if product inventories continue to build modestly. The SPR drawdown further underscores a strategic release environment that could limit future government buffers, adding a layer of geopolitical and policy risk premium to oil markets.Overall, the EIA’s latest data reinforces a narrative of structural tightness in U.S. petroleum balances, with the massive combined draw serving as a clear market signal.
Appendix: Sources and Links
- EIA Weekly Petroleum Status Report (Week Ending May 29, 2026): Official release page – https://www.eia.gov/petroleum/supply/weekly/
- EIA Summary Highlights PDF: https://ir.eia.gov/wpsr/wpsrsummary.pdf
- EIA U.S. Stocks of Crude Oil and Petroleum Products (detailed tables): https://www.eia.gov/dnav/pet/pet_stoc_wstk_dcu_nus_w.htm
- EIA SPR Crude Oil Stocks: https://www.eia.gov/dnav/pet/PET_STOC_WSTK_A_EPC0_SAS_MBBL_W.htm
- Ole S. Hansen X Post (June 4, 2026): https://x.com/Ole_S_Hansen/status/2062449893969375459
- EIA Archive for June 3, 2026 Release: https://www.eia.gov/petroleum/supply/weekly/archive/2026/2026_06_03/wpsr_2026_06_03.php
All data and analysis are drawn directly from the official EIA report released June 3, 2026, and the