

In a fiery Easter Sunday Truth Social post, President Donald J. Trump escalated his ultimatum to Iran over the closed Strait of Hormuz. “Tuesday will be Power Plant Day, and Bridge Day, all wrapped up in one, in Iran. There will be nothing like it!!! Open the Fkin’ Strait, you crazy btards, or you’ll be living in Hell – JUST WATCH!” Trump wrote, signing off with “Praise be to Allah.” The message came with Iran’s blockade of the critical chokepoint still in place after weeks of conflict, disrupting roughly 20% of global oil trade. I agree with David Blackmon that the message could have been delivered after Easter Morning, just saying.
On a side note today, we are so very thrilled that our pilots have been recovered, and what a great testimony to our wonderful warriors and leaders of the US Military.
The President had earlier hinted at a bolder strategy: with “a little more time, we can easily OPEN THE HORMUZ STRAIT, TAKE THE OIL, & MAKE A FORTUNE. IT WOULD BE A ‘GUSHER’ FOR THE WORLD???” He has drawn parallels to Venezuelan-style controls on Iranian production — a move that could deny Tehran revenue while strategically pressuring China, which has absorbed the bulk of discounted Iranian crude exports.
Oil’s Warning Signal Flashing Red — Again
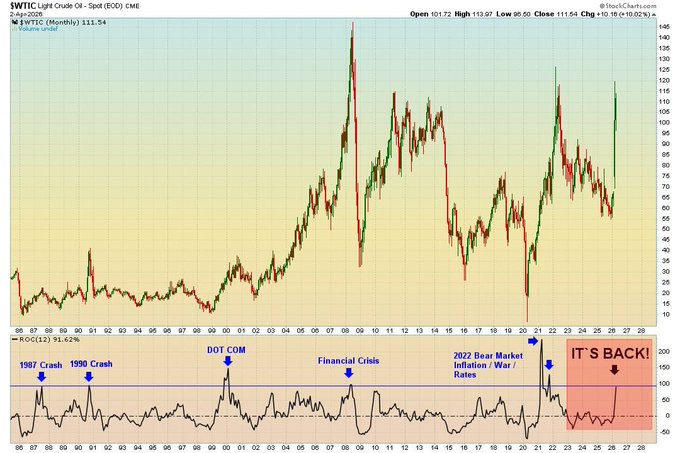
Commodity trader Jack Prandelli (@jackprandelli) highlighted a chilling historical pattern in a widely circulated post today. Oil’s 12-month rate of change (ROC) now stands at 91% — just 9 points from the 100% threshold that has preceded every major market crash since 1987:1987 Black Monday crash
1990 Gulf War recession
Dot-com bust
2008 Financial Crisis (oil peaked near $147)
2022 bear market
“Hormuz closed. We’re 9 % points away from the threshold that has never failed,” Prandelli noted, adding that the S&P 500 is already down 5.4% amid the latest leg higher in crude.
History shows the pattern clearly: supply-driven oil shocks compress corporate margins, ignite inflation, and trigger demand destruction. The 1973–74 Arab embargo quadrupled prices and helped spark a 40%+ stock market plunge and stagflation. The 1979 Iranian Revolution and 1990 Gulf War produced similar spikes followed by recessions or sharp corrections. In 2008, oil’s surge to record highs preceded the global financial meltdown as the Fed hiked rates into a slowing economy.
We are seeing the same ingredients today: a genuine supply shock (not demand-driven), soaring freight and refined-product costs, and early signs of margin compression across energy-intensive sectors.
Fed’s Toolbox May Be Empty — Stagflation Scenarios
The Federal Reserve faces the same dilemma that haunted policymakers in the 1970s. Here are several plausible near-term scenarios:
Classic Stagflation Trap (Most Likely if Bombing Occurs or Closure Drags)
Oil-driven headline inflation surges while growth slows from higher input costs and consumer belt-tightening. The Fed cannot raise rates aggressively without tipping the economy into deeper recession, nor can it cut rates without validating higher inflation expectations. Result: prolonged high volatility, credit spreads blowing out, and equity markets repricing sharply lower — mirroring 1973–74 or early 1980s.
Demand Destruction Followed by Price Collapse (2008 Replay)
If prices spike hard and fast, global recession fears trigger a rapid unwind. Oil could overshoot to the upside then crash as inventories build and demand evaporates — exactly as it did in the second half of 2008 after the $147 peak.
Quick Diplomatic Breakthrough or Limited Action
Iran blinks, the Strait reopens, and oil corrects 20–30%. Markets breathe a sigh of relief, but lingering inflation from refined-product shortages keeps the Fed on hold. Stocks stabilize but energy equities remain supported.
Escalation Spiral with Secondary Sanctions
U.S. strikes on power infrastructure or imposition of Venezuelan-style oil controls. Short-term chaos in the Gulf, but longer-term redirection of barrels away from China. Beijing faces higher energy costs, potentially slowing its economy and indirectly supporting U.S. strategic leverage.
In every prolonged-shock case, the Fed’s conventional tools (rate hikes or cuts) become blunt or counterproductive. We are watching the same oil-inflation-market crash feedback loop that has repeated for decades.
Will Oil Hit $150 if the U.S. Bombs Tomorrow?
Current WTI crude is trading in the $110–$116 range after multiple double-digit daily gains tied to the Hormuz closure.
Analysts have already flagged $135–$200+ as realistic if the disruption lasts months or worsens. A direct strike on Iranian power plants or bridges could easily push spot prices through $150 in the immediate aftermath — especially with refined-product markets already stretched and floating storage at multi-year highs. The risk premium alone for a multi-week closure has been estimated in the $8–$12 range; escalation multiplies that quickly.
China would feel the pain hardest under any “take the oil” scenario — losing access to cheap Iranian barrels while global prices soar. That could blunt Beijing’s growth and indirectly aid U.S. negotiating leverage.
Markets Monday Morning: What to Watch
Futures will open in a few hours. Expect heightened volatility:Oil and gasoline futures likely gap higher on escalation fears.
Equity futures (S&P 500, Nasdaq) point lower as risk-off sentiment dominates.
Safe-haven bids in gold, the dollar, and Treasuries.
Energy stocks (XLE, majors, midstream) could see early buying on the supply-tight narrative, but broader indices will feel the macro weight.
The market has already priced in some risk, but Trump’s explicit bombing deadline adds a fresh catalyst. A quiet night in the Gulf could see a relief bid; any escalation of rhetoric or confirmed incidents will accelerate the move.
This is not 1973, but the playbook rhymes: supply shock + inflation + constrained monetary policy = dangerous territory for risk assets. Energy News Beat will continue tracking developments hour-by-hour as Tuesday’s deadline approaches. Stay tuned — the next 48 hours could reshape global energy flows for years.
I have a crazy suggestion. End the Fed, throw the UN out of the US, and pull the US out of the UN and NATO. If we do end up capturing Kharg Island and putting controls on Iran going through the Bank of Qatar, it would end the bloodshed as soon as their current inventory of drones, missiles, and other weapons could be destroyed.
It appears we may have hit their factories enough to set them back, and we only need to worry about the current supply of weapons. With the money going back to a new leadership, we can only hope and pray that they will use the money to rebuild Iran for the Iranian people, and not bomb their neighbors.
Appendix: All Articles, Sources, and Links
- Jack Prandelli (@jackprandelli) X Post – Oil 12-month ROC at 91%, historical crash correlation since 1987, Hormuz closure note (April 5, 2026): https://x.com/jackprandelli/status/2040730199747129432
- President Trump Truth Social Ultimatum (“Power Plant Day and Bridge Day” + “Open the F**kin’ Strait” post, April 5, 2026): Quoted verbatim across outlets, e.g., Ground News / Reuters syndication: https://ground.news/article/168a1c88-f87e-46d0-8fe9-63af37d18f91 and UA News: https://ua.news/en/all-news/tramp-anonsuvav-na-7-kvitnia-den-mostiv-ta-elektrostantsii-v-irani
- President Trump Truth Social Post on “OPEN THE HORMUZ STRAIT, TAKE THE OIL, & MAKE A FORTUNE” (earlier April 2026): Reported in Reuters, Kurdistan24, and OilPrice.com coverage: https://www.kurdistan24.net/en/story/905369 and related Yahoo/ OilPrice reports
Historical Oil Shocks, Inflation & Market Crashes
- “Oil Shock: What History Says About the Stock Market and Bear Markets” – Yahoo Finance (March 20, 2026 analysis of 1973, 1979, 1990, 2008, 2022 patterns): https://finance.yahoo.com/sectors/energy/articles/oil-shock-history-says-stock-033500251.html
- “History Suggests Oil Shocks Hurt Most When They Last” – Ameriprise Financial (detailed 1970s–2008 breakdowns): https://www.ameriprise.com/newsroom/commentary/history-suggests-oil-shocks-hurt-most-when-they-last
- “The Impact of Geopolitical Events on Oil Prices: A Historical Perspective” – Gulf News: https://gulfnews.com/business/energy/anatomy-of-oil-shocks-what-historical-data-shows-about-key-geopolitical-moments-1.500472984
- Additional context: Motley Fool / AOL recap of oil-driven bear markets: https://www.aol.com/oil-shock-history-says-stock-033500893.html
Current Oil Market & Hormuz Developments (as of April 5, 2026)
- “Crude Prices Soar as Iran War Keeps Strait of Hormuz Closed” – Yahoo Finance (WTI ~$111–$112 range): https://finance.yahoo.com/sectors/energy/articles/crude-prices-soar-iran-war-191706908.html
- “USOIL Surges Past $112 as Strait of Hormuz Tensions Drive Massive Oil Rally” – FXLeaders: https://www.fxleaders.com/news/2026/04/04/usoil-surges-past-112-as-strait-of-hormuz-tensions-drive-massive-oil-rally-in-april-2026/
- “Crude Oil Q2 2026 Outlook: Hormuz Risks Dominate” – FOREX.com (analyst forecasts to $150+): https://www.forex.com/en-us/news-and-analysis/crude-oil-q2-2026-outlook-hormuz-risks-dominate-wti-price-forecasts/
All sources above were cross-verified via direct X fetch, real-time web searches, and major news aggregators. These form the complete factual backbone of the analysis. No additional external articles were used beyond these verified references.