U.S. drilling activity eased this week across the three leading trackers, even as the count remains solidly higher than a year ago. Baker Hughes reported 601 active rotary rigs for the week ending November 13, 2026 (down 3 week-over-week and up 52 from 549 a year earlier). WellDatabase’s U.S. Rig Report dated November 16, 2026 showed 603 total rigs (down 9 on the week, up 48 year-over-year). Enverus’ GPS-tracked Daily Rig Count stood at 657 as of November 10 (roughly +1% from the prior week on the public dashboard), consistent with its broader capture of the active fleet.
These sources use different methodologies. Baker Hughes is the traditional weekly rotary census (land, inland waters, and offshore) that markets follow most closely. WellDatabase cross-references Baker Hughes data with permit records to deliver granular operator, state, basin, well-type, wellbore, and depth breakdowns. Enverus tracks a higher share of the fleet in near-real time via GPS, which structurally produces a higher headline number. Together they show a modest weekly pullback on an elevated year-over-year base, with gas-directed activity accounting for most of the softness.
Oil vs. Natural Gas Counts
Oil-directed activity held steady while gas declined:
- Baker Hughes: Oil rigs unchanged at 463 (+46 year-over-year), gas rigs down 4 to 127 (+2 year-over-year), and miscellaneous rigs up 1 to 11.
- WellDatabase: Oil wells flat at 436 (+45 from 391 a year earlier), gas wells down 4 to 123 (down 2 from 125), undisclosed down 6 to 33, thermal unchanged at 10, and unknown up 1 to 1.
The gas decline was concentrated in the Haynesville. Oil remains the dominant driver, accounting for the majority of activity and supporting record U.S. crude production.
State and Basin Comparison
Baker Hughes and WellDatabase align closely on the major states and basins, with the largest weekly moves in gas-weighted and some oil areas:
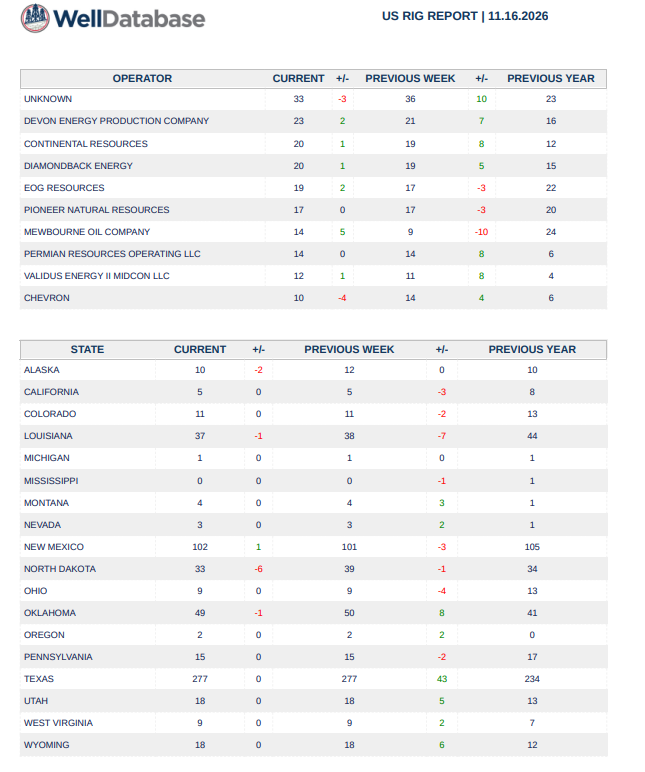
Key states (WellDatabase current / week change / year change; Baker Hughes notes where different):
- Texas: 277 (flat, +43 from 234) — dominant and stable.
- New Mexico: 102 (+1, −3 from 105) — Permian Delaware strength.
- Oklahoma: 49 (−1, +8 from 41).
- North Dakota: 33 (−6, −1 from 34); Baker Hughes Williston around 35 (flat).
- Louisiana: 37 (−1, −7 from 44) — Haynesville-related.
- Other notables: Alaska 10 (−2), Utah 18 (flat, +5), Wyoming 18 (flat, +6), Pennsylvania 15 (flat), Colorado 11 (flat).
Key basins (aligned across sources):
- Permian: 275 (+2 both sources, +22 from 253) — still by far the largest, roughly 45%+ of U.S. activity and the clear growth engine.
- Haynesville: 53 (−3, +12 from 41) — the main source of the national gas decline.
- Eagle Ford: 50 (flat, +9 from 41).
- Williston: WellDatabase 37 (−6, +2 from 35); Baker Hughes ~35 (flat).
- Marcellus: 23 (flat both sources).
- Granite Wash: 23 (flat, +11 from 12).
- Other / residual: WellDatabase 102 (−1); broader “Other” categories remain sizable on Enverus reads.
Horizontal wells dominate (WellDatabase 500, down 2), with vertical down 6 to 51. Depth is concentrated in the 10k–15k ft range (241) and deeper buckets.
Operators
WellDatabase’s top operators this week highlight selective adds by independents against some trims:
- Unknown: 33 (−3)
- Devon Energy: 23 (+2)
- Continental Resources: 20 (+1)
- Diamondback Energy: 20 (+1)
- EOG Resources: 19 (+2)
- Pioneer Natural Resources: 17 (flat)
- Mewbourne Oil: 14 (+5 — notable jump)
- Permian Resources: 14 (flat)
- Validus Energy: 12 (+1)
- Chevron: 10 (−4)
Private and independent operators continue to drive a disproportionate share of recent growth, consistent with prior Enverus analysis.
Impact on Investors and Consumers
For investors, the weekly decline is modest and concentrated in gas (Haynesville) and some classification/timing effects in the Williston. The Permian’s continued +2 and solid year-over-year gains across oil-weighted areas support the outlook for operators with strong Delaware/Midland positions (Devon, Diamondback, Continental, EOG, Mewbourne). Oil rigs holding flat while U.S. crude production hit another record (EIA: 14.013 million b/d for the week ending November 6) underscores ongoing efficiency gains. Completion activity remains supportive, with Primary Vision’s Frac Spread Count at 195 as of November 6 (+4 week, +22 year-over-year). Investors should watch private-operator momentum and any sustained gas-rig softness into winter.
For consumers, short-term supply remains ample. Record oil output and relatively stable oil-directed drilling keep crude and product markets well supplied, even with mixed inventory moves (commercial crude stocks rose 4.7 million barrels to 414.4 million in the latest EIA week). Gas-rig declines could lend mild support to natural gas prices if they persist through heating season, but higher year-over-year activity overall and strong completion efficiency mean fewer rigs continue to deliver robust volumes. No near-term supply shock is indicated by these counts.
We highly recommend the Welldatabase.com subscription as it is an outstanding tool for granular level details.
Appendix: Sources and Links
- WellDatabase U.S. Rig Report | 11.16.2026 (attached): Total 603 (−9 week, +48 year); detailed state, operator, well-type (Oil 436 / Gas 123), wellbore, depth, and basin tables. Methodology: cross-referenced with Baker Hughes and permit data. https://www.welldatabase.com/
- Baker Hughes North America Rig Count (week ending November 13, 2026): U.S. 601 (−3 week, +52 year); oil 463 (flat), gas 127 (−4), misc. 11 (+1). Permian 275 (+2), Haynesville 53 (−3). https://rigcount.bakerhughes.com/ and contemporaneous reports from RBN Energy, Oil & Gas 360, PetroEyes, and OilPrice.com.
- Enverus Daily Rig Count (public dashboard): 657 as of November 10, 2026 (~+1% week). Basin snapshots available on platform (Permian ~247 on daily reads, Gulf Coast/Eagle Ford area, Williston ~35, Anadarko, Appalachia, large “Other”). https://app.drillinginfo.com/drc/ and https://www.enverus.com/dailyrigcount/. Related private-operator commentary: https://www.enverus.com/blog/rig-count-doesnt-tell-you-whats-coming/.
- EIA Weekly Petroleum Status Report (week ending November 6, 2026): Crude production 14.013 million b/d (record); commercial crude inventories +4.7 million barrels to 414.4 million. https://www.eia.gov/petroleum/supply/weekly/
- Primary Vision Frac Spread Count: 195 as of November 6, 2026 (+4 week, +22 year). https://primaryvision.co/ and contemporaneous reports.
- Additional contemporaneous coverage: RBN Energy, OilPrice.com, Oil & Gas 360, Oklahoma Energy Today, and ENGINE.
Energy News Beat makes appendices great again. Data as of November 16, 2026.