
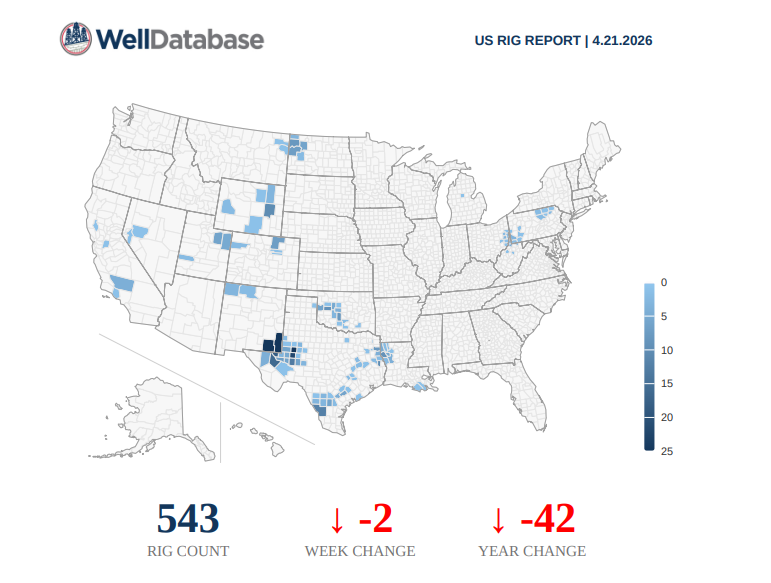
Houston, TX – April 21, 2026 – The latest U.S. rotary rig count data shows a modest pullback in drilling activity. According to Baker Hughes, the total U.S. rig count for the week ending April 17, 2026, stands at 543 rigs, down 2 rigs week-over-week from 545 the prior week.
Oil-directed rigs slipped by 1 to 410, while gas-directed rigs fell by 2 to 125. Miscellaneous rigs edged up by 1 to 8. Year-over-year, the total rig count is down 42 rigs (about 7.2%) from 585 rigs at this time last year.
This marks the second consecutive weekly decline after a brief uptick earlier in April, though the overall count has remained relatively stable in the low- to mid-540s range in recent months. The slowdown is modest but continues a broader year-over-year trend of reduced drilling activity as operators prioritize capital discipline amid market conditions.
Enverus and WellDatabase Cross-Check
Enverus’ daily rig count, which tracks more than 95% of the U.S. rig fleet via GPS units and provides near real-time data, shows a higher figure than the weekly Baker Hughes snapshot. As of April 20, 2026, Enverus reported 570 active rigs, reflecting daily fluctuations but aligning with a similar slight downward trend in recent days (down about 2.1% day-over-day in the latest reading, with a modest +0.5% change over the past month and a larger -11.8% year-over-year decline).
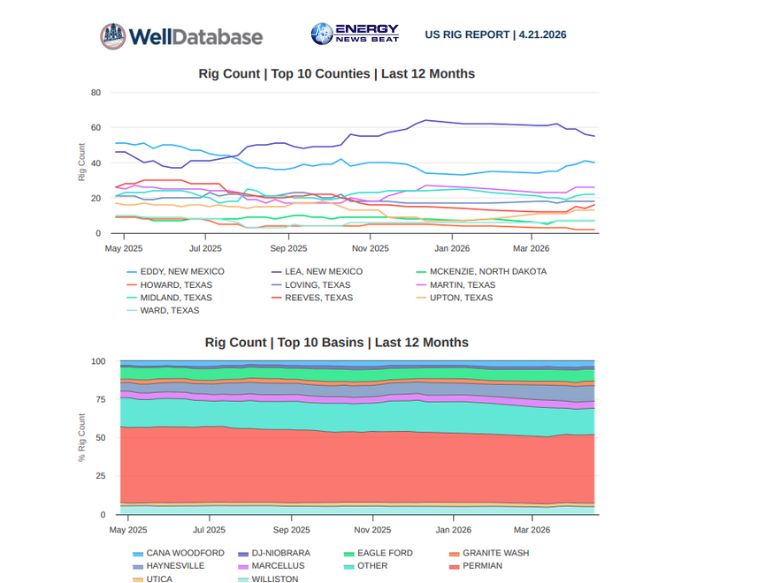
WellDatabase’s weekly Rig Report (including the user-referenced RigReport 4 21.pdf) aligns exactly with Baker Hughes national totals (543 rigs) while offering enhanced granularity such as county-level mapping, basin-specific oil/gas splits, permit cross-referencing, historical charts, and operator details. This provides deeper visibility into regional activity, confirming the national slowdown while highlighting pockets of stability in core areas like the Permian Basin.
Oil and Product Storage Levels (EIA Data)The latest EIA Weekly Petroleum Status Report (for the week ending April 10, 2026) showed the following key inventory changes:
U.S. commercial crude oil inventories (excluding SPR):
Decreased by 0.9 million barrels to 463.8 million barrels — about 1% above the five-year average for this time of year.
Total motor gasoline inventories: Decreased by 6.3 million barrels (both finished gasoline and blending components declined) — still 1% above the five-year average.
Distillate fuel inventories (including diesel and heating oil): Decreased by 3.1 million barrels — about 6% below the five-year average.
Propane/propylene inventories: Increased by 0.3 million barrels — a significant 68% above the five-year average.
Total commercial petroleum inventories fell by 9.0 million barrels overall.
Refinery inputs averaged 16.0 million barrels per day (down 208,000 bpd week-over-week), with utilization at 89.6% of operable capacity.
Natural Gas Storage Levels (EIA Data)Working gas in underground storage stood at 1,970 billion cubic feet (Bcf) as of Friday, April 10, 2026 — a net injection of 59 Bcf for the week. Stocks are 126 Bcf higher than the same week last year and 108 Bcf above the five-year average of 1,862 Bcf.
These healthy storage levels reflect robust production and milder weather patterns, providing a buffer as the shoulder season transitions.
Market Context
The slight rig count decline occurs against a backdrop of cautious operator activity, with oil rigs holding near recent lows and gas rigs continuing to adjust to softer natural gas prices. Storage draws in crude and products, combined with strong natural gas builds, suggest balanced-to-comfortable supply conditions in the near term. Full basin and operator breakdowns are available in the WellDatabase Rig Report and Enverus daily updates.
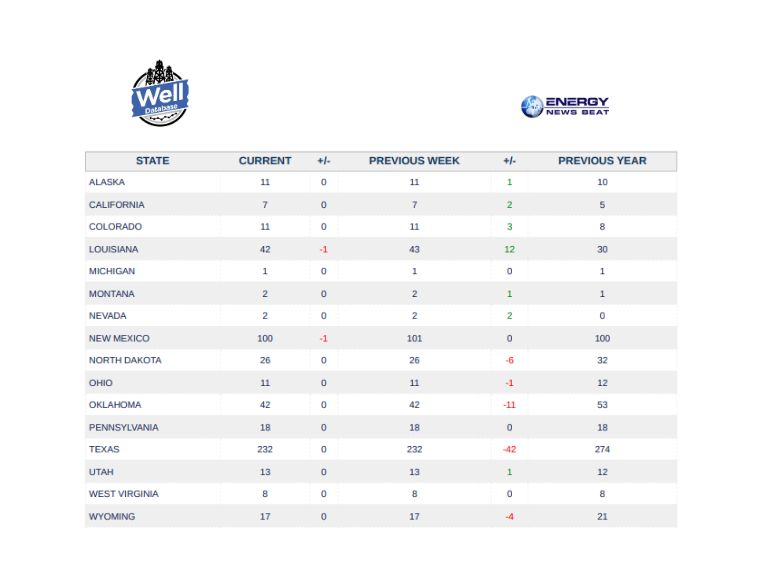
State Rig Counts
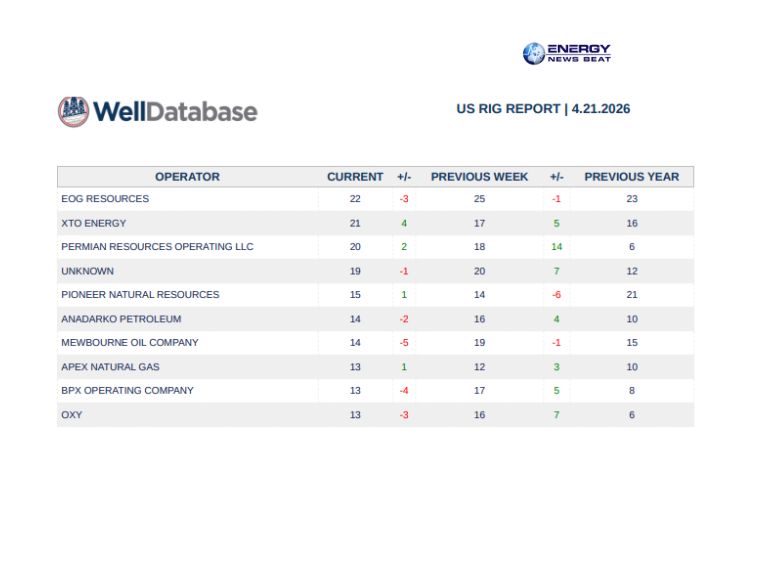
Key Operators – We will cover in the finance section on The Energy News Beat Standup
Counties And Basins
Appendix: Sources and Links
- Baker Hughes Rig Count Overview & Summary: https://rigcount.bakerhughes.com/ (data for week ending April 17, 2026)
- Baker Hughes North America Rig Count Report (PDF): https://rigcount.bakerhughes.com/static-files/f506ff08-37eb-445f-8dc0-34e7ca4d938a
- Enverus U.S. Daily Rig Count: https://www.enverus.com/dailyrigcount/ (data as of April 20, 2026)
- EIA Weekly Petroleum Status Report (week ending April 10, 2026): https://www.eia.gov/petroleum/supply/weekly/ and summary PDF: https://ir.eia.gov/wpsr/wpsrsummary.pdf
- EIA Natural Gas Weekly Storage Report (week ending April 10, 2026): https://www.eia.gov/naturalgas/storage/
- WellDatabase Rig Report (April 21, 2026 edition) https://welldatabase.com/
- Prior Energy News Beat coverage (e.g., April 10, 2026 Rig Count): https://energynewsbeat.co/crude-oil/u-s-weekly-rig-count-april-10-2026-slight-decline-continues-as-oil-rigs-hold-steady-while-gas-activity-dips/
All data are sourced from official industry reports as of April 21, 2026. Rig counts are leading indicators of future production and can shift with commodity prices, capital budgets, and seasonal factors. For the most current updates, visit the linked sources directly.