By Wolf Richter for WOLF STREET.
The new motto: Lower mortgage rates and too-high prices cause demand to wilt as potential buyers wait for still lower mortgage rates, lower prices, and higher wages – something that Fannie Mae also noted. This is the buyer’s strike in effect.
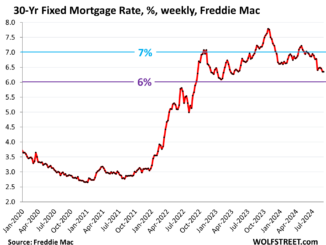
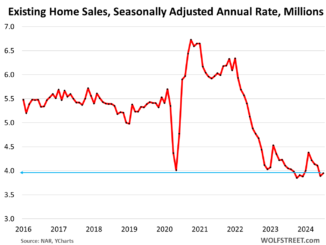
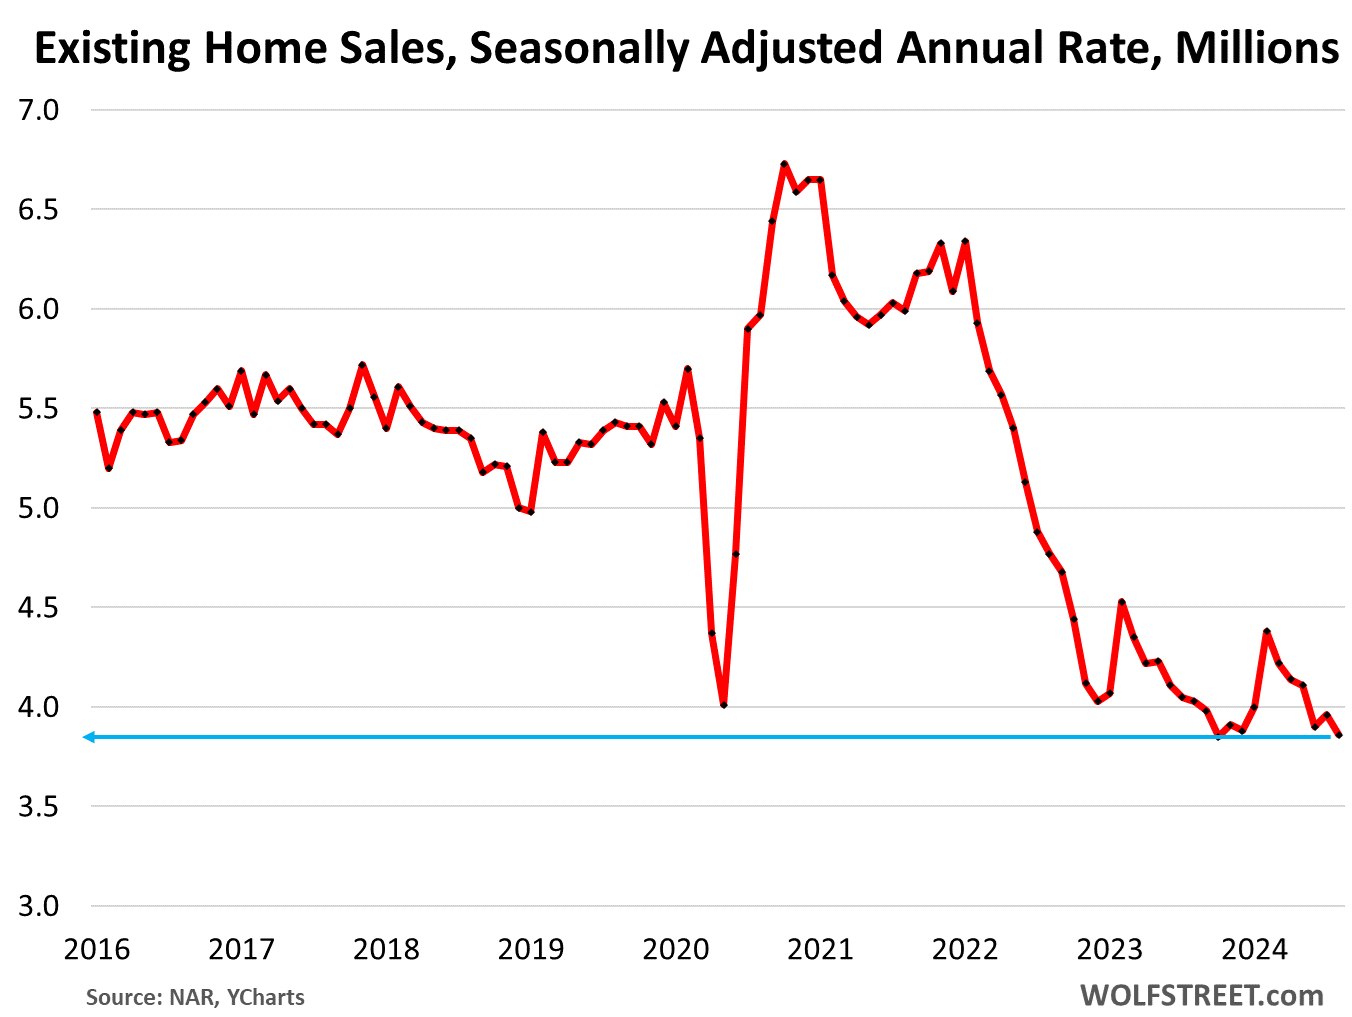
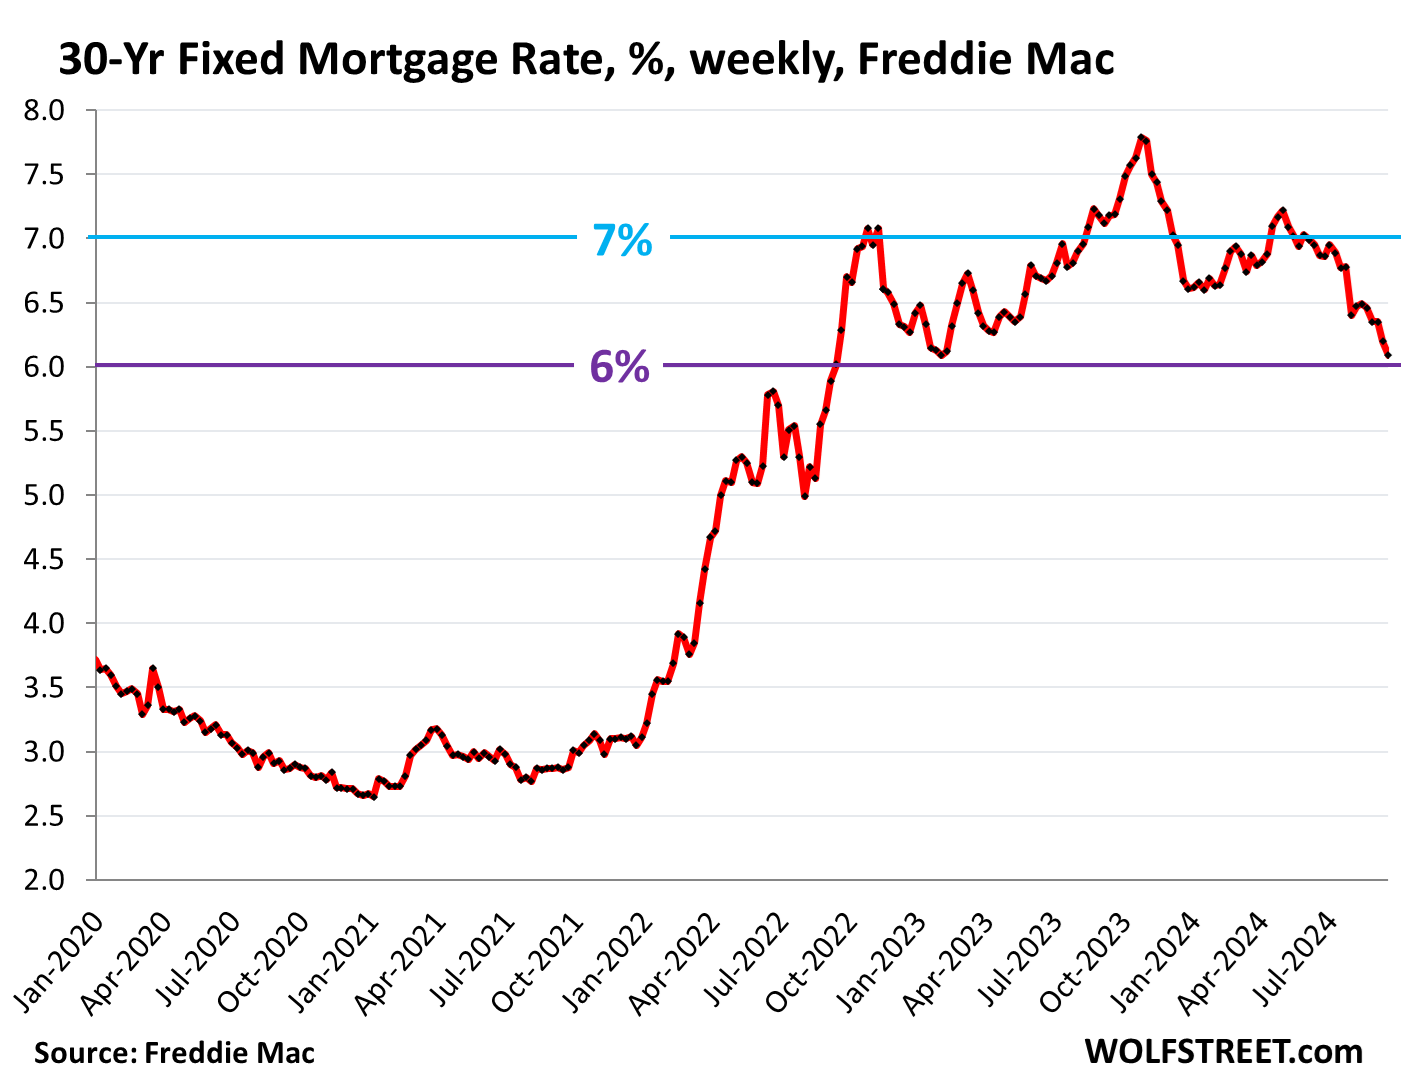
So, despite mortgage rates dropping to 6.09%, from 7.9% 10 months ago, sales of existing single-family houses, condos, and co-ops dropped further to a seasonally adjusted annual rate of 3.86 million in August, according the National Association of Realtors today.
Sales were down by 2.5% from the wilted levels a year ago, down by 36% from August 2021 and down by nearly 30% from the same period in 2018 and 2019 – these are the worst sales since the depth of the Housing Bust – while supply surged to highest for any August since 2017 (historic data via YCharts):
“Home sales were disappointing again in August, but the recent development of lower mortgage rates coupled with increasing inventory is a powerful combination that will provide the environment for sales to move higher in future months,” the NAR said in the report.
Alas, “the recent development of lower mortgage rates” isn’t all that recent. Mortgage rates started plunging in November 2023 from the 7.8% range and have now reached 6.09%, according to Freddie Mac today. Mortgage rates have plunged for 10 months and hit a two-year low.
But people are waiting for still lower mortgage rates, and lower prices, and higher wages – because prices are still way too high, after exploding in recent years, that’s the problem in the housing market – see our Most Splendid Housing Bubbles in America:
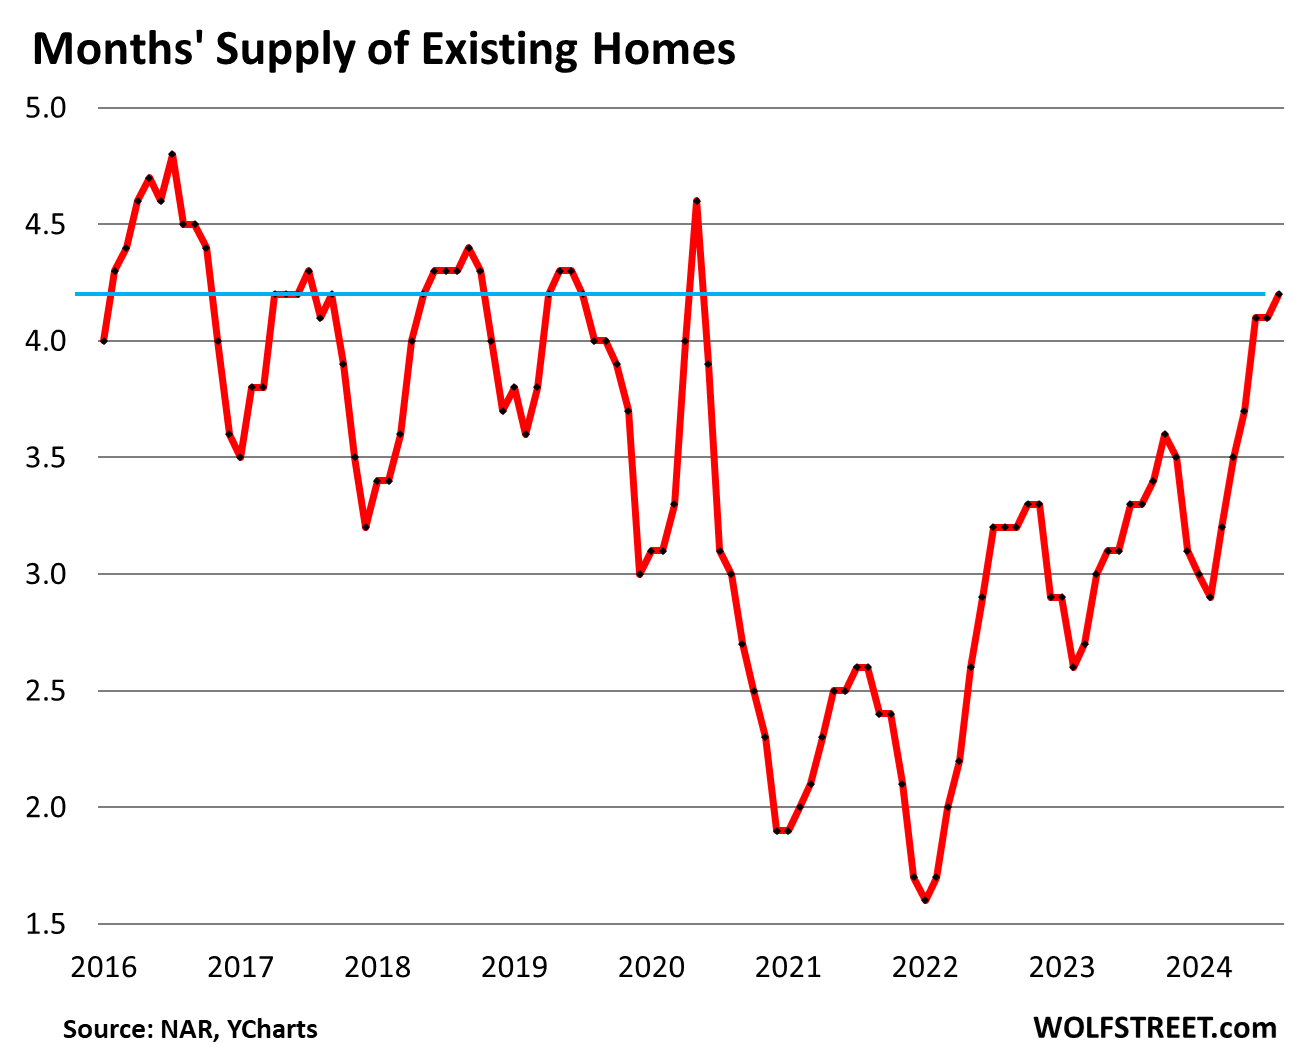
Inventory and supply rose to multi-year highs, as demand has wilted. Unsold inventory rose to 1.35 million homes, up by 22.7% from a year ago, and the highest since October 2020, according to NAR data.
Supply rose to 4.2 months at the current rate of sales, up 27% from a year ago, and the highest for any August since 2018.
The spike in supply in recent months is the result of the wilted sales and the rise in inventories of vacant homes that homeowners had moved out of some time ago but kept off the market to profit from the price spike all the way to the top; and now they’re putting them on the market without having to buy another home because they already bought one some time ago. (historic data via YCharts):
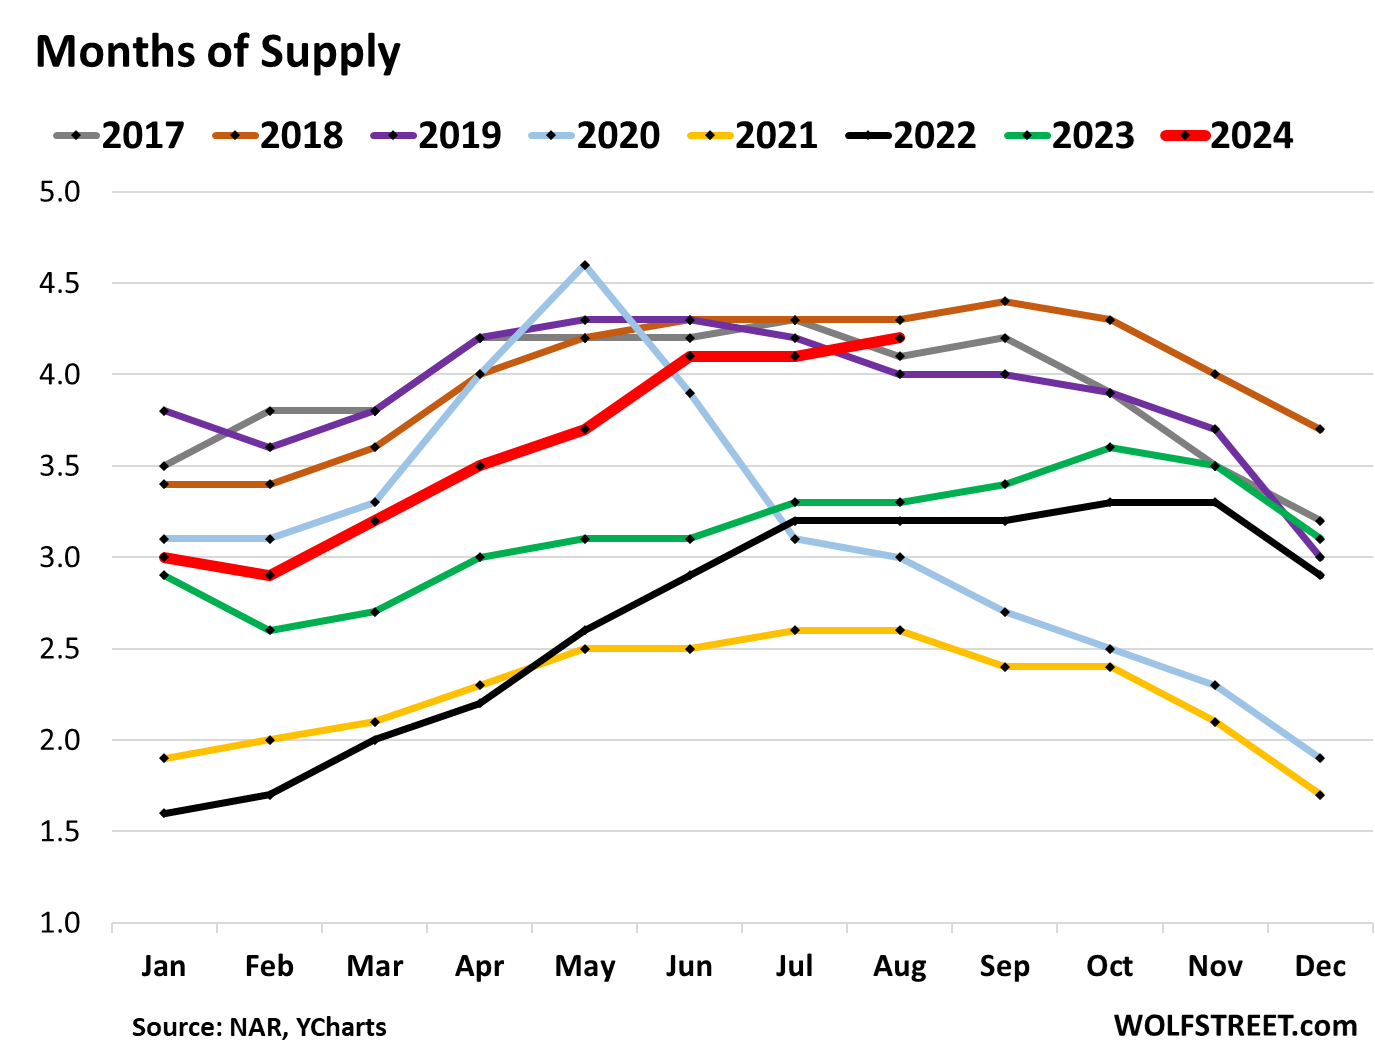
The stacked chart looks beyond the seasonality of supply. August 2024 (red line) was just a hair below August 2018 (brown line), which had the highest supply of any August in those years going back to 2017. 2018 was the final stage of a rate-hike cycle. Mortgage rates had risen past 4% and were on their way to max out at just over 5% by November 2018.
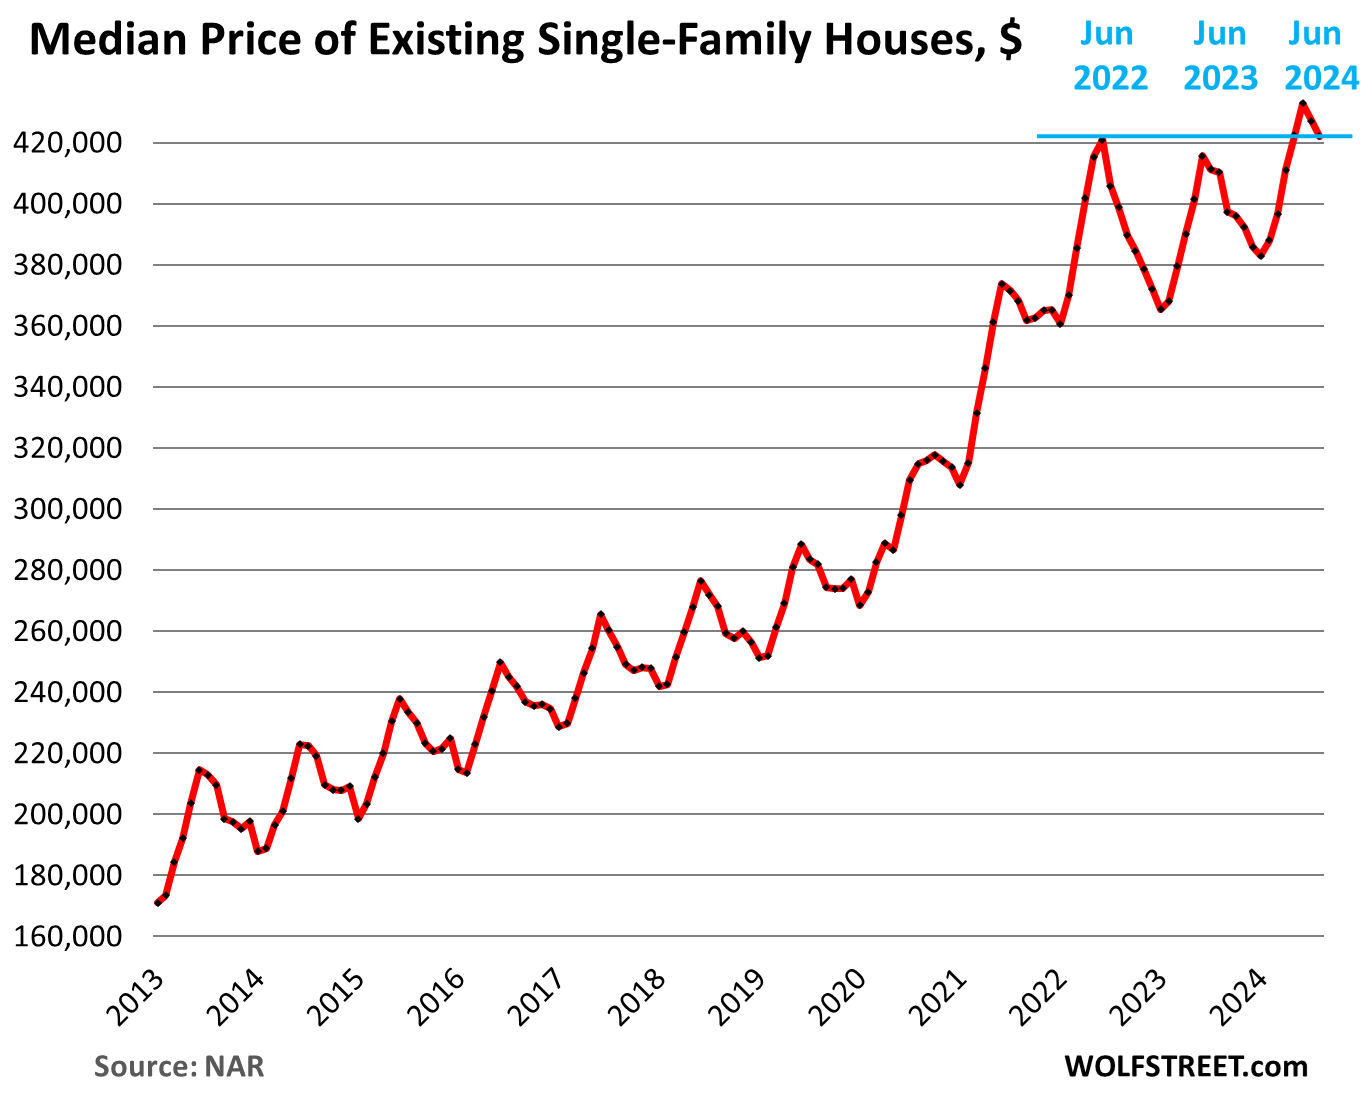
The median price of single-family houses fell to $422,100 in August, the second month of seasonal declines from the seasonal peak in June. In August, the median price was about the same as in June 2022.
The year-over-year gains have been whittled down each month for four months: In August to +2.9%, from +3.9% in July, +4.1% in June, +5.2% in May, and +5.4% in April.
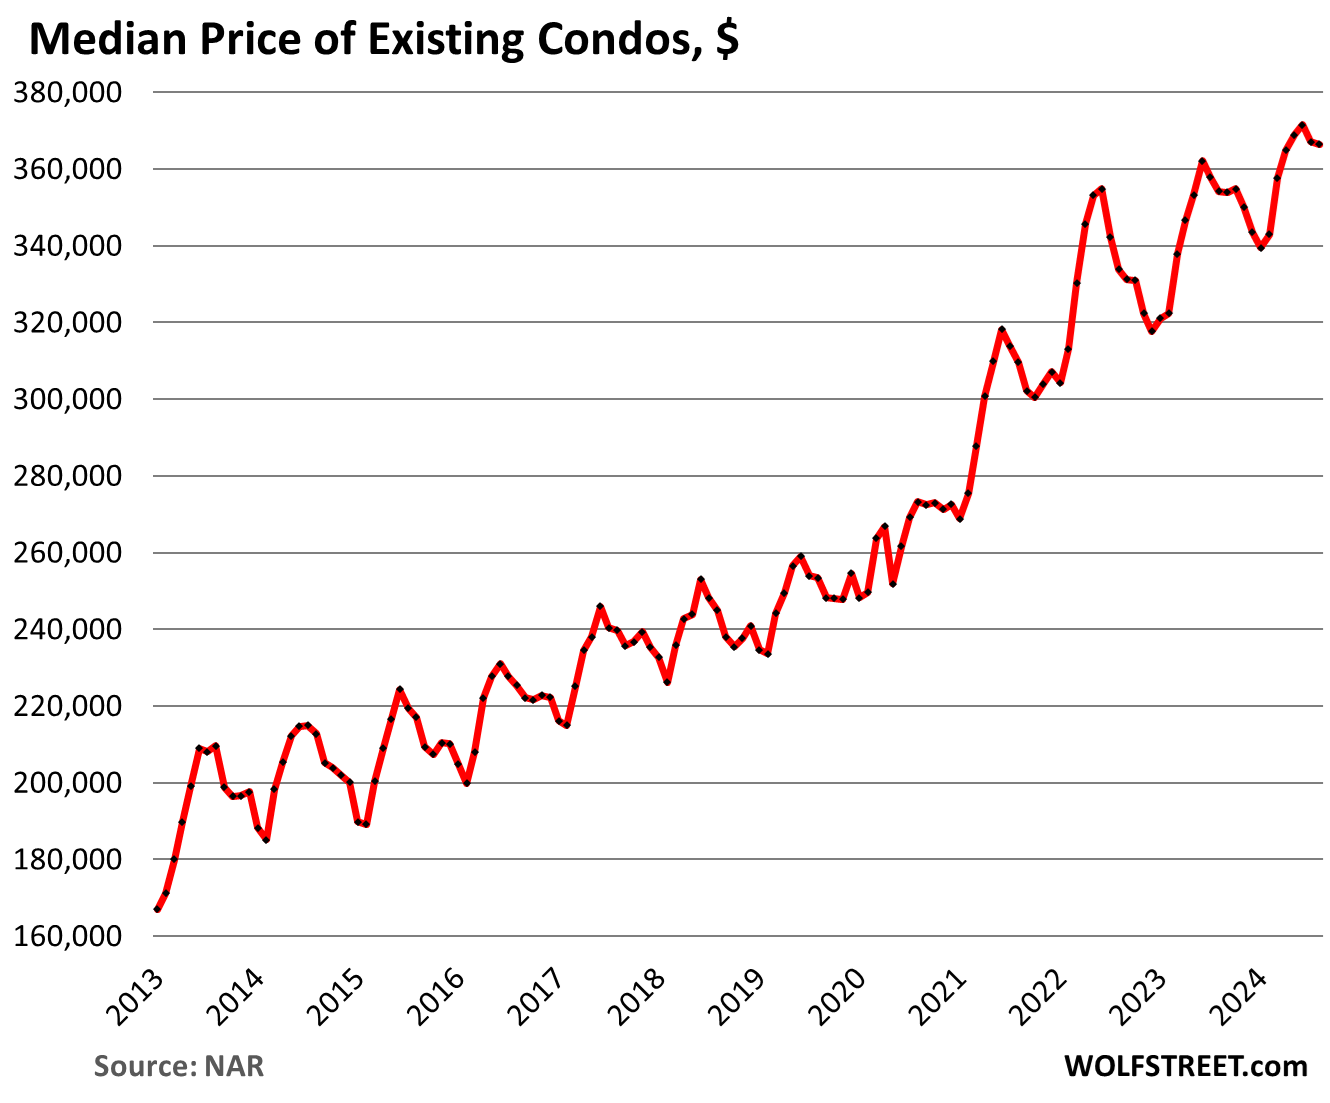
The median price of condos and co-ops dipped to $366,500 in August, and was up 3.5% year-over-year. The year-over-year increases through July had been getting smaller from the 8%-plus range late last year. Unlike single-family house prices, condo prices didn’t book any year-over-year declines in mid-2023.
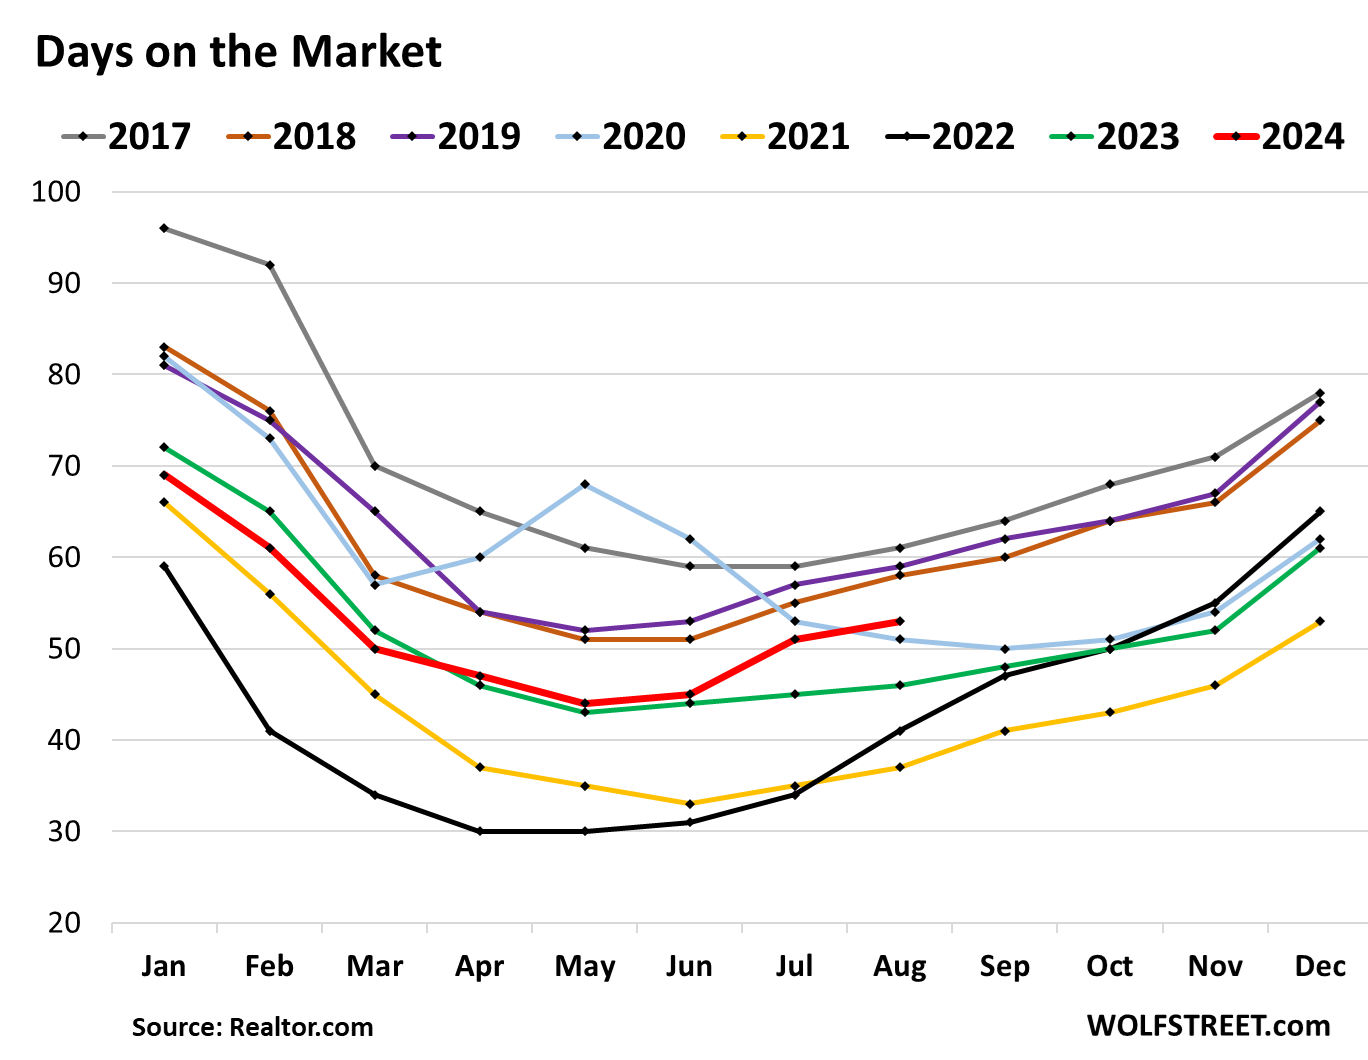
Median number of days a property sits on the market for sale before it sells or before it gets pulled off the market rose to 53 days in August, the highest for any August since 2019, according to data from Realtor.com.
Days on the market is kept down by sellers pulling their home off the market when it doesn’t sell after a few weeks, to then relist it later for sale at a lower price, or to try to rent it out, or turn it into a vacation rental, only to then relist it for sale. The metric tracks the mix of how quickly homes sell, and how aggressively sellers pull their unsold homes off the market.
Take the Survey at https://survey.energynewsbeat.com/