Summary
- Diamondback Energy announced the third quarter of 2022 results on November 7, 2022. The quarter’s revenues were $2,437 million, with a net income of $1,184 million or $6.72 per diluted share.
- Production for 3Q22 was 390.63K Boep/d, up 2.7% sequentially and down from 404.27K Boep/d the same quarter a year ago.
- I recommend buying FANG on any weakness between $160 and $155, with possible lower support at $141.1.
- Looking for a helping hand in the market? Members of The Gold And Oil Corner get exclusive ideas and guidance to navigate any climate.
Introduction
Midland, Texas-based Diamondback Energy, Inc. (NASDAQ:FANG) released its third-quarter 2022 on November 7, 2022.
Note: This article is an update of my article published on September 1, 2022.
The company indicated that it completed the purchase of Rattler Midstream on August 24, 2022, and is about to close the acquisition of Firebird Energy LLC.
1 – 3Q22 results snapshot
The company reported the third quarter of 2022 earnings of $6.72 per share, missing analysts’ expectations. This compares to $3.55 per share in 3Q21.
This quarter’s oil-equivalent production was 390.63K Boepd (57.4% liquids) sold at a composite oil price of $67.25 per Boe compared with $51.00 a year ago. Oil production was 224.35K Bop/d.
This quarter’s record revenues of $2.437 billion, up 26% from the year-ago quarter’s sales of $1.910 billion. The solid results can be attributed to the continued surge in energy prices in 3Q22, even if prices have dropped significantly sequentially.
Diamondback pays a regular quarterly of $0.75 a share and declared a variable dividend of $1.51 for a total dividend this quarter of $2.26 in 3Q22.
Travis Stice, the CEO, said in the conference call:
A Diamondback, we pride ourselves on our execution. Our commitment to being the lowest cost operator in the Permian Basin has and will continue to position us for success through the cycle. The third quarter was no exception.
2 – Investment Thesis
The investment thesis for FANG is similar to its peer, EOG Resources (please read my article published yesterday by clicking here). Thus, I continue to recommend a long-term investment, even if the risk of a recession in 2023 may adversely affect the oil industry.
The market rallied last week after reacting to the recent CPI announcement – a little lower than expected at 7.7%. However, Jerome Powell has been very clear, and I believe the Fed will hike interest by another 75-point on December 14. Therefore, we should not expect a solid extension to this last week’s rally unless new bullish news hits the wire.
Oil and gas prices are very volatile, and it seems that we wake up to a new reality every week. The market has no memory and reacts to emotion essentially.
Thus, trading LIFO using a combination of technical and fundamental analysis is the only viable strategy that can provide a decent long-term reward while reducing the risks.
It allows you to profit from the short-term swings and increase your leverage during unfavorable or unexpected turnarounds that can last longer than expected. This dual strategy is what I am recommending and constitutes the backbone of my Gold and Oil marketplace.
This two-level strategy has prevailed in my marketplace, “The Gold and Oil Corner,” and I believe it is the most rewarding strategy in those circumstances.
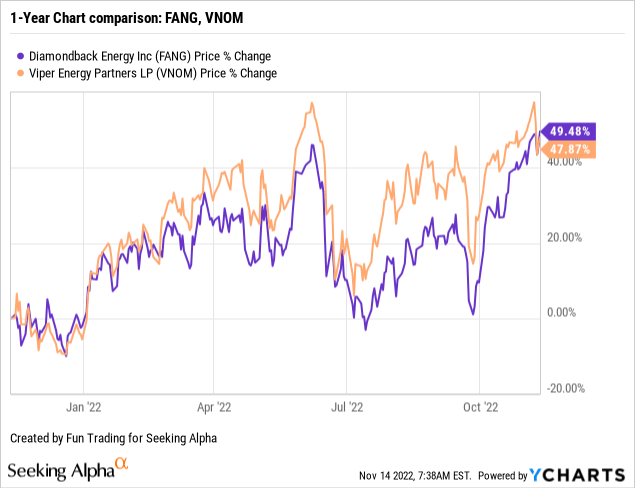
3 – Stock Performance
Diamondback Energy owns one subsidiary after acquiring Rattler Midstream. The subsidiary is Viper Energy Partners (VNOM), which trades separately.
Diamondback Energy’s performance on a one-year basis is solid, with a jump of 49%.
Diamondback Energy – 3Q22 Quarterly Financial Table: The Raw Numbers
| Diamondback FANG | 3Q21 | 4Q21 | 1Q22 | 2Q22 | 3Q22 |
| Total Revenues and others in $ Million | 1,910 | 2,022 | 2,408 | 2,768 | 2,437 |
| Net income in $ Million | 649 | 1,002 | 779 | 1,416 | 1,184 |
| EBITDA $ Million | 1,261 | 1,681 | 1,372 | 2,225 | 1,929 |
| EPS diluted in $/share | 3.56 | 5.54 | 4.36 | 7.93 | 6.72 |
| Operating cash flow in $ Million | 1,199 | 1,167 | 1,252 | 1,707 | 1,925 |
| CapEx in $ Million | 828 | 808 | 733 | 553 | 739 |
| Free Cash Flow in $ Million | 371 | 359 | 519 | 1,154 | 1,186 |
| Cash and cash equivalent $ Million | 457 | 654 | 149 | 43 | 27 |
| Total Debt in $ Million | 6,945 | 6,687 | 5.848 | 5.456 | 5,357 |
| Dividend per share in $ | 0.50 | 0.60 | 3.05 | ||
| Shares outstanding (diluted) in Million | 182.15 | 180.18 | 178.56 | 176.88 | 174.41 |
| Oil Production | 3Q21 | 4Q21 | 1Q22 | 2Q22 | 3Q22 |
| Oil Equivalent Production in K Boepd | 404.27 | 387.07 | 381.38 | 380.45 | 390.63 |
| Oil Composite realized price ($/Boe)/Hedge $Boe | 51.00/ 40.76 | 56.47/ 45.30 | 69.60/ 61.30 | 79.49/ 70.65 | 67.25/ 64.67 |
| OIL % | 59% | 59% | 58% | 58% | 57% |
| Oil in Bo | 22,058 | 20,819 | 20,055 | 20,120 | 20,638 |
| NG in Mcf | 45,571 | 45,220 | 42,645 | 42,912 | 45,799 |
| NGL in Boe | 7,540 | 7,254 | 7,161 | 7,349 | 7,667 |
| Total in Boe | 37,193 | 35,610 | 34,324 | 34,621 | 35,938 |
Source: Diamondback Energy press release
Analysis: Revenues, Free Cash Flow, Net Debt, and Oil & Gas Production
1 – Quarterly revenues and others were $2,437 million in 3Q22
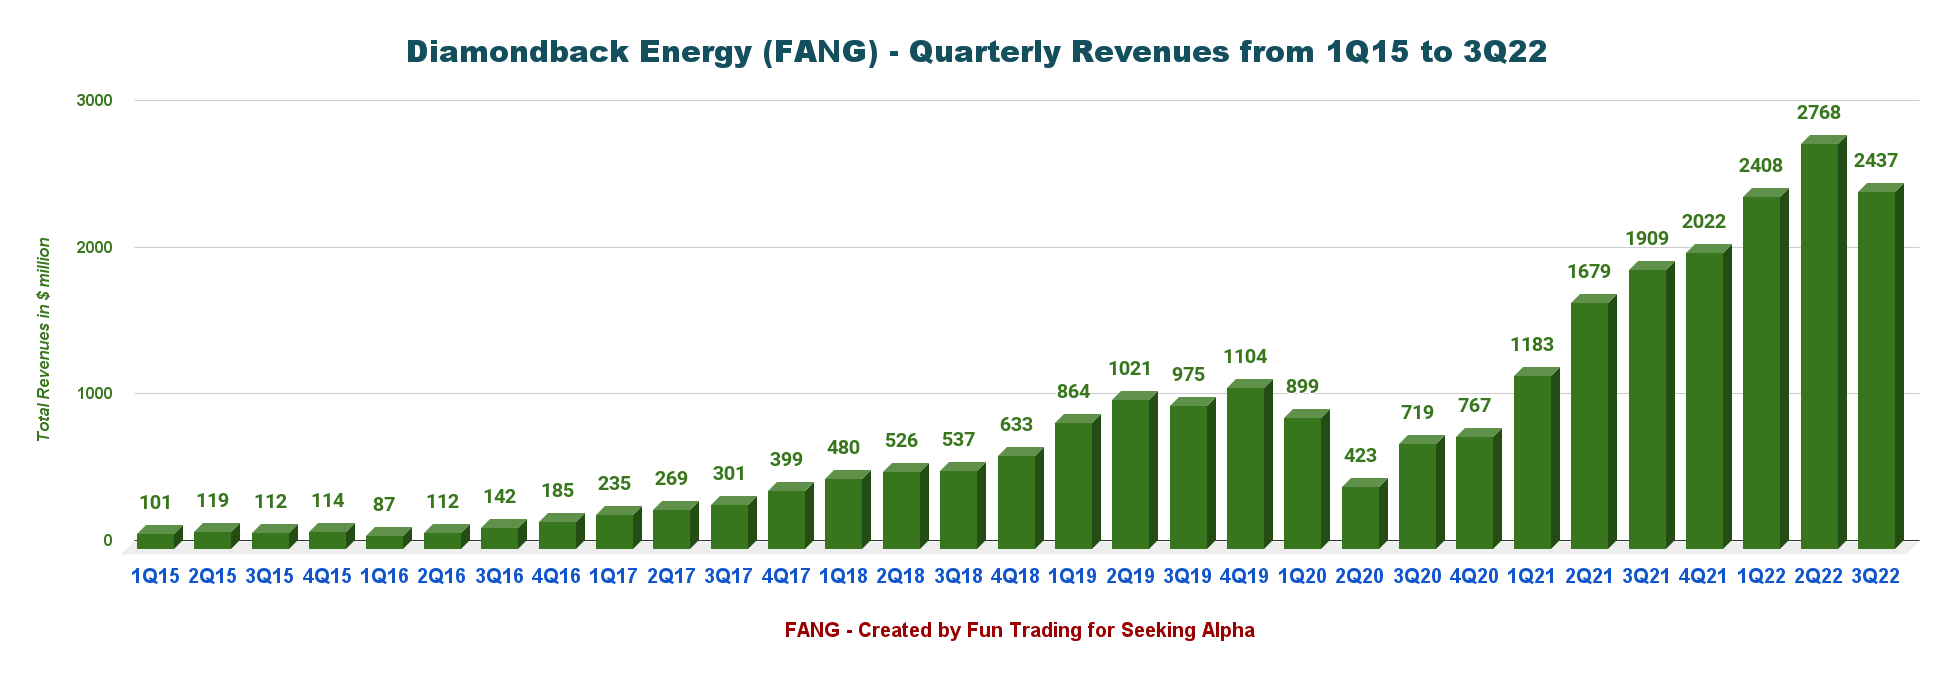
FANG Quarterly Revenues history (Fun Trading)
The 3Q22 cash operating costs were $11.97 per Boe. Lease operating expense LOE was $5.09 per Boe. Gathering and transportation expenses increased in the third quarter of 2022 to $1.98 per Boe. Inflationary pressures are building up in costs.
One crucial development this quarter is the pending acquisition of Firebird Energy LLC announced on October 11, 2022.
The acquisition will combine 5.86 million shares and $775 million in cash. It will add 68,000 net acres in the Midland Basin with 17 Mbo/d at the close. Extending production is an excellent use of cash. The transaction is expected to complete at the end of November.
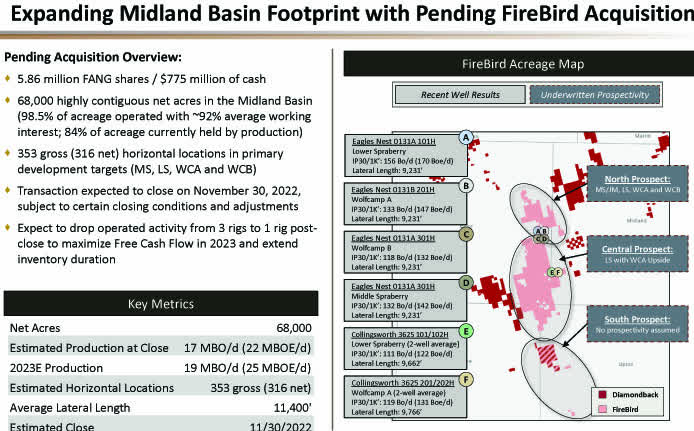
FANG Firebird acquisition (FANG Presentation)
2 – Generic free cash flow was $1,186 million in 3Q22
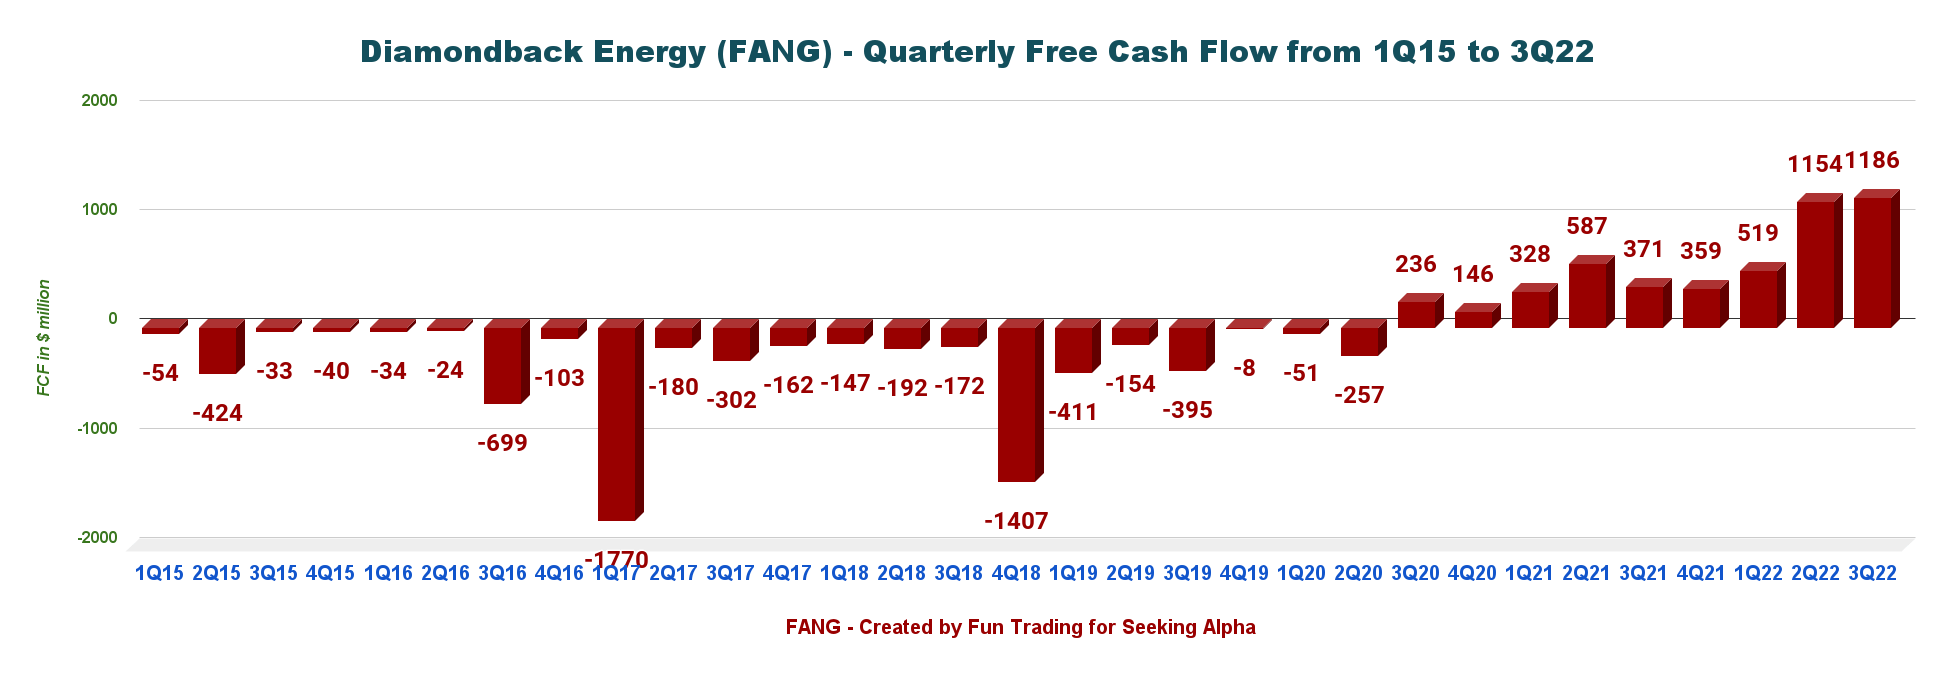
FANG Quarterly Free cash flow history (Fun Trading)
Operating cash flow is $1,925 million, and CapEx is $739 million.
Trailing 12-month free cash flow is now $3,234 million, with the third quarter’s free cash flow at $1,186 million.
FANG declared a 3Q22 base cash dividend of $0.75 per share and announced a variable cash dividend of $1.51 per share. It is a total base-plus-variable dividend of $2.26 per share for 3Q22, down from $3.05 in 2Q22.
Also, FANG repurchased 3,922,418 shares of common stock in 3Q22 for $472 million (at a weighted average price of $120.50/share).
3 – Net debt is $5.33 billion in 3Q22 (incl. subsidiaries). Excellent profile.
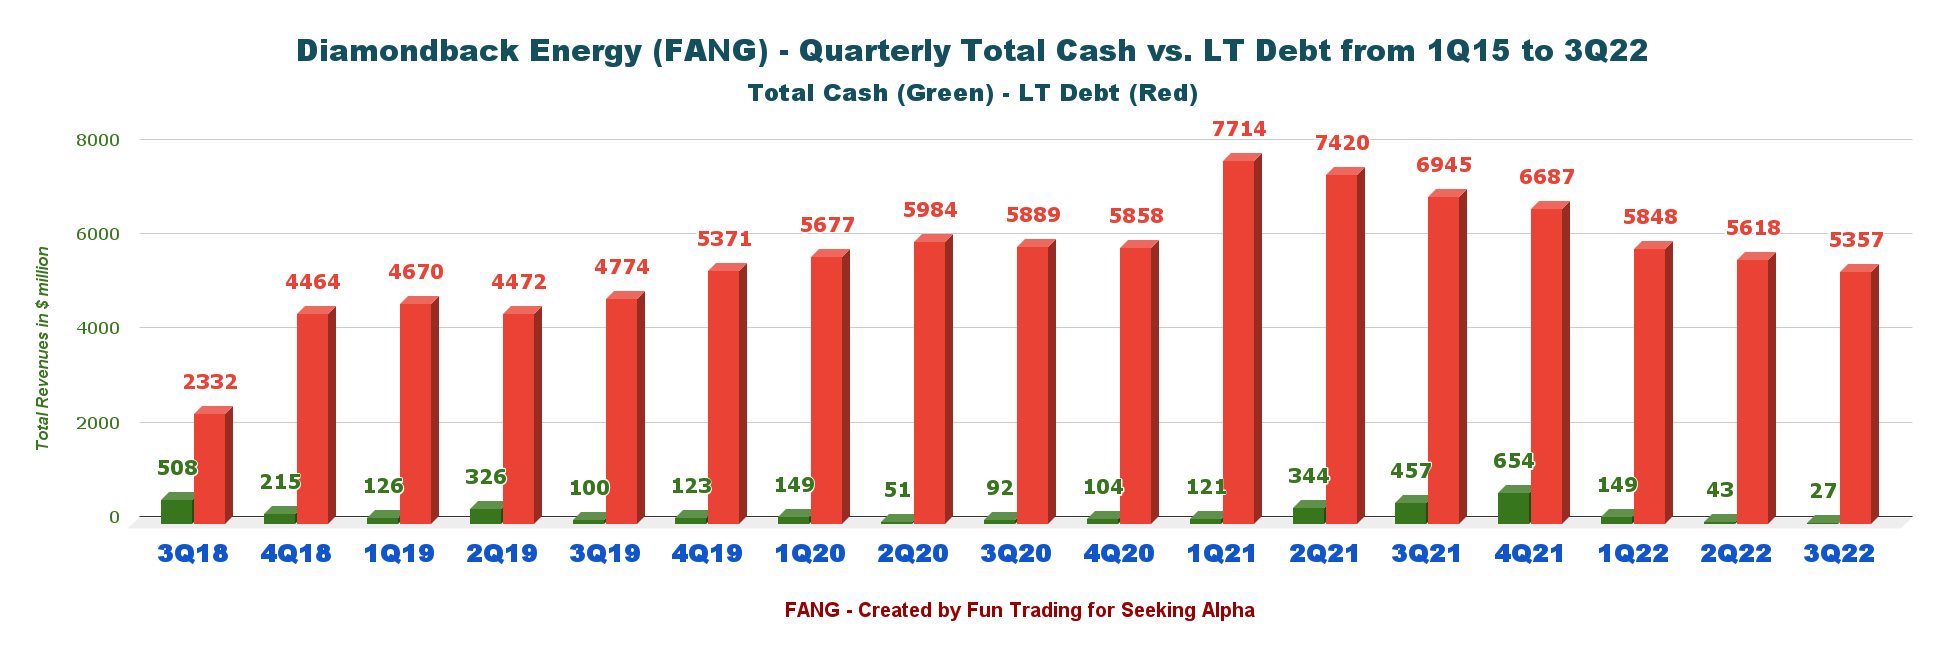
FANG Quarterly Cash versus Debt history (Fun Trading)
FANG’s total debt, excluding its subsidiary, is $4,840 million. Details are shown below:
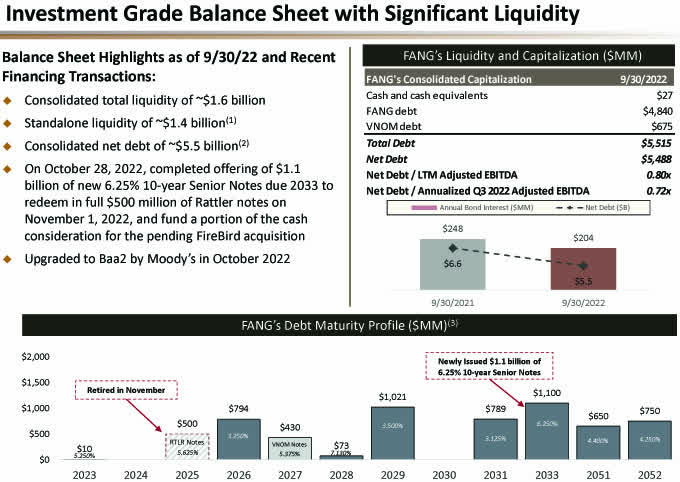
FANG Quarterly Balance sheet liquidity (FANG Presentation)
4 – Quarterly Production was 390.63 Boep/d in 3Q22
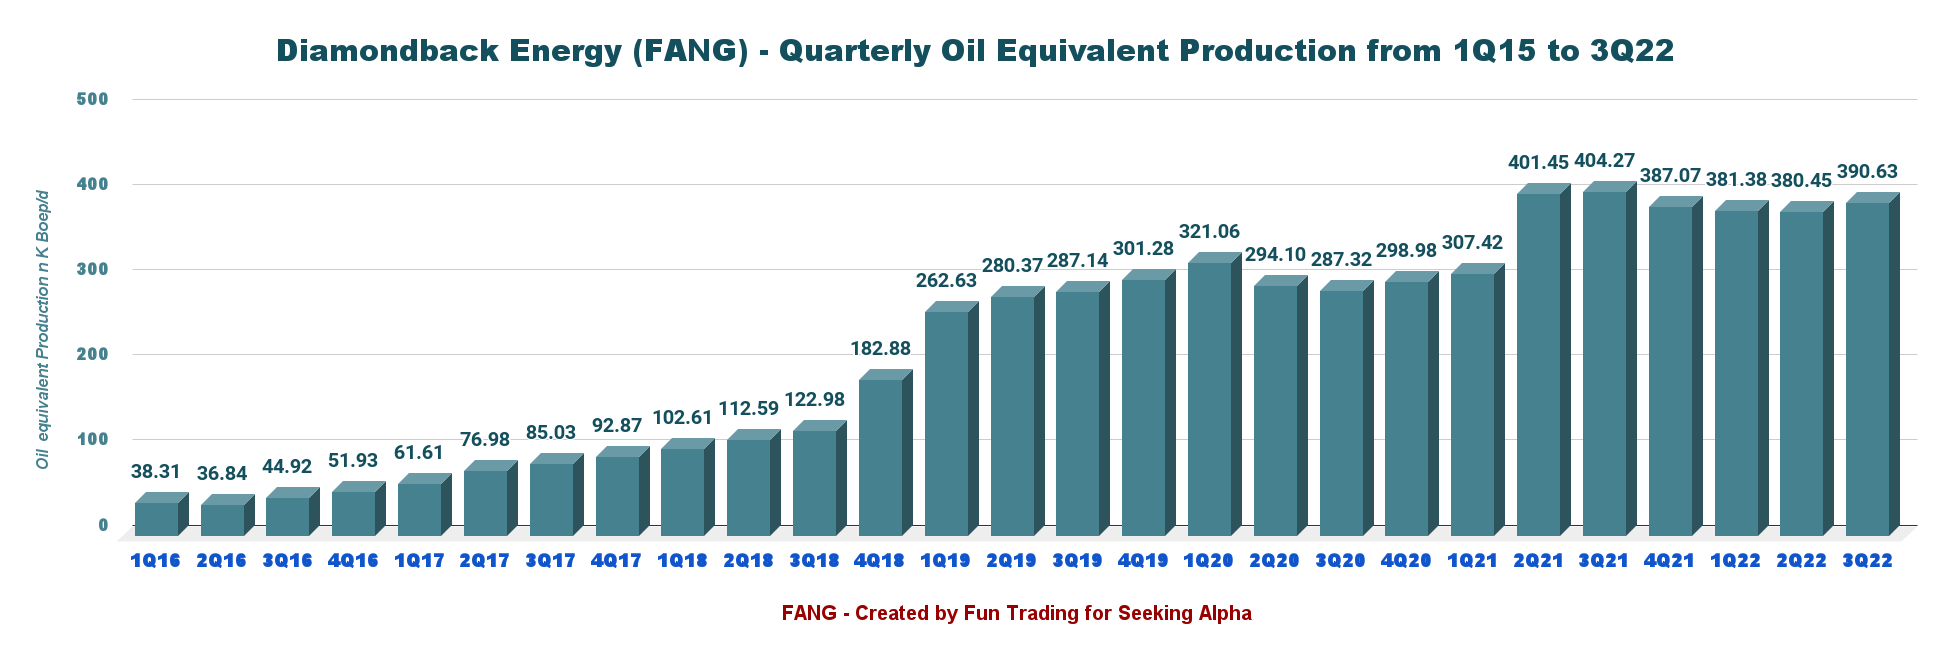
FANG Quarterly Oil equivalent production history (Fun Trading)
Production for 3Q22 was 390.63K Boep/d, up 2.7% sequentially and down from 404.27K Boep/d the same quarter a year ago (see chart above).
The percentage of oil is 57.4% in 3Q22. Below is the chart repartition between oil, NG, and NGL.
FANG Production in Oil, NGL, and NG in 3Q22 (Fun Trading)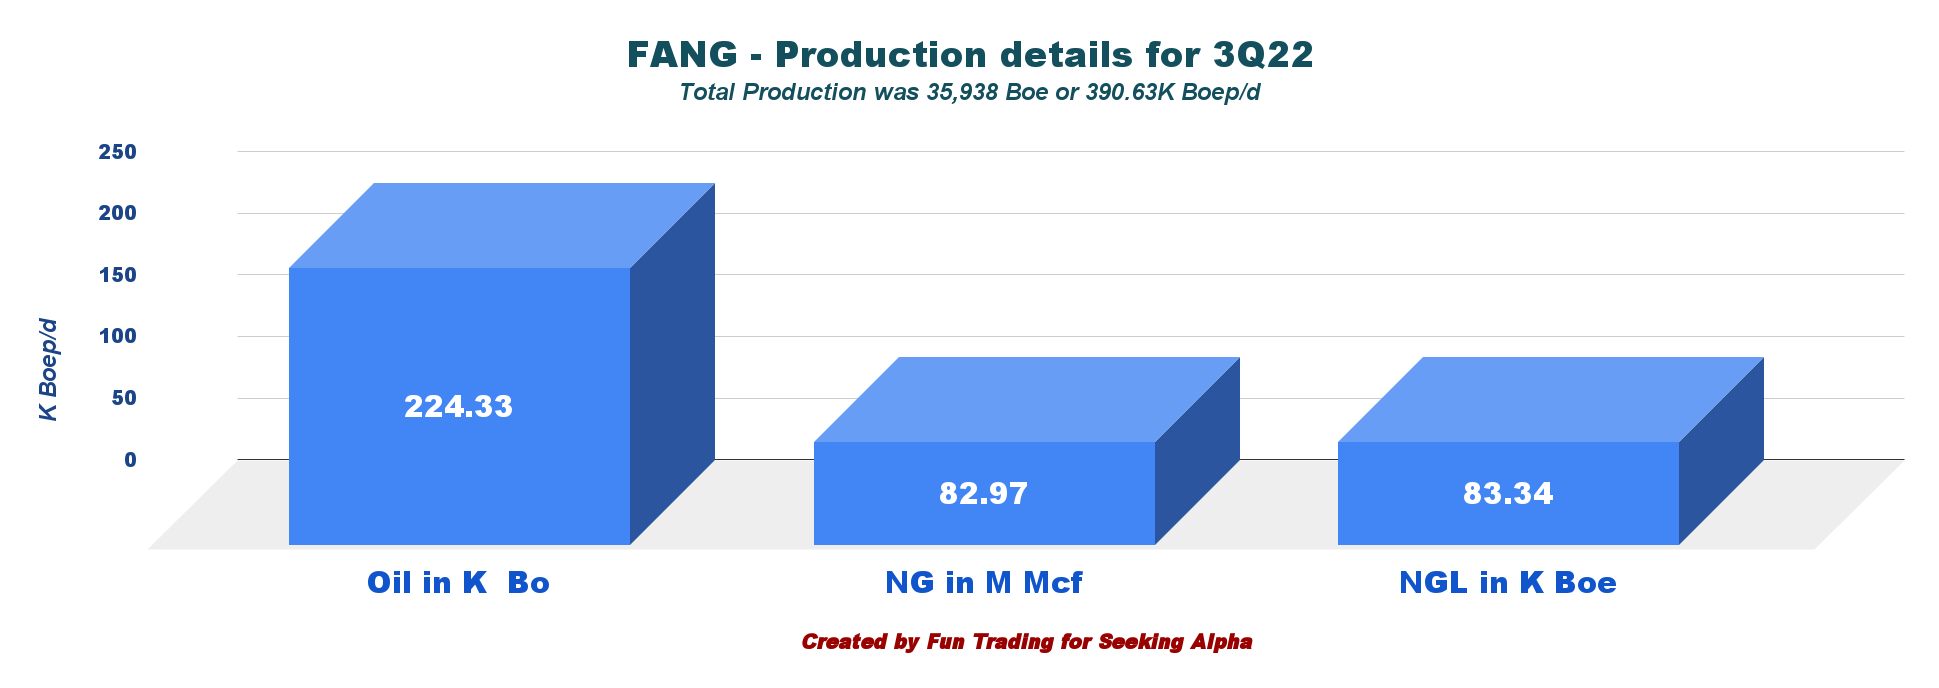
The average oil composite in 3Q22 (unhedged) was $67.25 per Boe, up from $51.00 a year-ago quarter and down 15.4% sequentially.
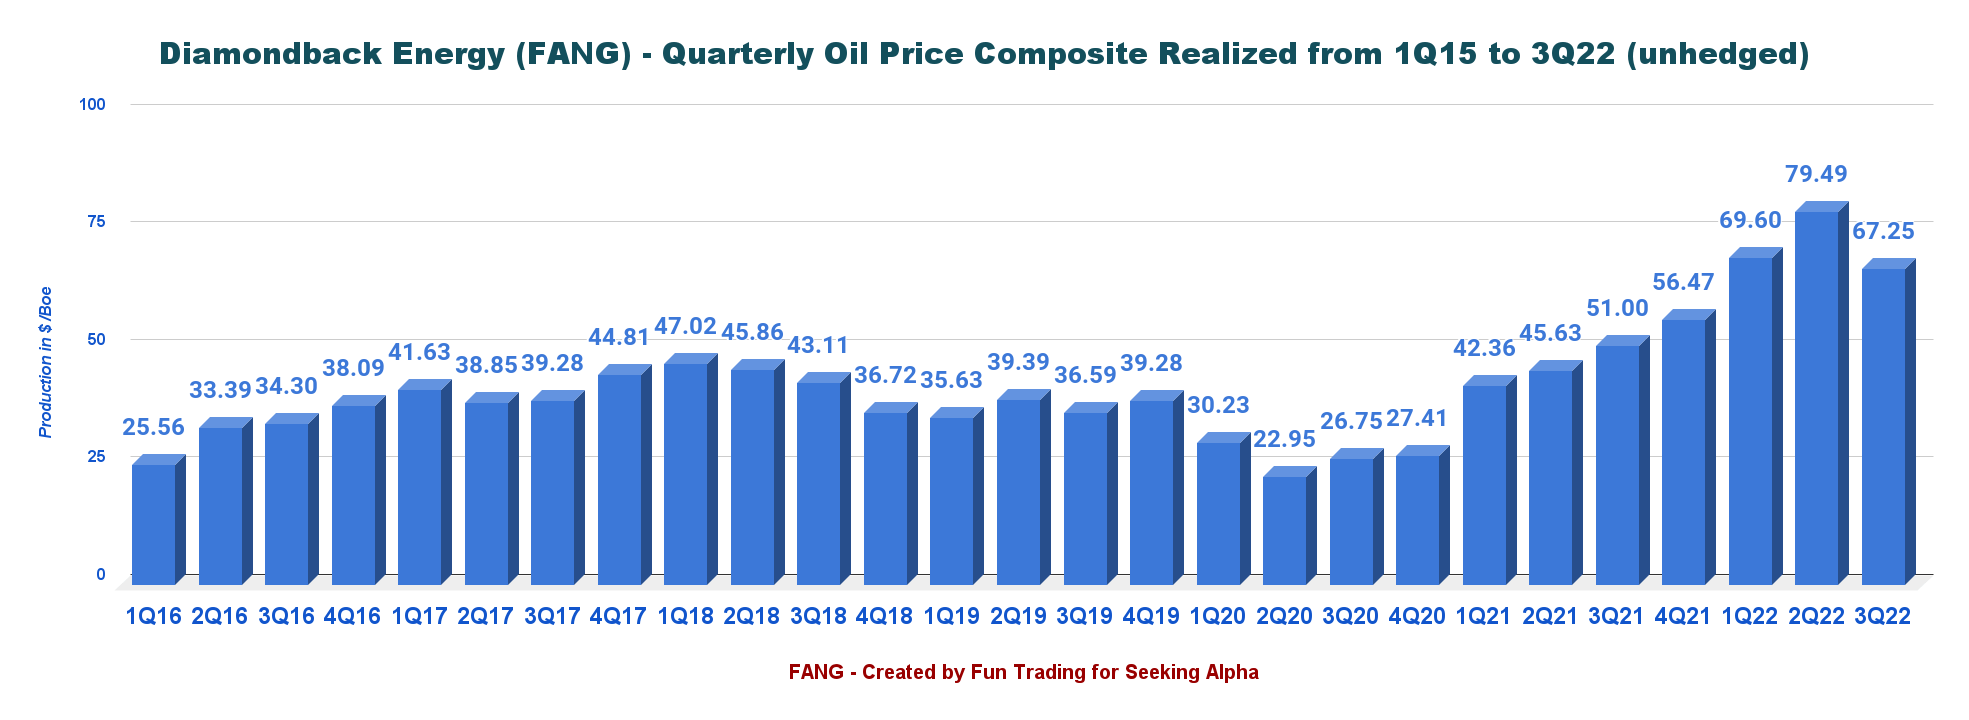
FANG Quarterly Oil price history (Fun Trading)
During the third quarter, the average realized oil price was $89.79, and realized natural gas prices were $6.46 per thousand cubic feet (Mcf) from $2.40 in the year-ago period.
5 – 4Q22 Guidance
- In 2022, Diamondback slightly increased its total net production guidance between 386k-393k Boep/d in 4Q22.
- FANG expects its oil production to be in the 223k-224k Bop/d for 4Q22.
- The company forecasts CapEx between $1.82 billion and $1.9 billion. In the fourth quarter of 2022, the company expects capital spending of between $540 and $555 million, which is a substantial increase.
- FANG increased its expected cash tax rate to 10-15% of the pre-tax income.

FANG 2022 Guidance (FANG Presentation)
Technical Analysis (Short Term) and Commentary
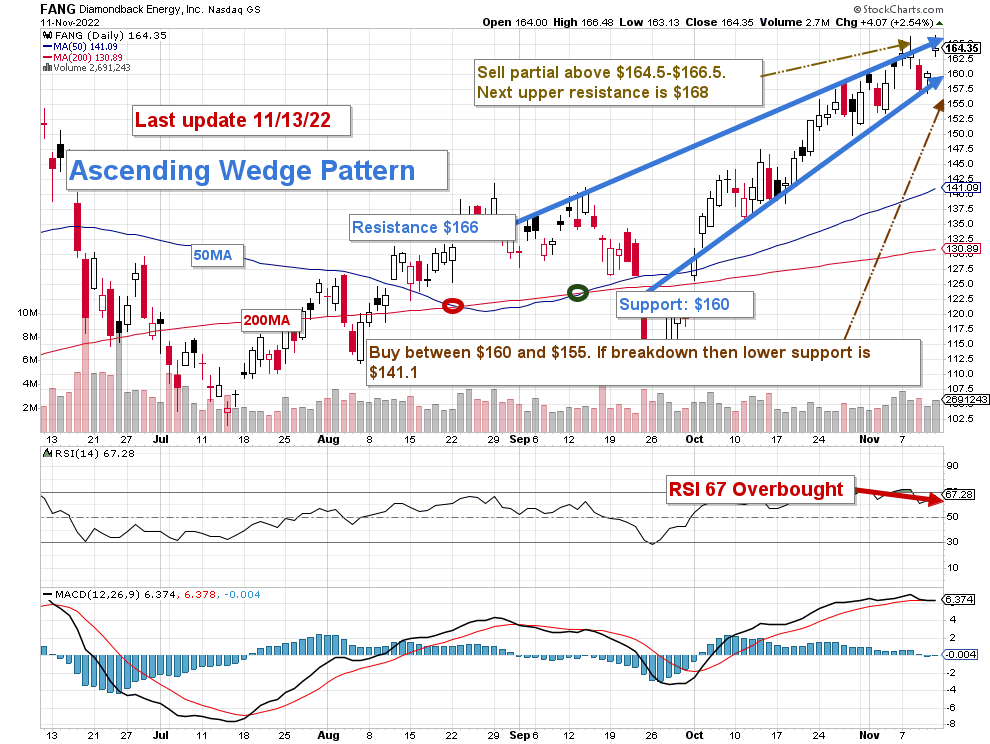
FANG TA Chart Short-term (Fun Trading StockCharts)
Note: The chart has been adjusted for dividends.
FANG forms an ascending wedge pattern with resistance at $166 and support at $160. The resistance and support lines are narrowing, and it is due to the proximity of the apex, which suggests a possible breakout soon.
The ascending or rising wedge pattern is generally a bearish chart pattern that signals an imminent breakout to the downside. It is also confirmed by the high RSI number, which signals an overbought situation.
However, it is essential to consider the oil prices trend before coming to a definitive conclusion. If oil prices stay, bullish FANG could eventually trade higher even if we are already overbought.
Thus, the short-term trading strategy is to trade LIFO about 30% of your position and keep your long-term core holding for a much higher payday or as a good source of steady income.
I suggest selling between $165.5 and $166.5 and waiting for a retracement between $160 and $155 with potential lower support at $141.1.
Note: The LIFO method is prohibited under International Financial Reporting Standards (IFRS), though it is permitted in the United States by Generally Accepted Accounting Principles (GAAP). Therefore, only US traders can apply this method. Those who cannot trade LIFO can use an alternative by setting two different accounts for the same stock, one for the long term and one for short-term trading.
Warning: The TA chart must be updated frequently to be relevant. It is what I am doing in my stock tracker. The chart above has a possible validity of about a week. Remember, the TA chart is a tool only to help you adopt the right strategy. It is not a way to foresee the future. No one and nothing can.