
Dominion’s 2026 filing puts 39.2 GW of new generation and storage on the Virginia grid at a $183.4 billion portfolio cost, a present value in 2026 dollars. In nominal dollars its own table takes a typical 1,000 kWh bill from $180.31 to $283.65 by 2046; deflated at the filing’s 2% escalator, that is about $191 today, roughly $11 more. On the SCC-directed method the same table lands at $458.22, or 154.1%. A new Brattle/ESIG study of four U.S. power regions says who pays comes down to whether the system has room.
By the ENB Research Desk for Stu Turley. Data as of Oct. 28, 2026, 6 a.m. CT.
| The short version
Dominion filed its 2026 Integrated Resource Plan update Oct. 15 in Virginia SCC Case No. PUR-2026-00163. The preferred plan adds 39,244 MW by 2046 at a total portfolio cost of $183.4 billion, a net present value in 2026 dollars, plus $91.5 billion of construction. A typical 1,000 kWh Virginia bill goes from $180.31 now to $283.65 at year-end 2046: +$103.34, or +57.3%, on the company’s method, in nominal dollars. On the SCC-directed method it hits $458.22, or +154.1%. A new Brattle/ESIG study finds one 500 MW load can cut a Southeast utility’s rates by 0.88 cents/kWh with headroom, or raise them 0.44 cents without. Dominion says data centers sign 14-year contracts with minimum demand of 85% for wires and 60% for generation plus $1.5 million per MW of collateral. On paper, stranded-cost risk sits on the load. |
Two documents landed eight days apart, and together they frame Virginia’s affordability fight. One is Dominion’s 20-year build plan. The other models what one large load does to everyone else’s rate in four U.S. regions. Neither answers alone. Our earlier piece on the wires made the same point: the invoice depends on the rules, not just the megawatts.
What Dominion wants to build
The plan is large: 21,229 MW of solar, 3,479 MW of offshore wind, 3,525 MW of storage, 8,965 MW of natural gas and 2,046 MW of small modular nuclear. Dominion told CBS 6 that more than three-fourths of the build is carbon-free (WTVR).
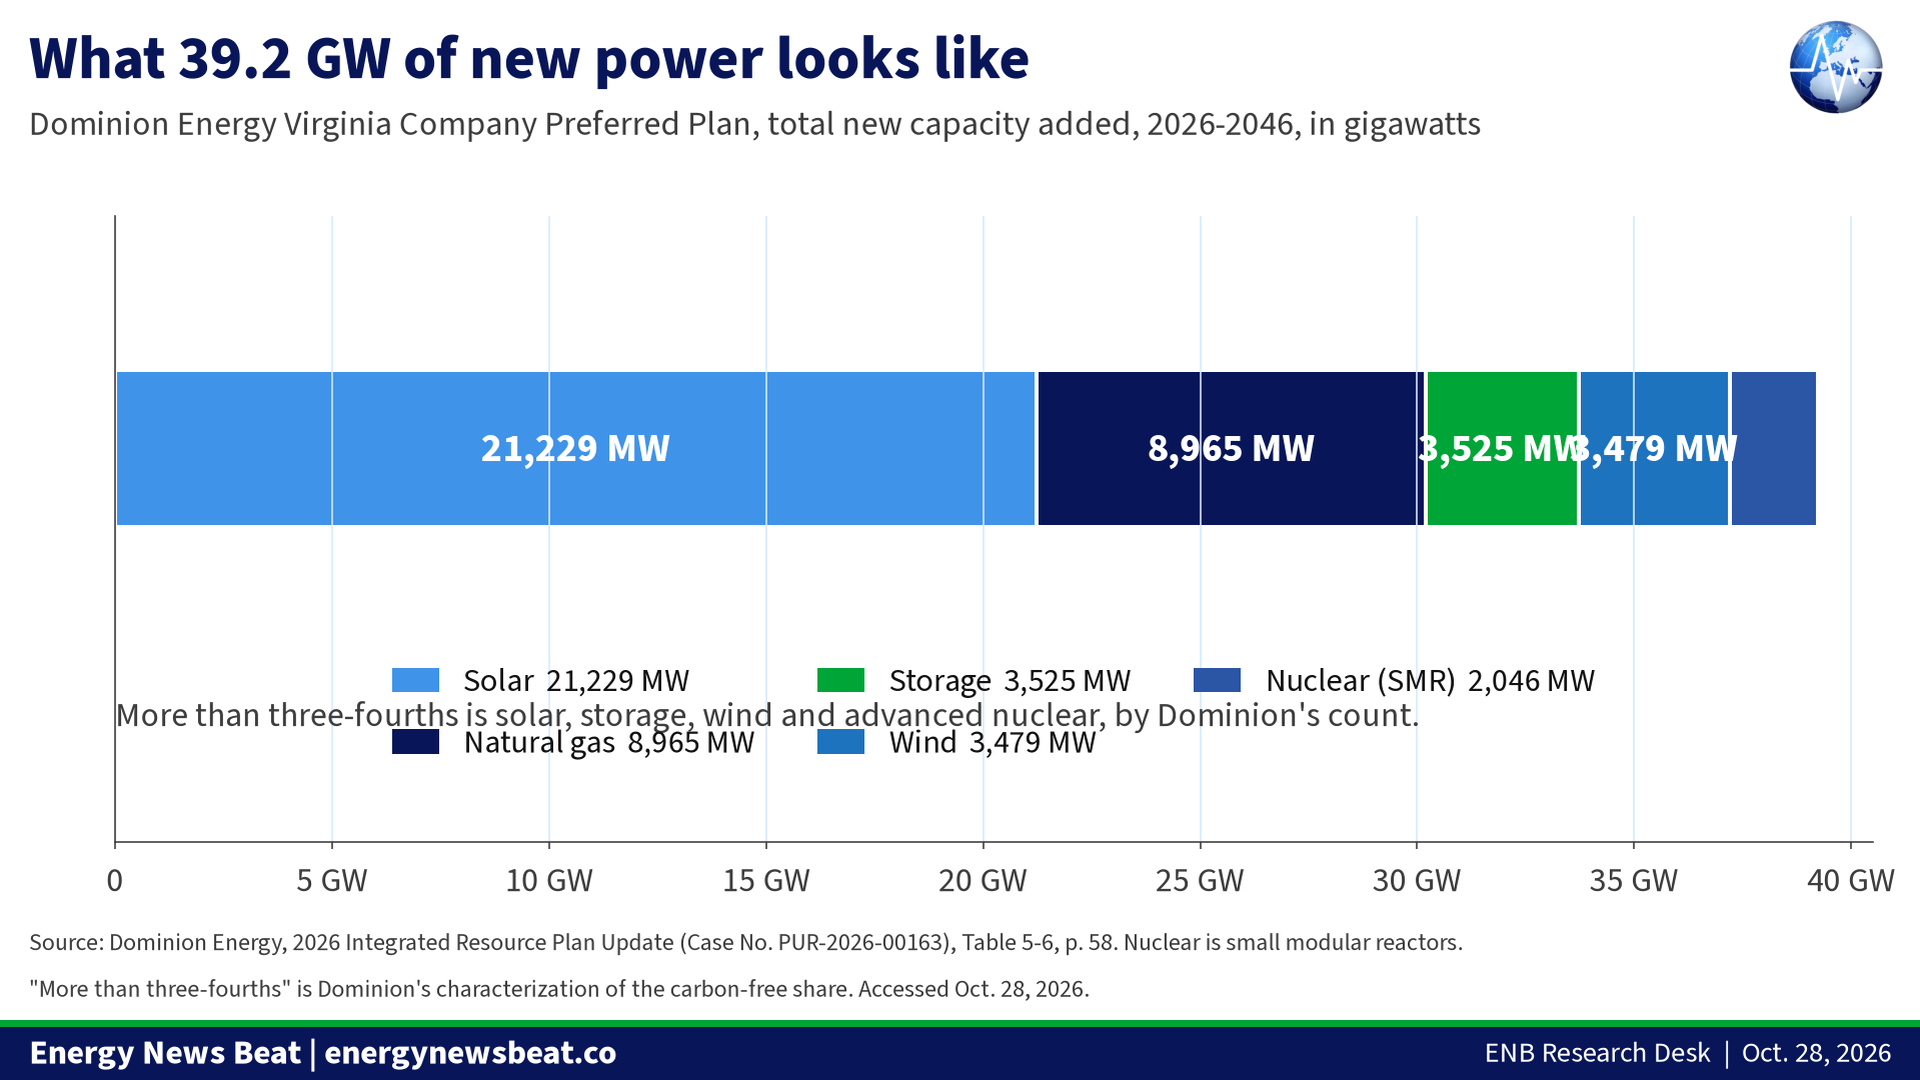
The gas number is political. The plan needs a reliability exception under the Virginia Clean Economy Act to keep existing generation and add 8.9 GW of gas, the same 8,965 MW in Table 5-6, not a second tranche. Absent a carbon-free dispatchable alternative, “natural gas generation will remain a critical component” (Virginia Mercury).
The bill math, and why there are two answers
Table 3-1 reaches the kitchen table. The company’s method carries forecasted sales growth and shifting class allocation factors, landing at $283.65 in 2046, up $103.34 or 57.3%. The SCC-directed method holds allocation factors constant with no sales growth, landing at $458.22, up $277.91 or 154.1%.
The dollars are nominal, and the IRP applies a 2% annual escalator, so much of that $103 is inflation. Deflated at 2%, $283.65 in 2046 is about $191 in 2026 dollars, roughly $11 more than today’s $180.31. The company method compounds at 2.26% a year, barely above the escalator.
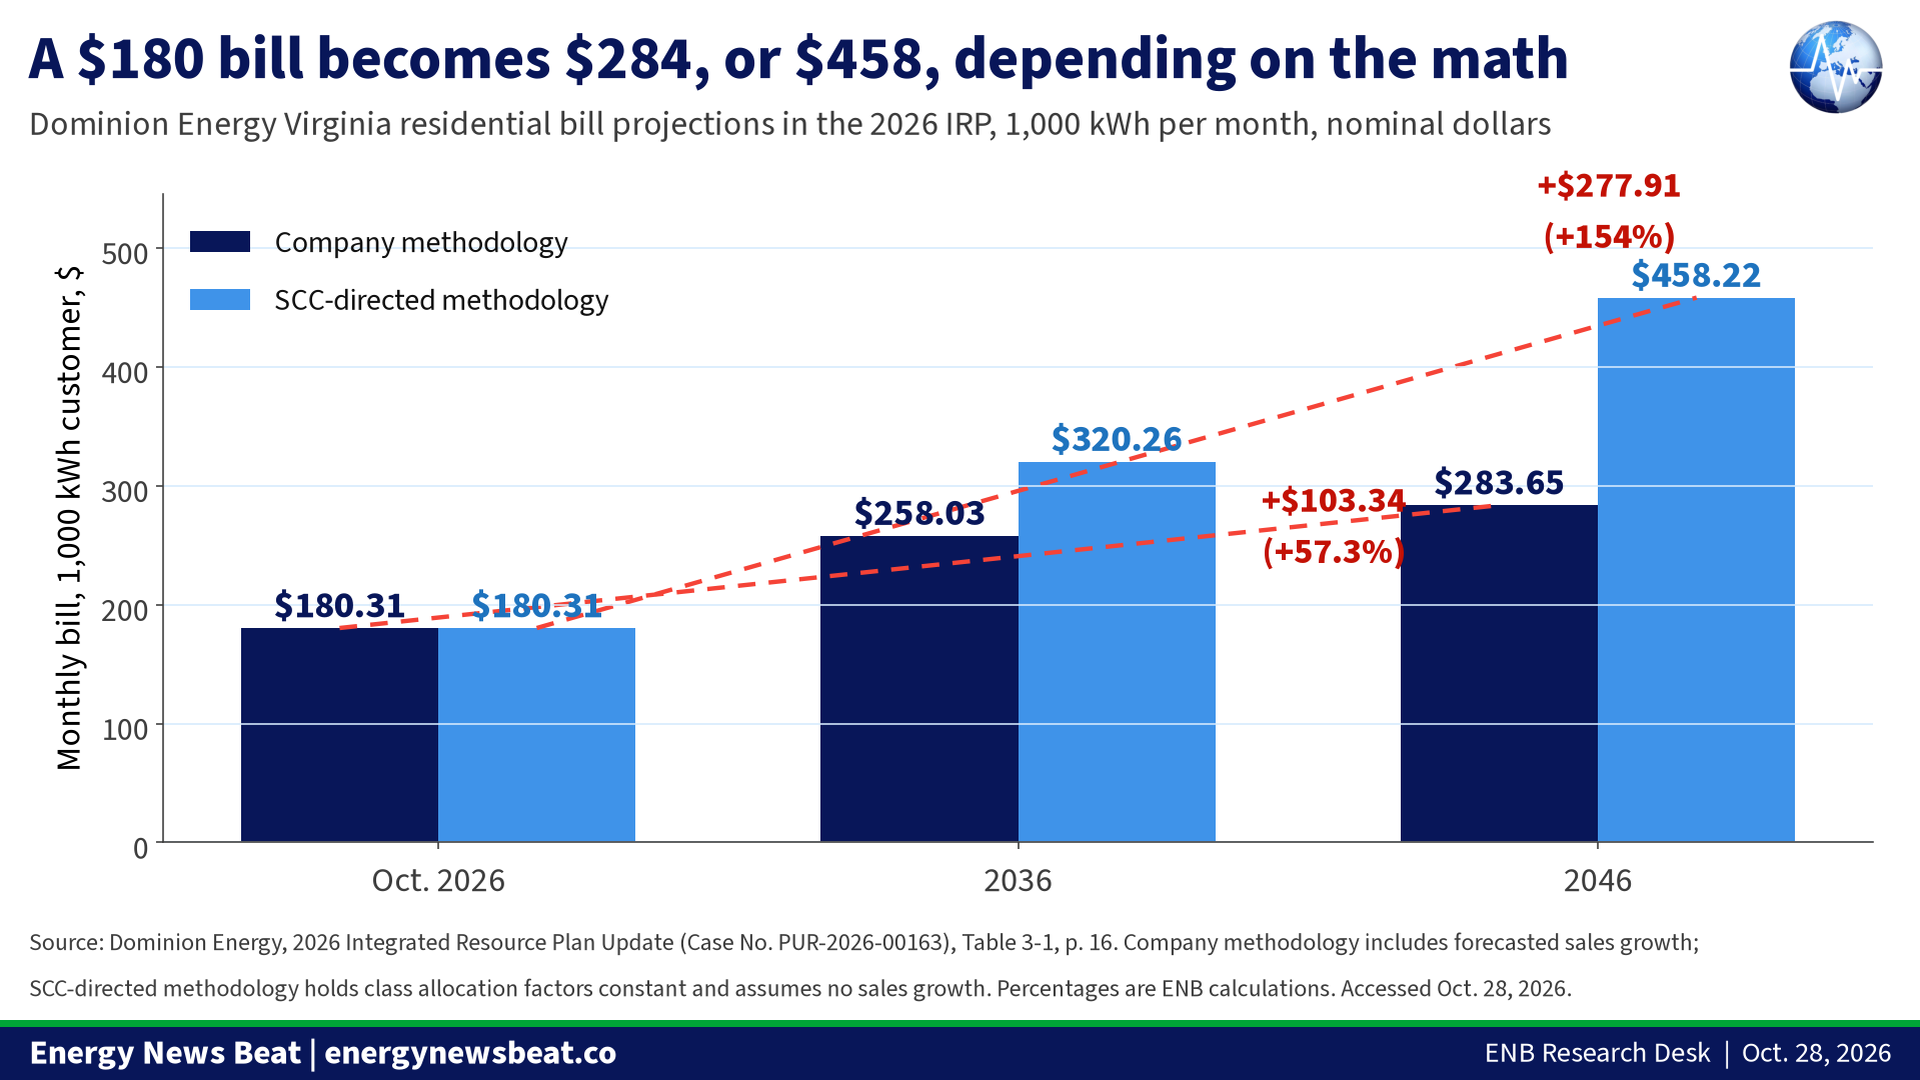
Dominion calls the directed method “overstated” because it ignores anticipated sales growth (Virginia Mercury). Read the two columns as the optimistic and pessimistic ends of one table. The SCC method assumes zero sales growth for 20 years, a comparability assumption rather than a forecast. The company method assumes data center load shows up as predicted, which the 25,000-versus-12,000 MW gap puts in doubt. Neither is a rate order.
The 25,000 MW question
The forecast rests on requests, not contracts. As of February 2026, Dominion had approximately 25,000 MW of large-load delivery point requests with connection dates through Dec. 31, 2031, and says they “continue to grow.” Separately, it told CBS 6 that about 12,000 MW of data center capacity is under contract in its Virginia retail territory. That gap is the whole risk question: 25,000 MW asked for, roughly half signed.
Dominion’s answer is the package the SCC approved in Case No. PUR-2025-00058 on Nov. 25, 2025. A new GS-5 class covers customers with 25 MW or more of demand and a 75% load factor from Jan. 1, 2027, on 14-year terms with minimum demand charges of 85% of contracted demand for wires and 60% for generation, and post $1.5 million per MW of collateral, released one-fourteenth a year.
On a 500 MW campus that is $750 million of collateral before any credit reduction, and a generation floor on 300 MW even at half its contracted demand. That is the mechanism behind Dominion’s claim that households will not pay for a stranded substation. It holds only if the customer is still there to bill.
What Brattle and ESIG actually found
“Impacts of Large Loads on Electricity Rates” was published this month by an ESIG task force with Brattle authors Long Lam, Natalie Northrup, Ryan Hledik and Oliver Grocott. It models a 500 MW load on a 15-year contract on a 3 GW vertically integrated utility, then on prototypical utilities in MISO, PJM and ERCOT.
The answer is not fixed. In the Southeast case, sufficient headroom lowers existing customers’ rates by 0.88 cents/kWh, about 6% over the term. With none, rates rise 0.44 cents, about 3%. Roughly 175 MW of headroom, 35% of the load’s peak, lands near neutral.
Scale changes it again. Before tariffs, one 500 MW load costs existing customers 0.44 cents in the Southeast, 0.22 in MISO, 0.07 in PJM and 0.02 in ERCOT. Scale every market’s large-load additions to 16.7% of regional peak, and the impacts become 0.29 cents in MISO, 1.35 to 2.53 in PJM and 0.65 in ERCOT.
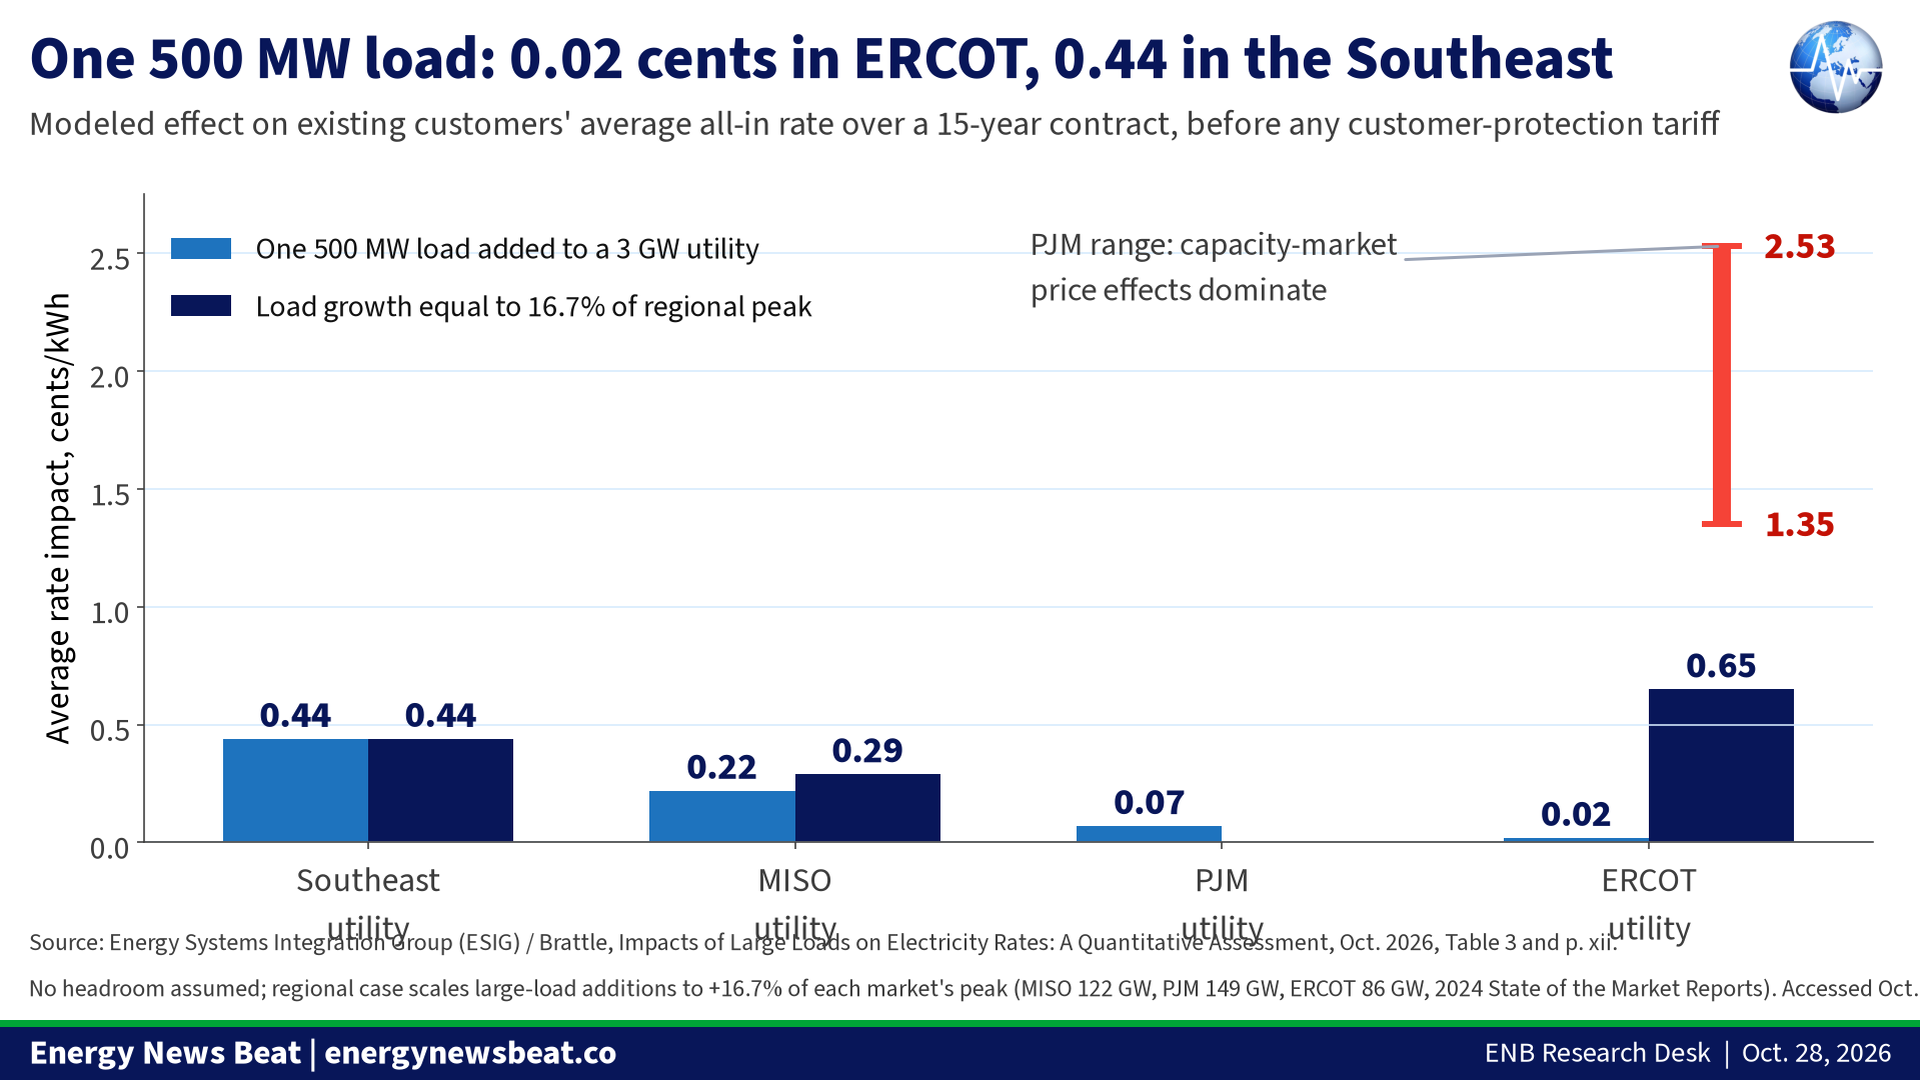
Forecast error is the second lever: 0.73 cents if the load is four years late, 0.93 if it arrives at half size, 0.87 if it leaves five years early, and 1.32 if all three happen. Tariff design is the third. A termination payment cuts the worst case 27%; an 80% minimum billing demand cuts it 52%. Dominion’s 60% generation floor is looser than the 80% the study tested.
Why PJM is the hard case
The 1.35 to 2.53 cent range is not Virginia-specific. It comes from capacity-market price effects across a 149 GW region, and under PJM’s construct the study says it is “difficult to protect existing customers through measures such as direct cost assignment or minimum bill requirements”. A Virginia-only tariff cannot wall Virginians off from Ohio’s growth.
There is a counterweight. PJM’s price collar of about $325/MW-day has been binding. It is not a market rule but a settlement between PJM and Pennsylvania Gov. Josh Shapiro’s office for the 2026/27 to 2028/29 auctions, and the study says if it holds the price effect of an incremental load would be $0. The high end assumes the collar comes off and prices climb toward $550/MW-day.
The filing describes the pressure from the other side: in the 2028/29 auction, total committed resources landed 6,800 MW short of PJM’s requirement at a 14.4% reserve margin against 20%, and PJM estimated it would have cleared near $554.72/MW-day without the cap. The DOM Zone is a net importer with PJM’s highest projected load growth (IRP).
The Texas comparison
Texas moved on both halves. On supply, the Texas Energy Fund writes 20-year loans at a fixed 3%; PUCT lists nine signed gas loans totaling 5,446 MW and $4.1 billion. On demand, SB 6 sets a 75 MW threshold for large-load interconnection standards, requires those customers to disclose their on-site backup generation, lets ERCOT direct them to run that backup or curtail in an emergency, and gives transmission-voltage loads a curtailment protocol. On weather, 16 TAC §25.55 makes winter preparedness a compliance obligation for ERCOT generators and transmission providers.
The structures are not equivalent. Texas has no capacity market, so its 0.02 and 0.65 cent results run mostly through energy and transmission charges. What it does have is a state-funded supply program and a hard curtailment obligation, which put cost and risk somewhere other than the residential volumetric rate.
Consumer and investor views
For consumers: watch the 25,000 MW, not the 39 GW. Dominion’s second-quarter deck showed 12.0 GW under executed electric service agreements in July 2026, inside 53.8 GW of total contracted capacity that counts engineering and construction letters, which reimburse costs if a customer walks but are not signed agreements.
For investors: GS-5 is a rate case in a box. Fourteen years, an 85% wires floor, a 60% generation floor and $1.5 million per MW of collateral convert forecast load into something nearer contracted revenue. The risk moves to execution: 8.9 GW of gas needing a VCEA exception, SMRs that do not start until 2042, and a PJM position that is short today.
Caveats and the other side
- Data centers do bring revenue. ESIG’s 0.88 cent headroom result is a rate cut, not a wash. A 75% load factor customer spreads fixed costs over more kilowatt-hours and is a good customer on that basis.
- Minimum bills shift risk back to the load, not all of it. An 80% floor removed about half the worst case in the study, not all. Its authors also note that minimum bills can weaken a customer’s incentive to cut demand at peak. Their alternative, “and” pricing, produced the largest rate benefits for existing customers in the modeling, but FERC has historically not supported it.
- The IRP is a plan, not a rate order, and its bill figures are nominal. No number in Table 3-1 is an approved rate, and the table carries a 2% annual escalator. This year’s update will not be litigated to a final order, and a full trial on it is set for fall 2027 (Virginia Mercury).
- The study has stated limits. It models one load at a time, assumes transmission-level interconnection, excludes distribution costs, and does not estimate economic-development benefits or the cumulative effect of many loads. Its authors call the results illustrative, not forecasts, and the task force was diverse, not a consensus.
Stu’s Take
| Stu’s Take (ENB opinion)
Here is the number I keep coming back to. Dominion says 25,000 MW of large-load requests are on the books and 12,000 MW are under contract. That is two-to-one between what was asked for and what was signed, and we are being asked to bless a 39.2 GW build and a $183.4 billion plan against it. The Brattle/ESIG work is the most useful thing published on this all year because it refuses the easy answer. 0.88 cents down with headroom. 0.44 cents up without. 1.35 to 2.53 cents in PJM when the region grows, against 0.65 in ERCOT and 0.29 in MISO. The rate is a function of the rules, and the rules are a choice. That choice is where Texas comes in. We weatherized the fleet under 16 TAC §25.55. We told 75 MW loads to show their backup and be ready to curtail. We put $4.1 billion of state money behind 5,446 MW of dispatchable gas at 3% for 20 years. Virginia’s answer is a 14-year contract with an 85% wires floor and a 60% generation floor and $1.5 million a megawatt of collateral. I will take that protection. But it is written by the utility, priced into the utility’s forecast, in a state where the regulators’ own method nearly doubles the projection. California, Virginia and New York keep moving slower on supply and faster on mandates. Texas took the reliability hit and spent five years building the answer: gas as the backbone, weatherization as a rule, a fund that pays for steel in the ground. Dominion is honest that it needs 8.9 GW of new gas. The fight in Richmond is not whether to build it. It is who signs for it.
|
Check out the World’s Greatest Podcast Show Notes at EnergyNewsBeat.co or EnergyNewsBeat.com. And subscribe to: The Energy News Beat Substack.
Appendix A. Sources
- Dominion Energy, 2026 Integrated Resource Plan Update, filed Oct. 15, 2026 in Virginia SCC Case No. PUR-2026-00163 (PDF). Accessed Oct. 28, 2026.
- Virginia State Corporation Commission, Final Order, Case No. PUR-2025-00058 (Nov. 25, 2025), Dominion 2025 biennial review. Accessed Oct. 28, 2026.
- Virginia SCC news release, SCC rules in DEV biennial review case (Nov. 2025). Accessed Oct. 28, 2026.
- Energy Systems Integration Group and The Brattle Group, Impacts of Large Loads on Electricity Rates: A Quantitative Assessment (October 2026). Accessed Oct. 28, 2026.
- ESIG, online appendix to Impacts of Large Loads on Electricity Rates (October 2026). Accessed Oct. 28, 2026.
- ESIG report landing page, rate impacts of large loads. Accessed Oct. 28, 2026.
- American Public Power Association, Public Power, Report quantifies how large loads affect electricity rates in four regions (Paul Ciampoli, Oct. 27, 2026). Accessed Oct. 28, 2026.
- WTVR CBS 6 (Taylor Locke), Data center demand surges; what will Dominion do if those projects fall through? (Oct. 27, 2026). Accessed Oct. 28, 2026.
- WTVR CBS 6, Dominion bill increase projection (Oct. 26, 2026). Accessed Oct. 28, 2026.
- Virginia Mercury (Shannon Heckt), Dominion’s energy roadmap keeps fossil fuels in the mix, expands solar (Oct. 19, 2026). Accessed Oct. 28, 2026.
- The Center Square, Virginia, Dominion IRP bill projection report (Oct. 2026). Accessed Oct. 28, 2026.
- Energy News Beat, Who Pays for the Wires? Data Centers, Distant Power and the Transmission Bill on Your Meter. Accessed Oct. 28, 2026.
- Dominion Energy, 2Q 2026 earnings call slides (July 31, 2026), data center contracted capacity. Accessed Oct. 28, 2026.
- Public Utility Commission of Texas, Texas Energy Fund program page, In-ERCOT Generation Loan Program table. Accessed Oct. 28, 2026.
- Texas Senate Bill 6, 89th Legislature, enrolled text. Accessed Oct. 28, 2026.
- Public Utility Commission of Texas, 16 TAC §25.55, Weather Emergency Preparedness (PDF). Accessed Oct. 28, 2026.
- PJM Interconnection, 2028/2029 Base Residual Auction Results Report (July 14, 2026). Accessed Oct. 28, 2026.
Primary documents used for the numbers in this article: the Dominion 2026 IRP (Tables 3-1, 5-5 and 5-6, and the load forecast discussion in Appendix 4A), the SCC’s Nov. 25, 2025 final order (minimum demand charges, collateral, contract term), and the ESIG/Brattle report (Table 3, Executive Summary, and the jurisdictional discussion on pages 21-27). The APPA summary of the ESIG report was opened and its figures agree with the report itself; where the two differ in emphasis we used the report.
Related ENB reading: Who Pays for the Wires? Data Centers, Distant Power and the Transmission Bill on Your Meter.
Appendix B. Key excerpts
IRP, on the preferred plan: “This plan would require the Company to seek the reliability exception outlined in the VCEA in order to preserve existing generation and include an additional 8.9 GW of additional gas-fired assets to address future energy and system reliability needs.” (IRP, p. 58)
IRP, on gas: “To meet the energy and capacity needs associated with the load forecast, and in the absence of a commercially viable carbon-free, dispatchable generation alternative, natural gas generation will remain a critical component of the Company’s strategy to reliably meet generation demand.” (IRP)
IRP, on large-load requests: “As of February 2026, approximately 25,000 megawatts of large-load delivery point requests have been received with projected connection dates through December 31, 2031. Those requests continue to grow.” (IRP, Appendix 4A)
IRP, on the forecast: “Importantly, however, the 2025 forecast was not based on contracts.” (IRP, Appendix 4A)
SCC Final Order, on minimum demand: “The Commission approves Dominion’s proposed minimum demand charges: (1) minimum distribution charge of 85% contracted demand; (2) minimum transmission charge of 85% contracted demand; and (3) minimum generation charge of 60% contracted demand.” (SCC order, p. 25)
SCC Final Order, on collateral: “The Commission approves the Company’s proposed collateral requirement terms, including: (1) $1.5 million/MW; (2) a reduction up to 70% based on the customer’s established credit; (3) provisions for third-party guarantees and letters of credit; and (4) releasing 1/14th of the collateral requirement each year throughout the contract term.” (SCC order)
ESIG/Brattle, on the central finding: “The analysis shows that adding a large load does not have a predetermined effect on electricity rates for existing customers. The outcome depends on the balance between the additional revenue collected from the new customer and the incremental costs of serving it.” (ESIG, p. 27)
ESIG/Brattle, on PJM: “Given PJM’s market construct, it is difficult to protect existing customers through measures such as direct cost assignment or minimum bill requirements.” (ESIG, p. 24)
ESIG/Brattle, on the collar: “If the price collar remains in effect, the price effect of an incremental large load would be $0 because the collar is already binding.” (ESIG, p. 24)
Long Lam, Brattle, lead author, as quoted by APPA: “The rate impact of a large load isn’t predetermined. In our modeling, the same 500-megawatt customer lowered rates for existing customers when the system had headroom and raised rates when it didn’t. Forecast error and tariff design also determined how large those impacts became.” (Public Power)
Natalie Northrup, Brattle, co-author, as quoted by APPA: “When we scaled load growth to the same 16.7% increase in peak demand across each market, the modeled impact rose to 0.29 cents per kilowatt-hour for the MISO utility, 0.65 cents for the ERCOT utility, and between 1.35 and 2.53 cents for the PJM utility.” (Public Power)
Appendix C. Data tables
C1. Dominion Energy Virginia residential bill projections, 1,000 kWh per month (as of Oct. 15, 2026 filing)
| Date | Company methodology | SCC-directed methodology | Source |
| Oct. 1, 2026 | $180.31 | $180.31 | IRP Table 3-1 |
| Year-end 2036 | $258.03 | $320.26 | IRP Table 3-1 |
| Year-end 2046 | $283.65 | $458.22 | IRP Table 3-1 |
| Increase, 2026 to 2046 | +$103.34 (+57.3%) | +$277.91 (+154.1%) | ENB calculation on IRP |
C2. Company Preferred Plan, 2026-2046 (as of Oct. 15, 2026 filing)
| Metric | Value | Source |
| Total new capacity built | 39.2 GW (39,244 MW) | IRP Table 5-5, 5-6 |
| Total portfolio cost (NPV, 2026 dollars) | $183.4 billion | IRP Table 5-2, 5-5 |
| Construction CAPEX (2026 dollars) | $91.5 billion | IRP Table 5-5 |
| 2046 CO2 emissions | 47.0 million tons | IRP Table 5-5 |
| Solar / wind / storage | 21,229 MW / 3,479 MW / 3,525 MW | IRP Table 5-6 |
| Natural gas / nuclear (SMR) | 8,965 MW / 2,046 MW | IRP Table 5-6 |
| Additional gas cited in narrative | 8.9 GW, requires a VCEA reliability exception; the same 8,965 MW in Table 5-6, not additional | IRP p. 58 |
C3. IRP portfolios, total portfolio cost and construction CAPEX (as of Oct. 15, 2026 filing)
| Portfolio (IRP column) | New build | Total portfolio cost | Construction CAPEX |
| Company Preferred Plan | 39.2 GW | $183.4B | $91.5B |
| Forced Retirements by 2045 | 71.1 GW | $206.9B | $224.0B |
| Forced Full Storage | 48.0 GW | $189.8B | $112.5B |
| VA Staff Directed: Without Targets | 36.2 GW | $144.5B | $61.3B |
| VA Staff Directed: Data Center Load Growth Restriction | 33.3 GW | $159.0B | $66.6B |
These are the IRP portfolio runs printed in Table 5-3, p. 56, not load forecasts. Total portfolio cost is an NPV in 2026 dollars (Table 5-2). Source: IRP, Tables 5-2 and 5-3.
C3b. Load forecast sensitivities, total portfolio cost (as of Oct. 15, 2026 filing)
| Sensitivity (Figures 5-5, 5-6) | New build | Total portfolio cost | Change vs. plan |
| Company Preferred Plan | 39.2 GW | $183.4B | – |
| High Load Forecast | 44.2 GW | $217.0B | +$33.6B |
| Low Load Forecast | 36.4 GW | $155.4B | -$28.0B |
| Company Load Forecast | 39.4 GW | $178.0B | -$5.4B |
New build is the total MW addition for the same named case in Figure 5-5, p. 62. Total portfolio cost and the change column are Figure 5-6, p. 63, which print no CAPEX column. These are a different set of runs from the portfolios in C3 and are not additive with them. The 44.2 GW High Load case here is not the 71.1 GW Forced Retirements case above. Source: IRP, Figures 5-5 and 5-6.
C4. Large-load demand and contract terms (as of the dates shown)
| Item | Value | As of | Source |
| Large-load delivery point requests | ~25,000 MW, connections through Dec. 31, 2031 | Feb. 2026 | IRP |
| Data center capacity under contract in VA retail territory | ~12,000 MW | Oct. 2026 | WTVR |
| Data center contracted capacity, total (SELOA + CLOA + ESA) | ~53.8 GW | July 2026 | 2Q deck |
| of which under executed Electric Service Agreements | ~12.0 GW | July 2026 | 2Q deck |
| GS-5 eligibility | >=25 MW contracted or measured demand; >=75% load factor | Effective Jan. 1, 2027 | IRP; SCC |
| Contract term | 14 years | Nov. 25, 2025 order | SCC |
| Minimum distribution demand charge | 85% of contracted demand | Nov. 25, 2025 order | SCC |
| Minimum transmission demand charge | 85% of contracted demand | Nov. 25, 2025 order | SCC |
| Minimum generation demand charge | 60% of contracted demand | Nov. 25, 2025 order | SCC |
| Collateral | $1.5 million per MW, reducible up to 70% on credit, released 1/14th per year | Nov. 25, 2025 order | SCC |
C5. Modeled rate impact of a 500 MW load, cents/kWh (ESIG/Brattle, October 2026)
| Jurisdiction | One 500 MW load, no headroom | Large-load growth = +16.7% of regional peak |
| Southeast utility | 0.44 | 0.44 |
| MISO utility | 0.22 | 0.29 |
| PJM utility | 0.07 | 1.35 – 2.53 |
| ERCOT utility | 0.02 | 0.65 |
Modeled average all-in rate impact on existing customers over a 15-year contract, before any tariff provisions. Source: ESIG, Table 3, p. 22, and Executive Summary p. xii. No headroom in any case.
C6. Selected ESIG/Brattle sensitivity results, Southeast utility, cents/kWh
| Case | Rate impact | Change from base |
| Sufficient headroom | -0.88 | about -6% over 15 years |
| No headroom, load as planned | 0.44 | about +3% |
| Load four years late | 0.73 | +0.29 |
| Load at half contracted size | 0.93 | +0.49 |
| Load departs five years early | 0.87 | +0.43 |
| All three adverse outcomes | 1.32 | 3x base case |
| Worst case, with a termination payment | 1.32 – 0.35 = 0.97 | -27% vs. worst case |
| Worst case, with an 80% minimum billing demand | 1.32 – 0.69 = 0.63 | -52% vs. worst case |
Source: ESIG, Executive Summary p. ix and report body p. 15. The headroom case is relative to rates with no large load; the forecast-error cases are relative to the base case with no headroom. The report states the tariff results as reductions from the combined worst case, which is why the last two rows subtract rather than replace.
C7. Texas comparison figures (as of the dates shown)
| Item | Value | As of | Source |
| SB 6 large-load threshold | 75 MW interconnection standards; backup disclosure, not a backup mandate | 2025 enrolled text | SB 6 |
| Texas Energy Fund loan term and rate | 20 years, fixed 3% | Program page | PUCT |
| TEF in-ERCOT gas loans signed | 9 projects, 5,446 MW, $4.1 billion | Oct. 7, 2026 (latest entry) | PUCT |
| TEF program cap | 10,000 MW of new generation | Program page | PUCT |
| Loans as share of project cost | may not exceed 60% | Program page | PUCT |
| Weatherization rule | 16 TAC §25.55, ERCOT generators and TSPs | Current rule | PUCT |
Appendix D. Background, methodology and open items
Background
- Dominion Energy Virginia serves about 2.8 million electric customers across roughly 30,000 square miles, per the 2026 IRP. This year’s filing, Case No. PUR-2026-00163, is a comprehensive IRP in North Carolina and an interim update in Virginia.
- The Virginia General Assembly’s Joint Legislative Audit and Review Commission studied data centers in 2024 and concluded they had been paying their full cost of electric service, while flagging that further reforms might be needed. The SCC’s November 2025 order in PUR-2025-00058 is the first major reform package to follow that study.
- ESIG is a nonprofit that convenes technical experts on grid transformation. Its Large Loads Rate Impacts Task Force produced this report; the authors are Long Lam, Natalie Northrup, Ryan Hledik and Oliver Grocott of The Brattle Group and Trieu Mai and Debra Lew of ESIG. The report carries an explicit disclaimer that a diverse task force does not speak with one voice.
Methodology
- Bill percentages: $283.65 / $180.31 – 1 = 57.3%; $458.22 / $180.31 – 1 = 154.1%. The IRP prints the dollar change of $103.34 and $277.91 but not the percentages; these are ENB calculations.
- $183.4 billion is Total Portfolio Cost, a net present value in 2026 dollars, per footnotes 17 and 18 of the IRP and the title of Table 5-2, which reads ‘NPV results for the 2026 IRP Portfolios.’ It is not an undiscounted capital budget. $91.5 billion is Construction CAPEX, a separate column. They are not additive and the smaller is not a subset of the larger in the table’s presentation. Some coverage describes $183 billion as ‘including’ $91 billion; we avoided that phrasing.
- Collateral arithmetic: $1.5 million/MW x 500 MW = $750 million. The order allows up to a 70% reduction for established credit, which would put the figure at $225 million. We cite the gross figure and note the reduction.
- Nominal versus real: the IRP escalates distribution bill components at 2% a year (p. 15; Appendix 3A, ‘Inclusive of an annual inflation rate of 2%’). Deflating $283.65 in 2046 at 2% for 20 years gives $190.89, about $191 in 2026 dollars, or roughly $11 above $180.31. The company-method compound annual growth rate, 2026 to 2046, is ($283.65 / $180.31)^(1/20) – 1 = 2.26%, against a 2% escalator.
- Generation floor arithmetic: 60% of 500 MW = 300 MW of minimum billing demand, independent of actual consumption.
- ESIG figures are the report’s own Table 3 and Executive Summary values. The APPA summary article reports the same figures (0.44, 0.22, 0.07, 0.02; 0.29, 0.65, 1.35-2.53) and attributes the regional range to Northrup. We used the report and treat the APPA article as confirmation.
- The 1.35-2.53 cent PJM range is for the proportional regional growth case with no headroom, not for a single Virginia load. The report models two PJM price cases; case 1 sets base prices at 2023 levels, case 2 at the collar. Only case 1 produces 2.53; case 2 produces 1.35.
- Texas Energy Fund figures are the PUCT’s own program table, totaled: 122 + 456 + 721 + 460 + 1,350 + 455 + 570 + 860 + 452 = 5,446 MW; $4,104.3 million.
Open items and unresolved figures
- The IRP does not break out the 85%/60% minimum demand percentages. Those come from the SCC’s Nov. 25, 2025 final order in PUR-2025-00058. Dominion’s statement to CBS 6 matches the order.
- The IRP prints no single figure for contracted data center capacity. The ~12,000 MW is Dominion’s statement to WTVR. The 2Q 2026 deck’s 12.0 GW of executed ESAs is consistent but a different date.
- WTVR describes $183 billion as including ‘more than $91 billion in construction.’ The IRP presents them as separate columns; we flag the difference.
- Dominion’s 2026 IRP is an interim update in Virginia and will not be litigated to a final order; a full trial is scheduled for fall 2027 per Virginia Mercury. Figures could change in the comprehensive filing.
- The $325/MW-day PJM price collar is a settlement between PJM and the Office of Pennsylvania Governor Josh Shapiro covering the 2026/27 through 2028/29 Base Residual Auctions, per ESIG footnote 43 and IRP footnote 6. It is a negotiated policy choice, not a generic RTO market rule, and we say so in the body.
- Open item for Stu: the headline uses the company method (57.3%, nominal). The SCC-directed method gives 154.1%. Both sit in the same table and neither is a rate order; 57.3% is the optimistic end and 154.1% the pessimistic end. If the desk wants 154.1% in the headline or subhead, the lede and cover art both need to change.
- Not verified: any figure for what Dominion has actually spent to date on data-center-driven infrastructure, or how much of the 25,000 MW has been withdrawn. Neither document provides it.