By Wolf Richter for WOLF STREET.
Mortgage balances outstanding ticked up by 0.9% in Q4 from Q3, to a record of $12.3 trillion. Year-over-year, the increase was only 2.8%, according to data from the New York Fed’s Household Debt and Credit Report.
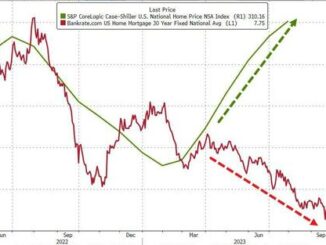
This small increase in mortgage balances is the result of a strange mix: Purchases of existing homes have plunged by one-third, and mortgage origination volume has collapsed, with existing home prices still sky high; but new house sales have held up, as prices have dropped 17%. And homeowners with these infamous 3% mortgages are not selling, and they’re not buying, and so they’re not paying off their 3% mortgages, and they’re not getting bigger new mortgages.
But HELOC balances resurge from rock-bottom.
HELOC balances jumped by 3.2% in Q4 from Q3, by 7.1% year-over-year, the 7th consecutive quarter of increases, and by 13% from two years ago. So HELOCs (home equity line of credit) at $360 billion, are still historically low, but the high mortgage rates have changed the trend.
HELOCs – a way for homeowners to extract cash from their home equity – are now powered by the much higher mortgage rates that make cash-out refis very unattractive because homeowners would swap a 3% rate for a 7% rate on the entire amount of the mortgage. And refi volume has collapsed. With a HELOC, they can extract cash and pay only 7% on the much smaller HELOC amount while continuing to pay 3% on the much larger mortgage. So HELOCs are coming back.
In dollar terms, HELOC balances increased by $24 billion in 2023, and most of this $24 billion was earmarked for consumption, from home improvements to vacations. They represent another, if light, tailwind for our tireless drunken sailors.
The aggregate burden of mortgage debt.
Homes are lot more expensive today than they were 20 years ago, but the effective interest rates on mortgages outstanding are a lot lower than they were, and consumers make a lot more money too, they’ve gotten the biggest pay increases in 40 years, even as mortgage debt barely increased, and there are a lot of renters, and they don’t have any mortgage debts, including the many “renters of choice,” who have relatively high incomes and live in higher-end rentals.
So in aggregate, the entire $12.3 trillion in mortgage debt as a percent of total disposable income is roughly where it had been for years, and even in 2003.
Disposable income is income from all sources except capital gains, minus taxes and social insurance payments. This is the cash that consumers have left to spend on housing, food, cars, debt payments, etc.
Delinquencies aren’t even normalizing yet.
Transitioning into delinquency: Mortgage balances that were newly delinquent by 30 days or more at the end of Q4 ticked up to 3.0% of total balances — still lower than any time before the pandemic and down from the 3.5% range in 2017 through 2019 (red line in the chart below).
HELOC balances that were delinquent by 30 days or more ticked up to 2.0% — at the low end of the range in 2017 through 2019 (blue line).
Note how mortgage delinquencies are forming a “frying pan” pattern, as I call it (though here “wok pattern” might be better?) as they come out of the lows from the free-money and forbearance era of the pandemic when delinquent mortgages were moved into forbearance and then didn’t count as delinquent.
This shows that mortgage delinquencies haven’t even normalized back to the Good Times levels yet.
Serious delinquency: Mortgage balances that were 90 days or more delinquent by the end of Q4 edged up to 0.57%, about half the rate before the pandemic (red line in the chart below).
HELOC balances that were 90 days or more delinquent dipped to 0.62%, the lowest since before the Housing Bust (blue line).
Foreclosures are also in a frying-pan pattern.
The number of consumers with foreclosures has edged up a little after the deep hole during the forbearance era when foreclosures essentially came to a halt and by 2021 had dropped to near zero.
In Q4, there were 40,200 consumers with foreclosures, compared to 65,000 to 90,000 in the years 2017 through 2019. Foreclosures are lower than anytime before the pandemic. They’re not even normalizing yet.
But alas, we can already see some moronic publication come up with a clickbait-go-viral-title about foreclosures “exploding by 400%,” OMG, from Q2 2021. And we’ll get a good laugh out of it and never ever go back to that publication?
When will it get messy?
Homeowners who purchased their homes more than two years ago are in excellent shape on their mortgages – and that’s the vast majority of homeowners – because home prices have surged so much in the years through mid-2022.
If this type of homeowner cannot make the mortgage payment any more, because they lost their job or had a medical emergency, or whatever, they can sell the home, pay off the mortgage with the proceeds, and have some cash left over to put in the bank.
So even if unemployment begins to surge, and over a year’s time a million homeowners cannot make their payment anymore, they can put their homes on the market – the inventory will be welcome – and if they price it right, they can sell it and still pay off their mortgage with it, and go on.
The problem arises when home prices plunge to multi-year lows, and suddenly a larger portion of homeowners are underwater. If lots of people lose their jobs and can no longer make the mortgage payments, then it gets a little messy. The result will be that homes will become more plentiful on the market, and more affordable to buy, which would be highly welcome by lots of younger people.
But that’s not on the horizon. What’s already here and stretches into the horizon are higher-than-we’re-used-to inflation, and higher-than-we’re-used-to mortgage rates, along with the Fed’s QT, the opposite conditions that prevailed when home prices spiked.
Subprime doesn’t mean “low income.” It means “bad credit” – and some is high income. And subprime auto loans are coming home to roost. Read… Auto Loan Balances, Subprime, Delinquencies, and Income: Who Are those Drunken Sailors?