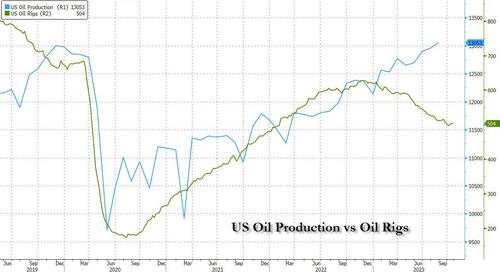
- US crude oil production hit a record in August with 13.05 million barrels per day, even as the number of rotary US oil rigs declined.
- The Permian basin has been the focal point for US crude supply growth, with improvements in multi-well pad technology and increased lateral well lengths.
- Goldman Sachs highlights the continued capital discipline of US producers, emphasizing moderate growth targets and reinvestment rates.
With core OPEC+ cartel members Russia and Saudi Arabia doing everything in their power to throttle oil output and push the price of oil higher, the US is again emerging as not only a thorn in OPEC’s side but as the marginal producer of world oil. According to EIA data, US crude oil production hit an all-time high in August, as production surpassed pre-covid levels.
US field production of crude oil reached 404.6 million barrels during the month of August, new EIA data showed, for an average of 13.05 million barrels per day, breaking the previous record US drillers set in July of 401.73 million barrels. Compared to this time last year, U.S. production is up by a total of 33 million barrels for the month. Remarkably production hit all time highs even as the number of rotary US oil rigs has slumped in the past year. How is this possible? We answer that question below.
Increases in production were seen in PADDs 1, 2, 3, and 4, with the largest percentage increase in production seen in PADD 4, which comprises Colorado, Idaho, Montana, Utah, and Wyoming. The largest actual increase was seen in PADD 2, which includes North Dakota, Illinois, and Kentucky, among other states.
Crude production in Texas in August – home to a large portion of the Permian Basin and where Exxon will soon be undisputed energy king after its merger with Pioneer closes – rose from 173.775 million barrels to 174.562 million barrels.
Despite the record-breaking production levels seen in August, inventories of crude oil in the United States are estimated to be within 3 million barrels of where it began the year.
The new record in crude production in the United States comes shortly after U.S. supermajor ExxonMobil spent $60B on purchasing another Permian player, Pioneer Natural Resources, although most oil companies in the United States have chosen fiscal restraint resulting in a slow and steady increase in output versus the no holds barred investment strategies during previous boom cycles.
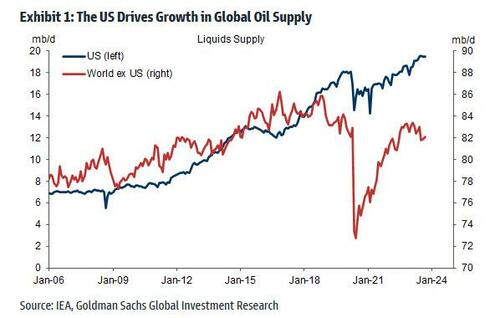
What is perhaps more remarkable is that in a recent report (available to pro subscribers) from Goldman commodity analyst Daan Dtruyven, the bank found that “the US has driven all the growth in global oil supply over the past decade and the past year, and the Permian basin has driven all growth in US crude supply since early 2020.”
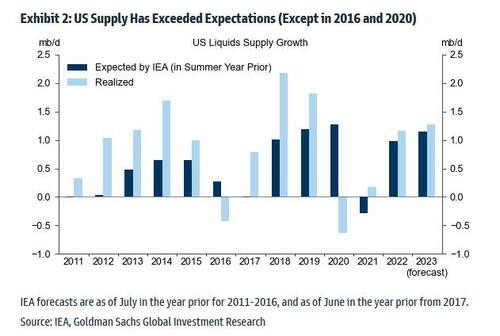
US supply has also grown faster than expected. According to Goldman, US liquids supply is on track to exceed IEA expectations for the 13th consecutive year, except for 2016 and 2020. That said, the 2022 and 2023 forecast errors will likely be smaller than before the pandemic, and US total liquids supply has been roughly flat since June.
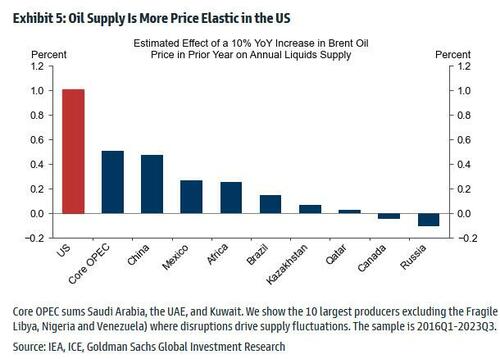
Furthermore, the US remains the key short-term marginal oil producer, where flexible short-cycle private producers sit high on the global cost curve.
So is the US falling in the overproduction trap that marked much of the 2010s and which led to the defaulting of dozens of junk debt-funded US energy producers, and sharply oil prices?
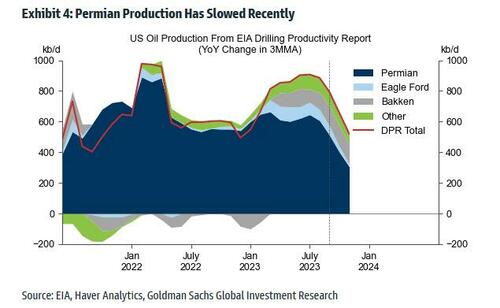
According to Goldman, the answer is no as crude output growth in the Permian has slowed from 1mb/d in 2019 to 0.5mb/d year-over-year in September given the drop in the rig count, and the stabilizing well productivity trend.
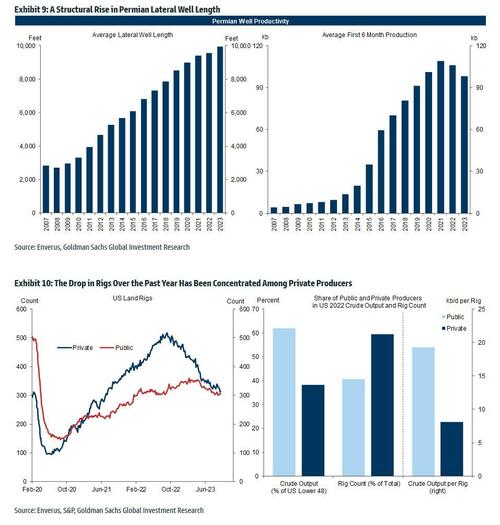
However, Permian output is still edging up because of rises in the number of drilled wells per rig and well length. In other words, the Permian new well output per rig is still trending higher because of:
- A rise in the number of drilled wells per rig given progress in multi-well pad technology
- A structural rise in the average lateral well length to 10,000 feet(Exhibit 9)
- A boost to output per rig through a composition effect arising from the larger drop in less productive private rigs (“high grading”). The output per rig in 2022 was nearly 2.5 times greater for public rigs than for private rigs since public firms account for over 60% of production, but under 40% of rigs (Exhibit 10).
This is important because the lack of well productivity growth (which reflects an offset between deteriorating rock quality and improving technology) suggest that Permian output growth will slow further. In fact, the emergence of the Permian as the world’s key oil market variable may explain why Exxon recently purchased Pioneer: the new supergiant will have every opportunity to turn oil output in the US on (or off) as only it sees fit.
Finally, a question that Wall Street would love answered: are US producers still capital disciplined?
Goldman’s answer, “yes, three pieces of evidence show that the US upstream sector remains capital disciplined.”
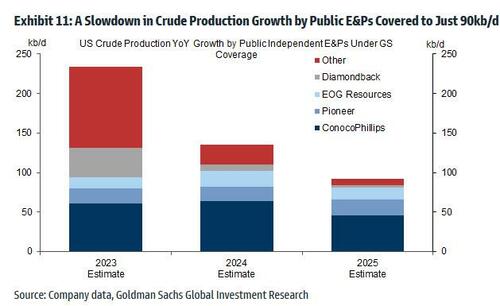
- First, US public independent firms are sticking to the moderate single digit growth targets they announced in 2020-2021. As Exhibit 11 shows, we expect crude production growth by the independent US E&Ps under GS coverage to slow from around 235kb/d (or 7%) in 2023 to 135kb/d (4%) in 2024, and just around 90kb/d (2.5%) in 2025. That companies continue to guide to slower growth despite the 2022H1 and the summer 2023 upswing in prices is the essence of capital discipline, and the main driver of the reduction in supply elasticity. These lower growth targets reflect investors’ scarring 2014-2020 experience when excessive growth depressed returns, and growing concerns about inventory quality.
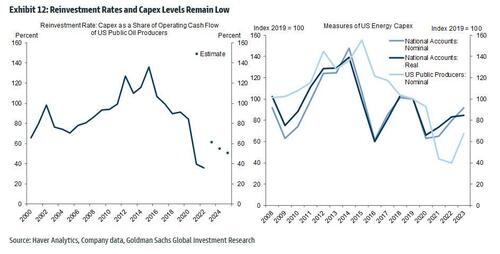
- Second, reinvestment rates—capex as a share of operating cash flow—of public producers remain in a 40-60% range, well below the historical average (Exhibit 12, left panel). The 2022-2023 pickup in capex reflects that the 2020-2021 levels were likely unsustainably low, and the boost to nominal capex measures from rapid cost inflation (Exhibit 12, right panel).
- Third, broader capital allocation strategies of public E&Ps remain focused on limiting leverage and returning cash to shareholders (see Appendix Exhibit 18). To illustrate further, equity (rather than debt) is now typically used to fund acquisitions (as for ExxonMobil-Pioneer).
ENB Top News
ENB
Energy Dashboard
ENB Podcast
ENB Substack

