Listings YoY: Orange County +66%, San Diego +55%, Fresno +48%, Sacramento +47%, Los Angeles +45%, Riverside-San Bernadino +43%, San Jose & Silicon Valley +39%; San Francisco metro +30%.
By Wolf Richter for WOLF STREET.
Los Angeles County: Active listings spiked by 45% year-over-year in June, to 14,692 homes for sale, the most for any June in the data from realtor.com going back to 2016, passing by even 2019 (dotted purple line).
In 2018 (brown double-line), the Fed was hiking rates, and the average 30-year fixed mortgage rate rose to 5% by November 2018. Home sales stalled and inventories piled up in the second half of 2018. And that inventory pileup continued into mid-2019 (dotted purple line). That’s the inventory level that 2025 just blew by. At the end of July 2019, with inflation substantially below target, the Fed cut its policy rates, and mortgage rates began to come down.
Is Oil & Gas Right for Your Portfolio?
But that’s not what happened this time around. In the fall of 2024, the Fed cut its policy rates by 100 basis points despite re-accelerating well-above-target inflation. In response, the bond market, worried about inflation and a lackadaisical Fed to fight this inflation, threw a hissy-fit and longer-term Treasury yields and mortgage rates surged by 100 basis points. Active listings have been going straight up so far this year:
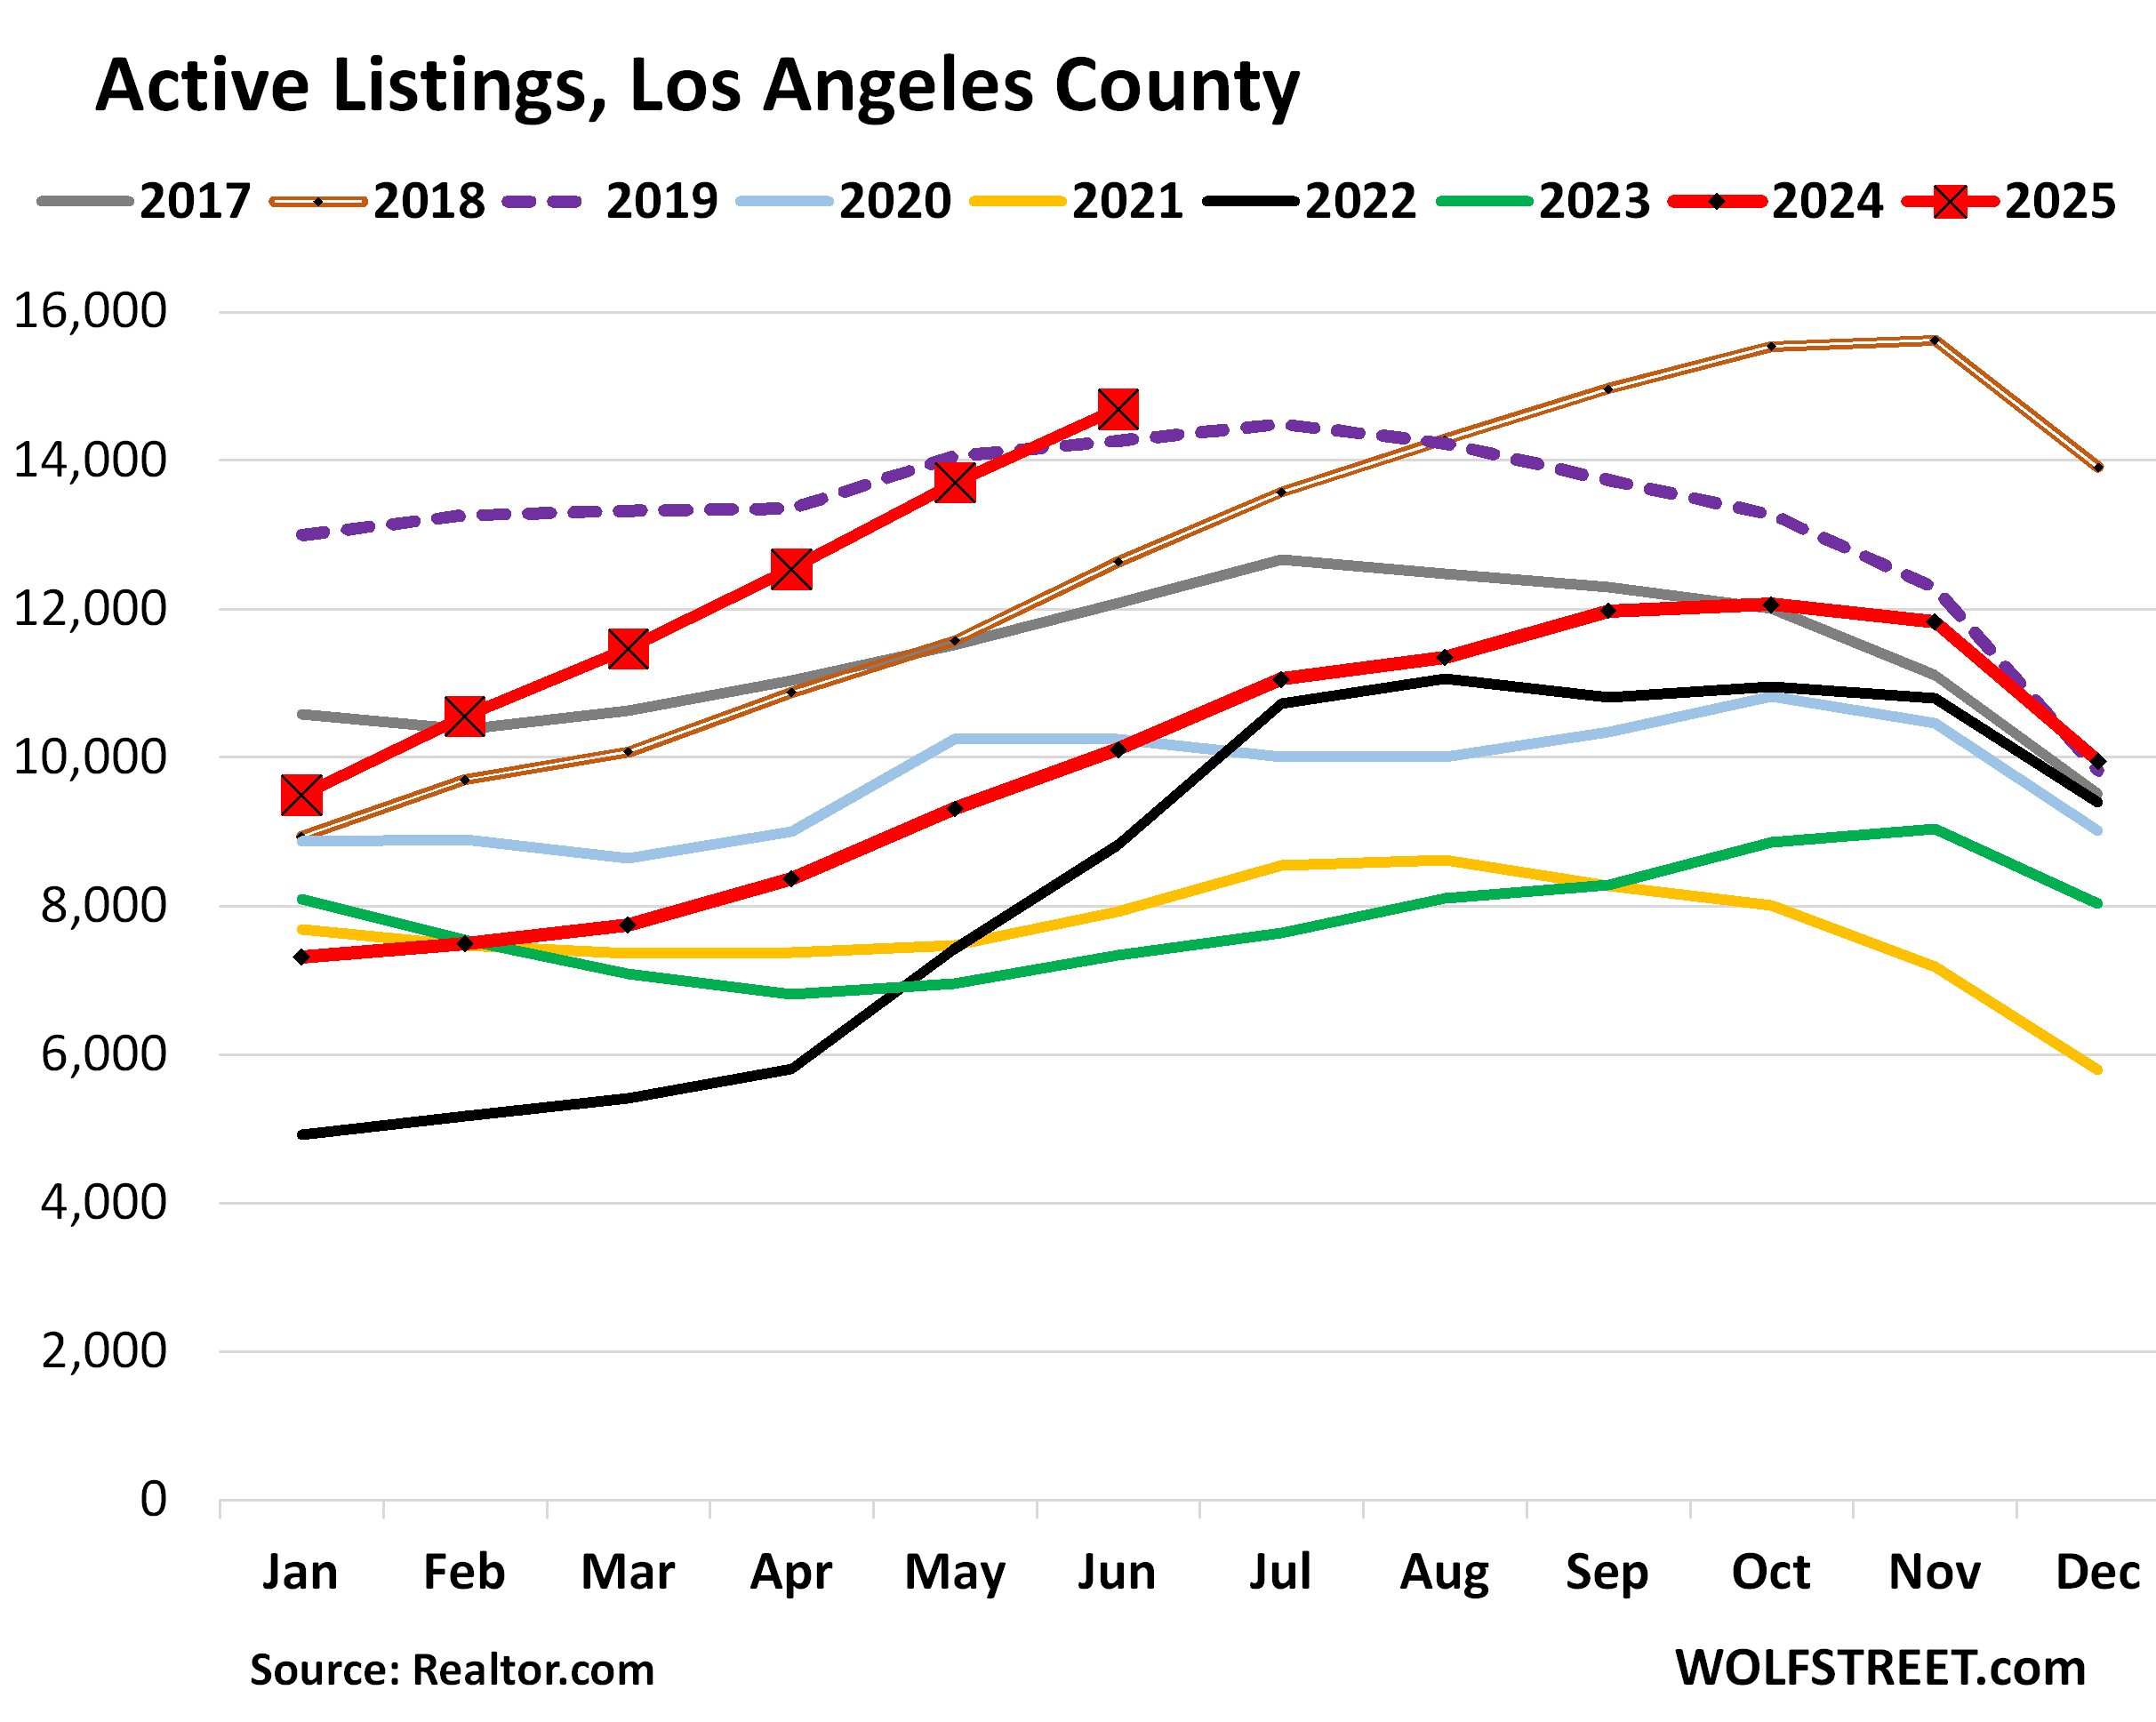
The median number of days that homes spent on the market in Los Angeles County before they were either pulled off the market (delisted) or sold rose to 47 days, matching June 2020, and both were the highest Junes in the data by realtor.com going back to 2016.
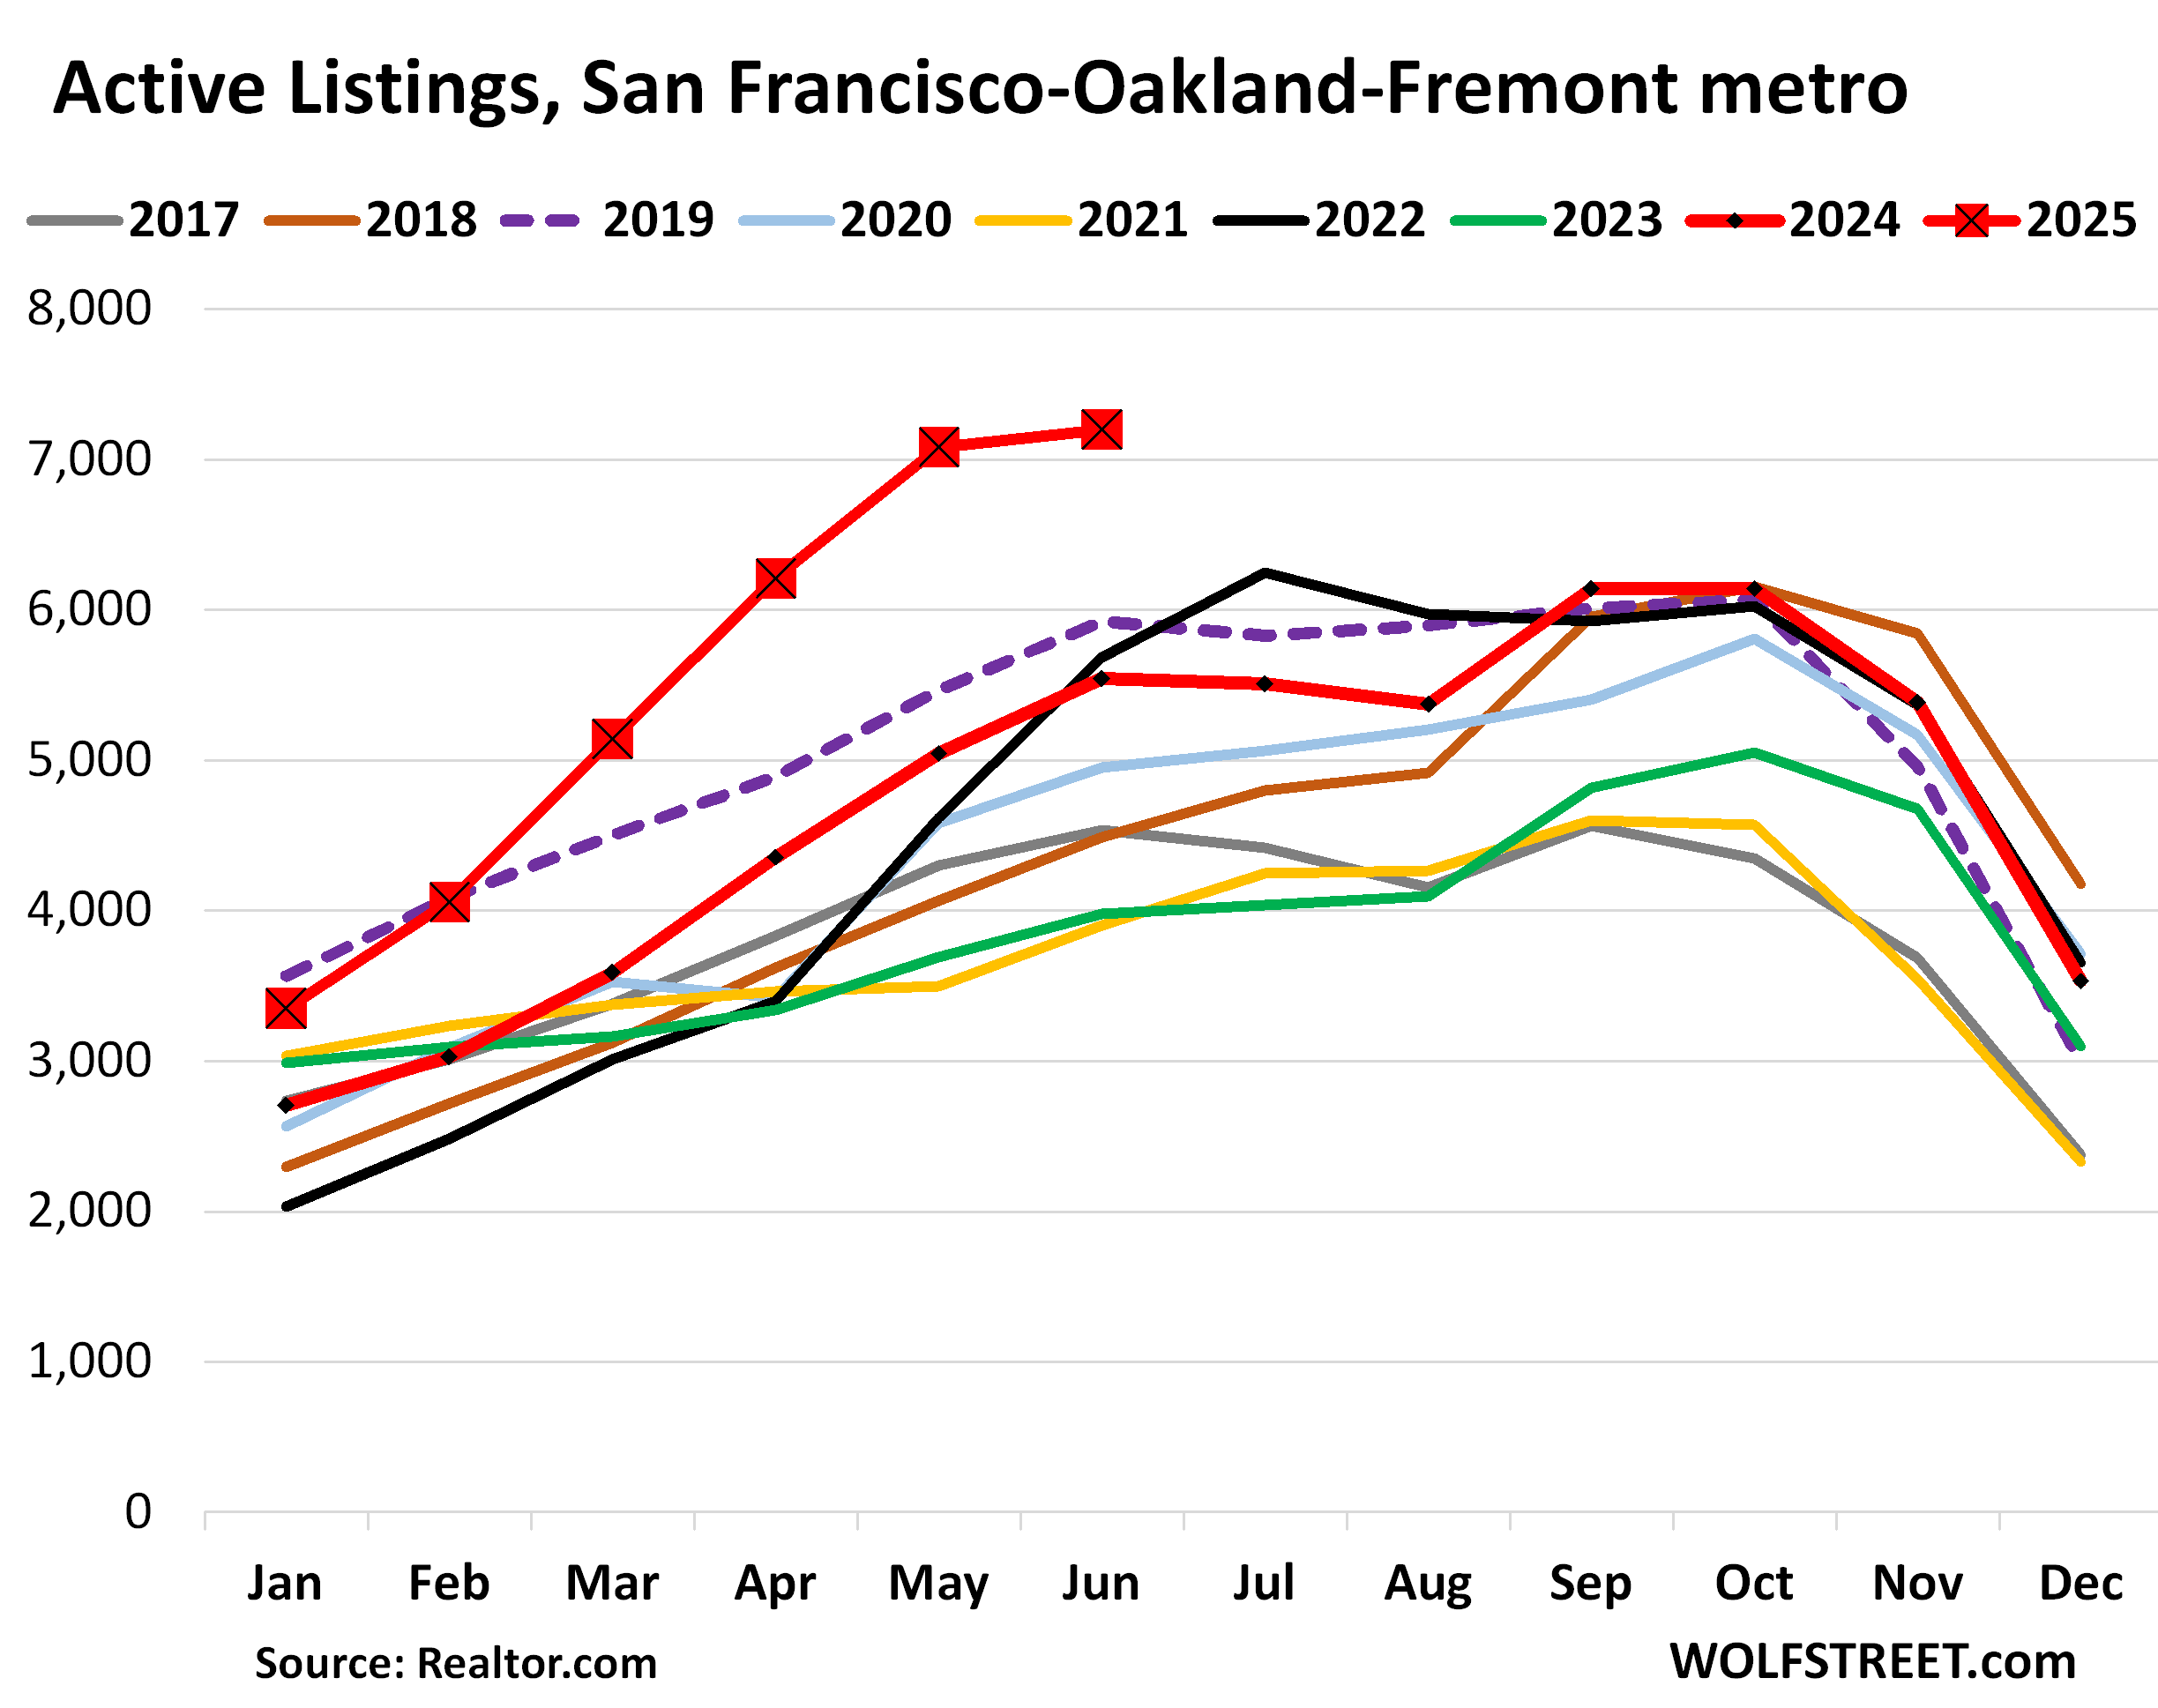
San Francisco-Oakland-Fremont metro: Active listings surged by 30% year-over-year in June, to 7,196 homes for sale, by far the most for any month in the data from realtor.com going back to 2016.
Compared to June 2019, the second highest June in the data (purple dotted line), active listings were up by 21%. Always astounding how a much-hyped “housing shortage” turns into an inventory pileup.
This metropolitan statistical area (MSA) includes the counties of San Francisco and San Mateo (northern portion of Silicon Valley), part of the East Bay, and part of the North Bay.
The median number of days that a home spent on the market in the San Francisco metro before it was either pulled off the market or sold jumped to 40 days, the highest by far for any June in the data from realtor.com going back to 2016, up from 31 days a year ago.
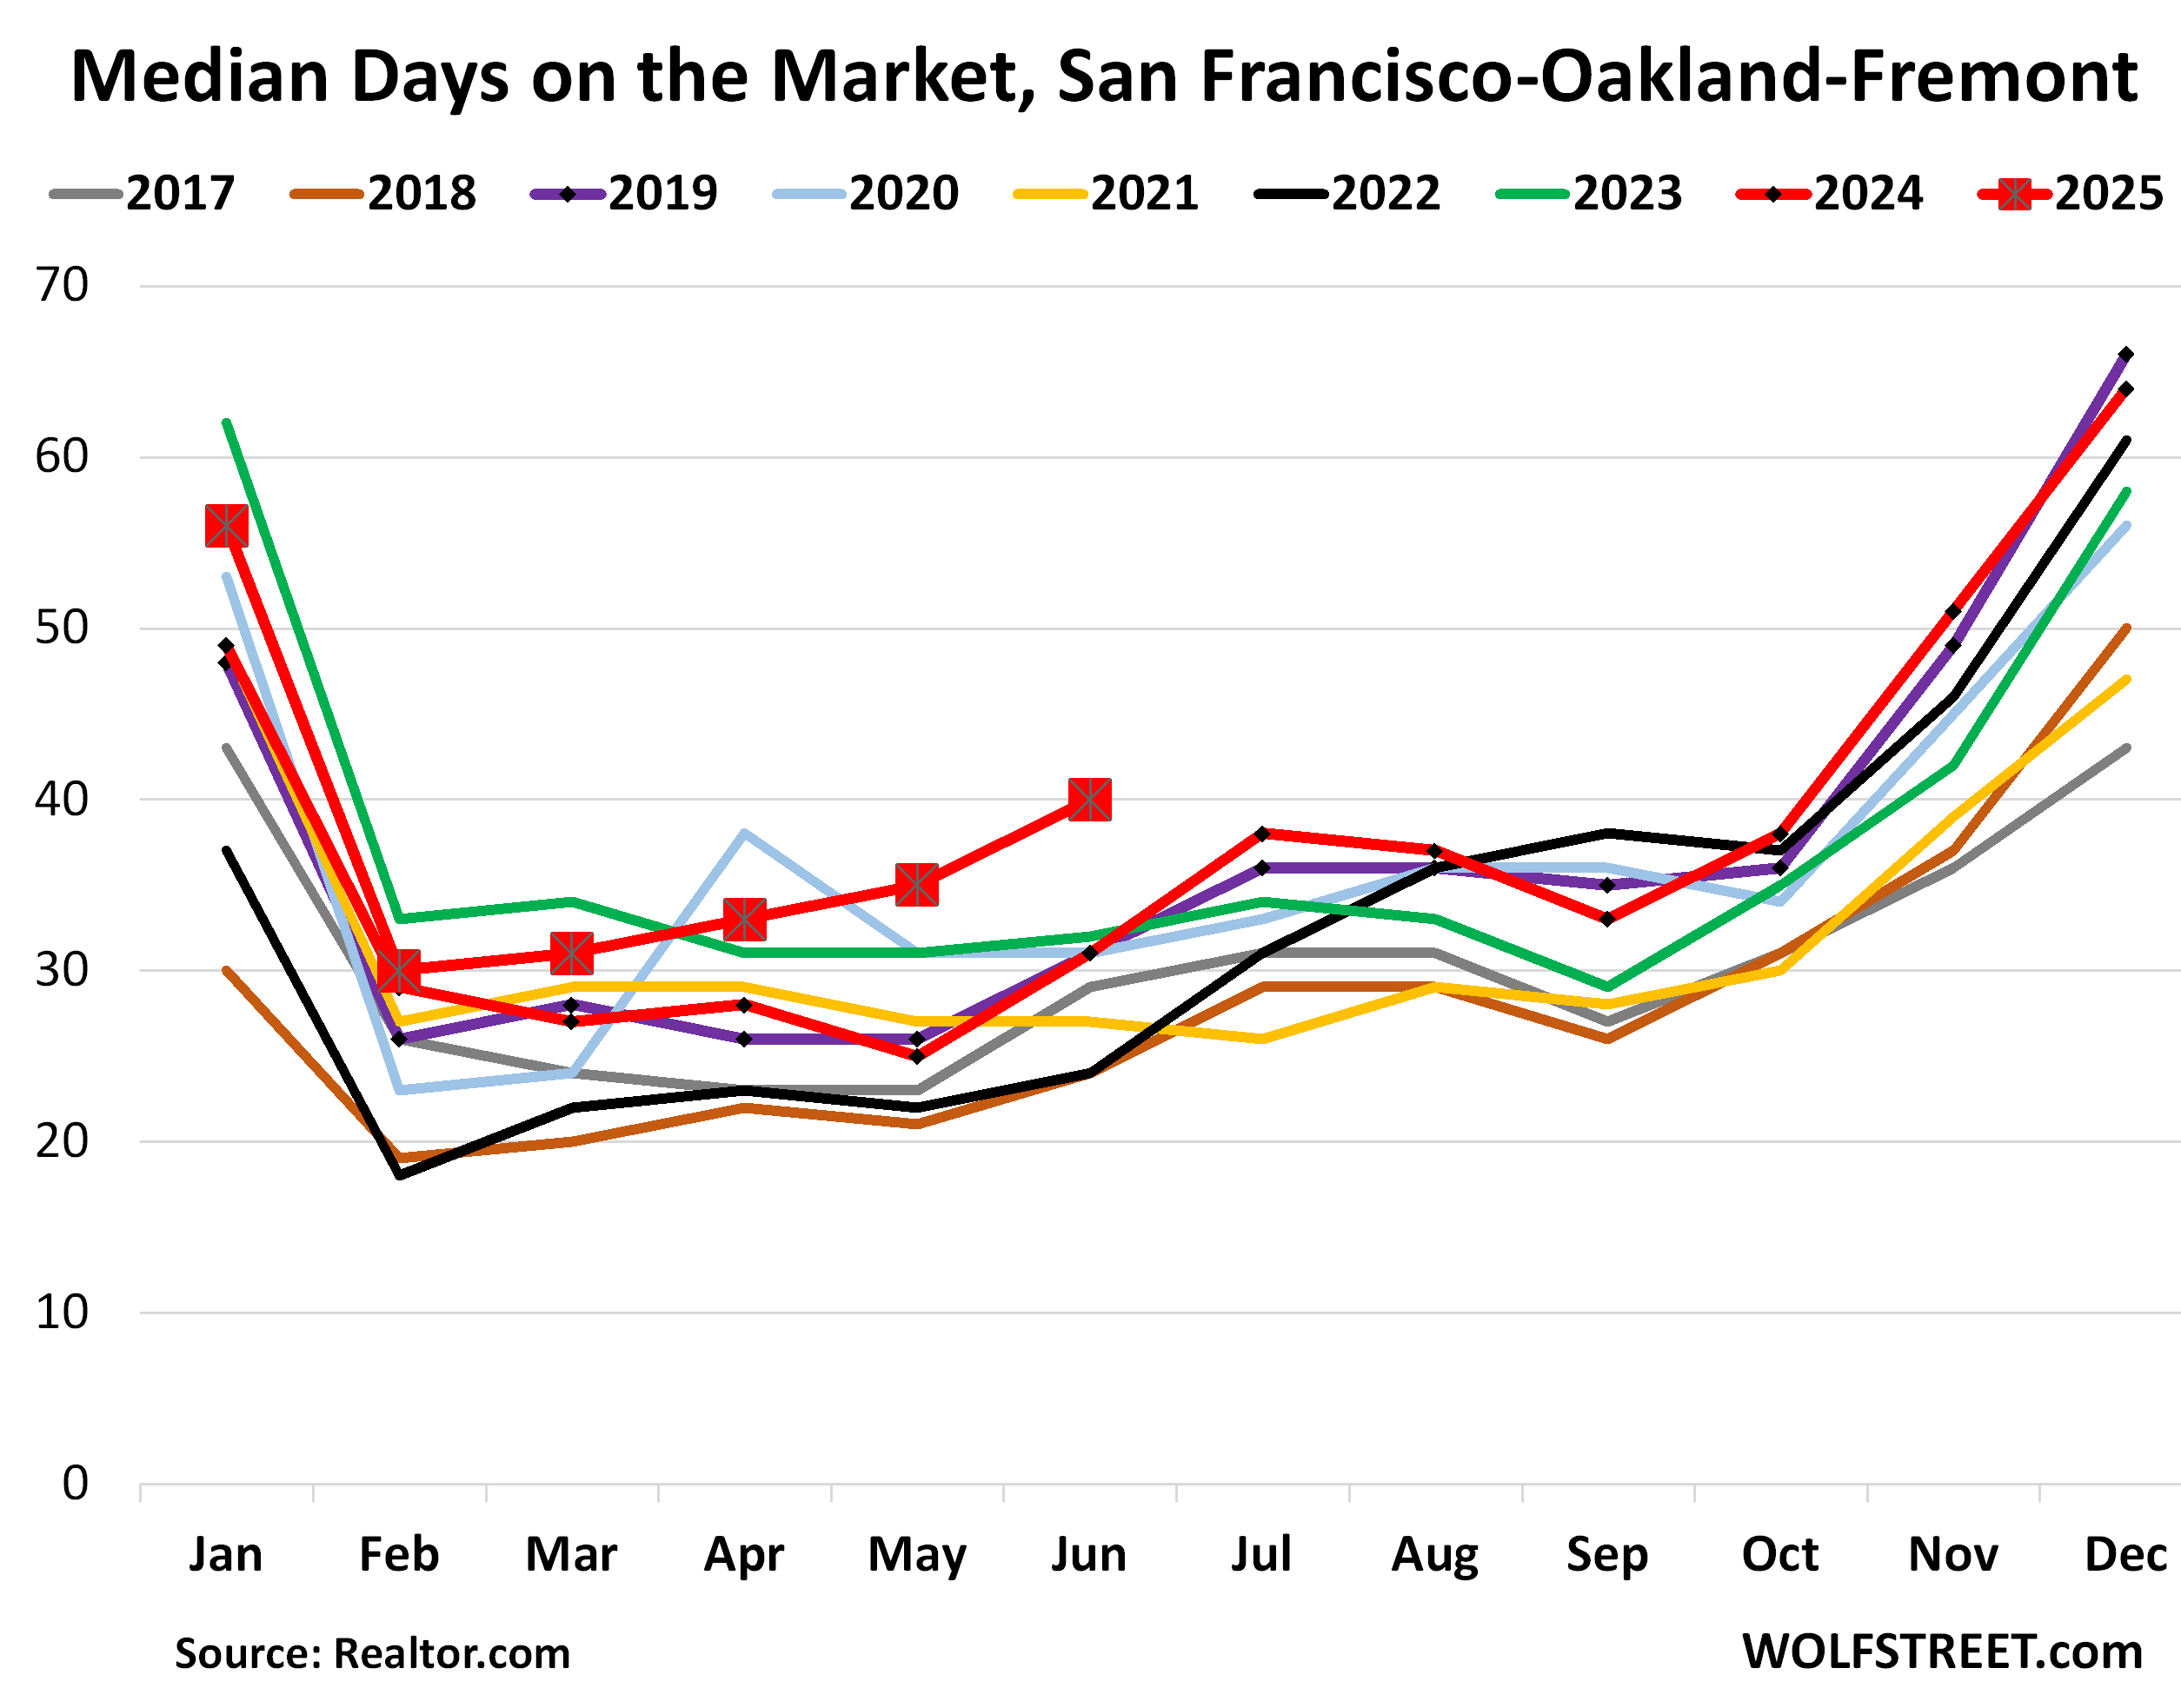
Sellers pull their homes off the market “in frustration.” This increase in median days on the market comes despite a surge of delistings across the US as frustrated sellers, seeing that demand has withered and that they can’t get the price they want, pulled their homes off the market and decided to wait for better days or whatever.
Delistings surged by 47% year-over-year across the US, as “sellers who can’t get their price quit the market in frustration,” realtor.com reported in a blogpost today.
“The trend is especially noticeable in the South and West, where inventory has surged back above pre-pandemic levels, and prices are flat or falling,” Realtor.com noted. So that includes California.
Prices in many of these markets have begun to drop – the “in frustration” part – and so sellers decided to wait until prices drop even further?
San Diego County: Active listings spiked by 55% year-over-year, to 6,116 homes for sale, the highest for any June 2018 (brown double line) and June 2019 (purple dotted line) in the data going back to 2016.
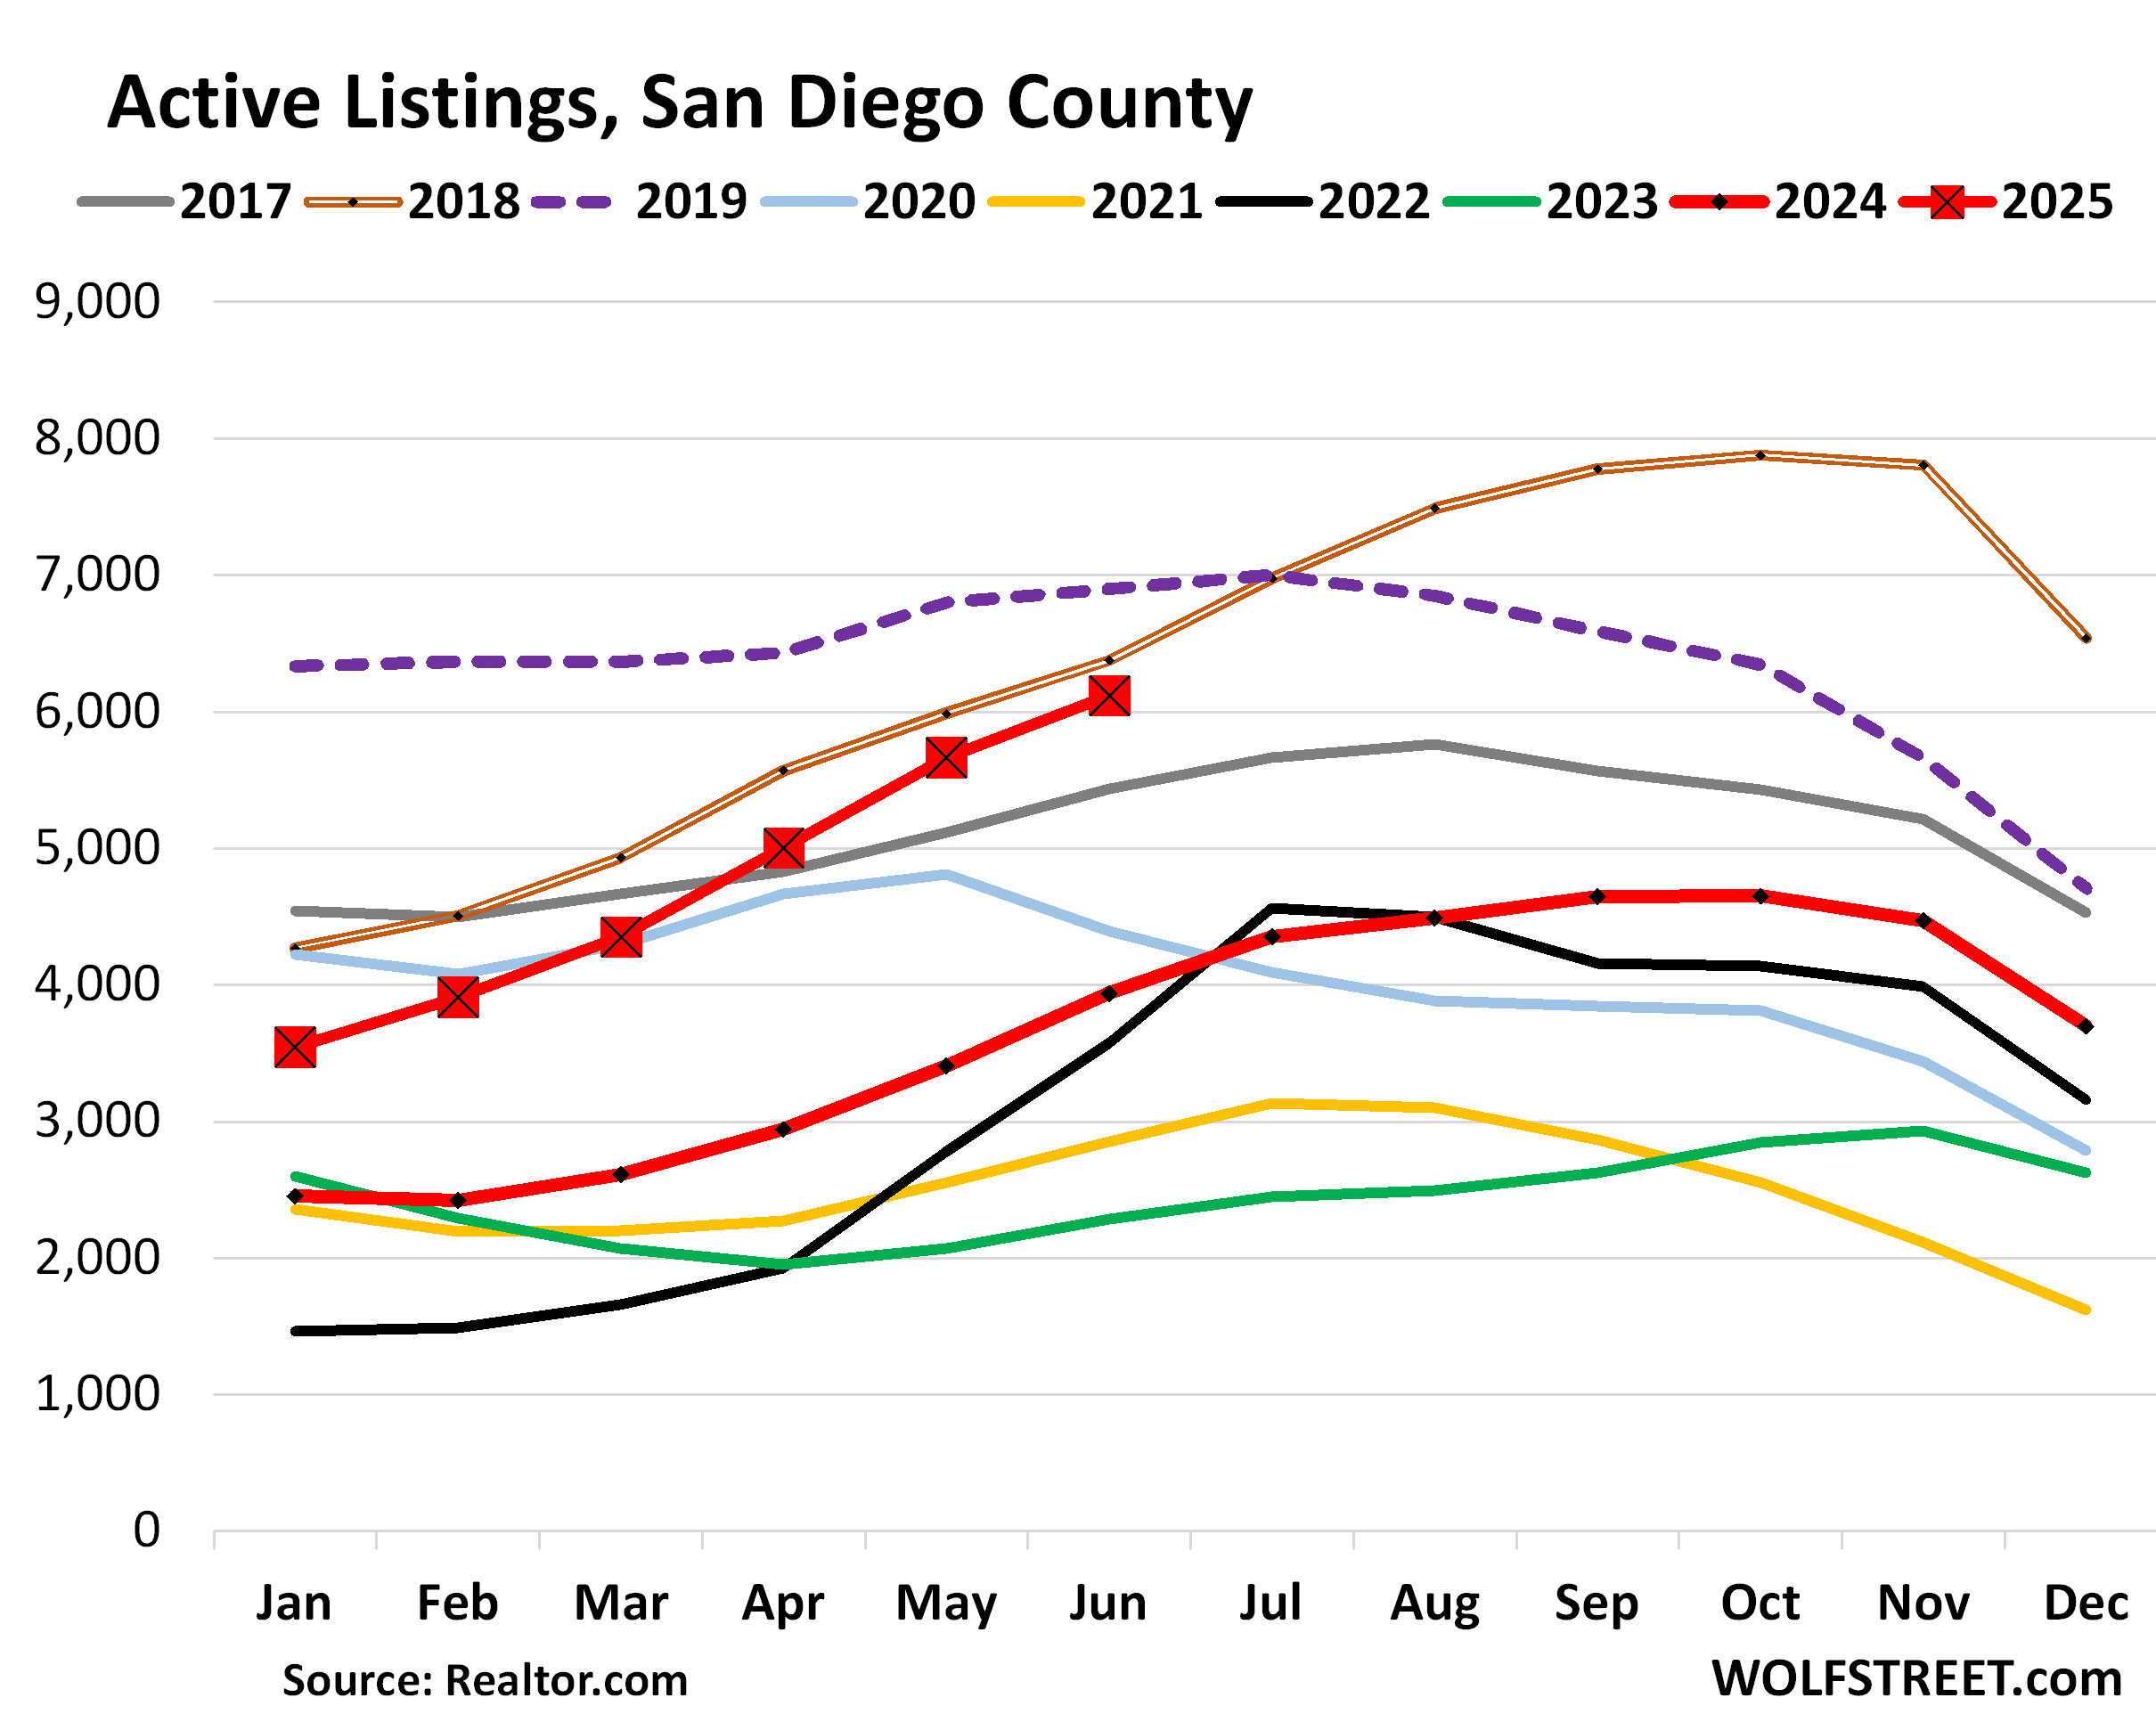
The median number of days that a home spent on the market in San Diego County before it was either pulled off the market or sold rose to 41 days, up from 33 days a year ago, and the second-highest June in the data from realtor.com going back to 2016, behind only June 2020.
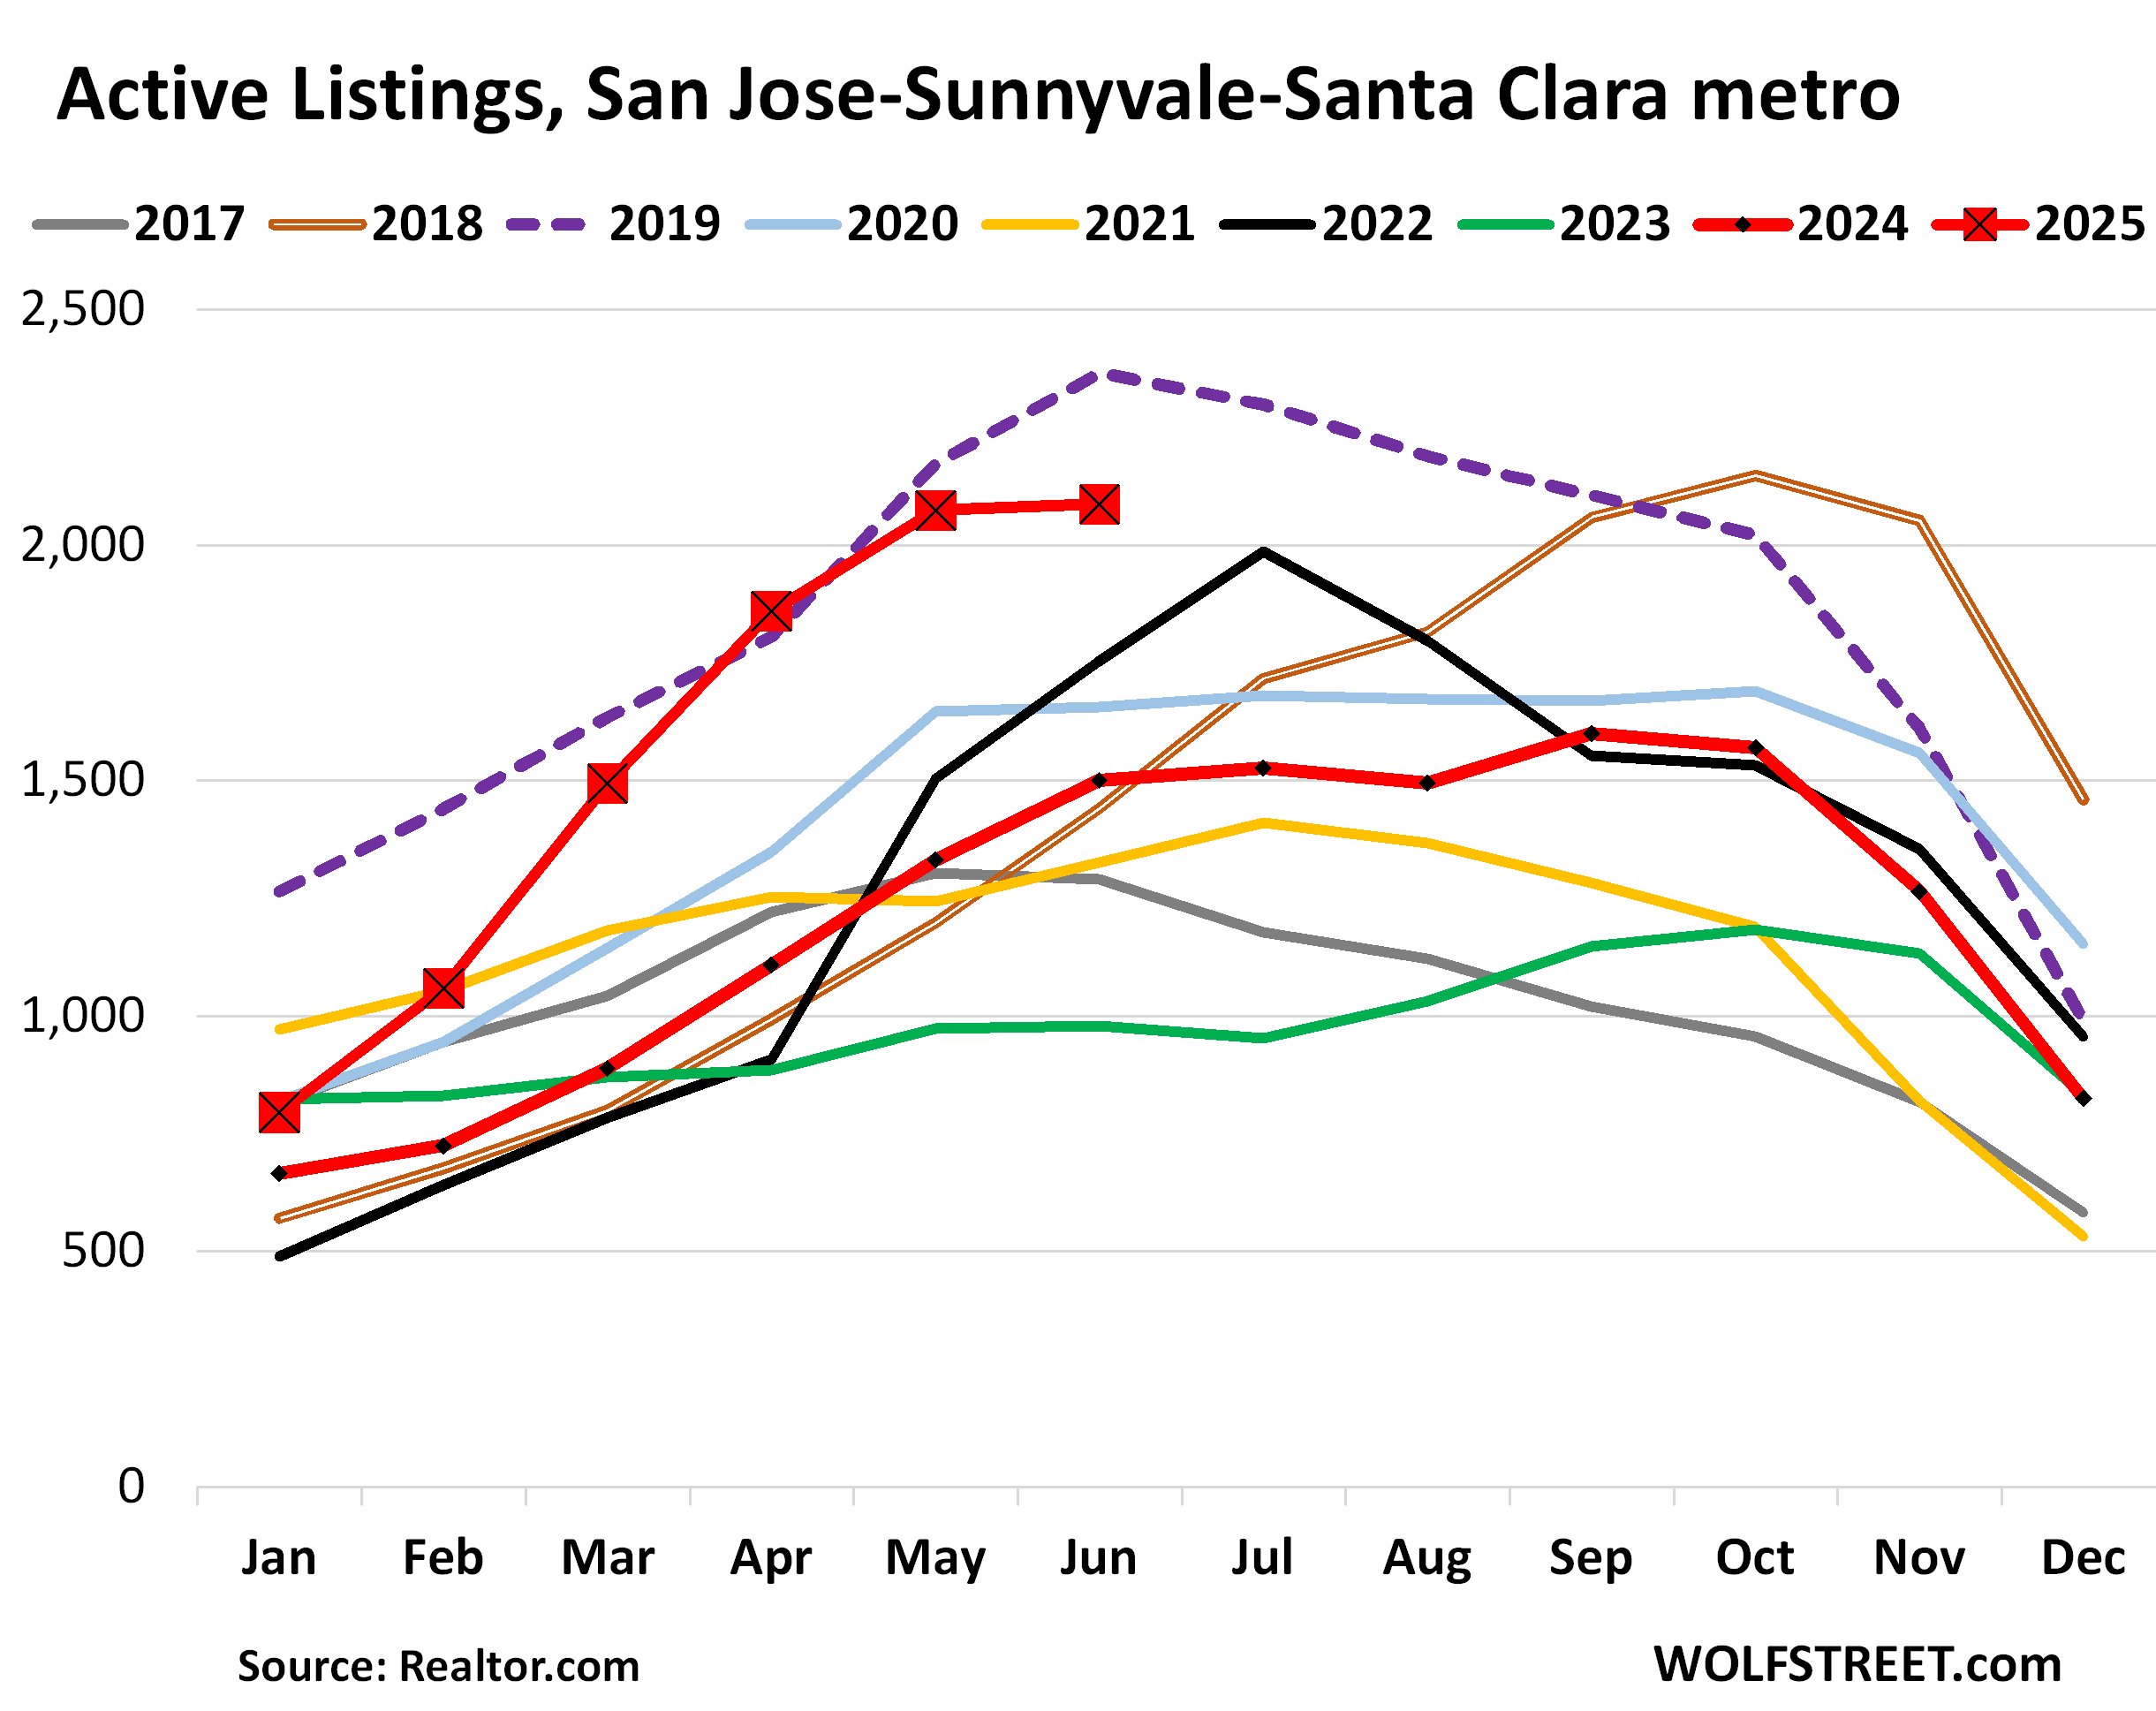
San Jose-Sunnyvale-Santa Clara metro: Active listings spiked by 39% year-over-year in June, to 2,087 homes for sale, the second-highest in the data going back to 2016, behind only June 2019.
The MSA includes Santa Clara County (San Jose and the southern part of Silicon Valley) and goes south into rural areas.
Median days on the market jumped to 34 days in June, the second-highest June in the data from realtor.com going back to 2016, behind only June 2020 (35 days), and up from 25 days a year ago.
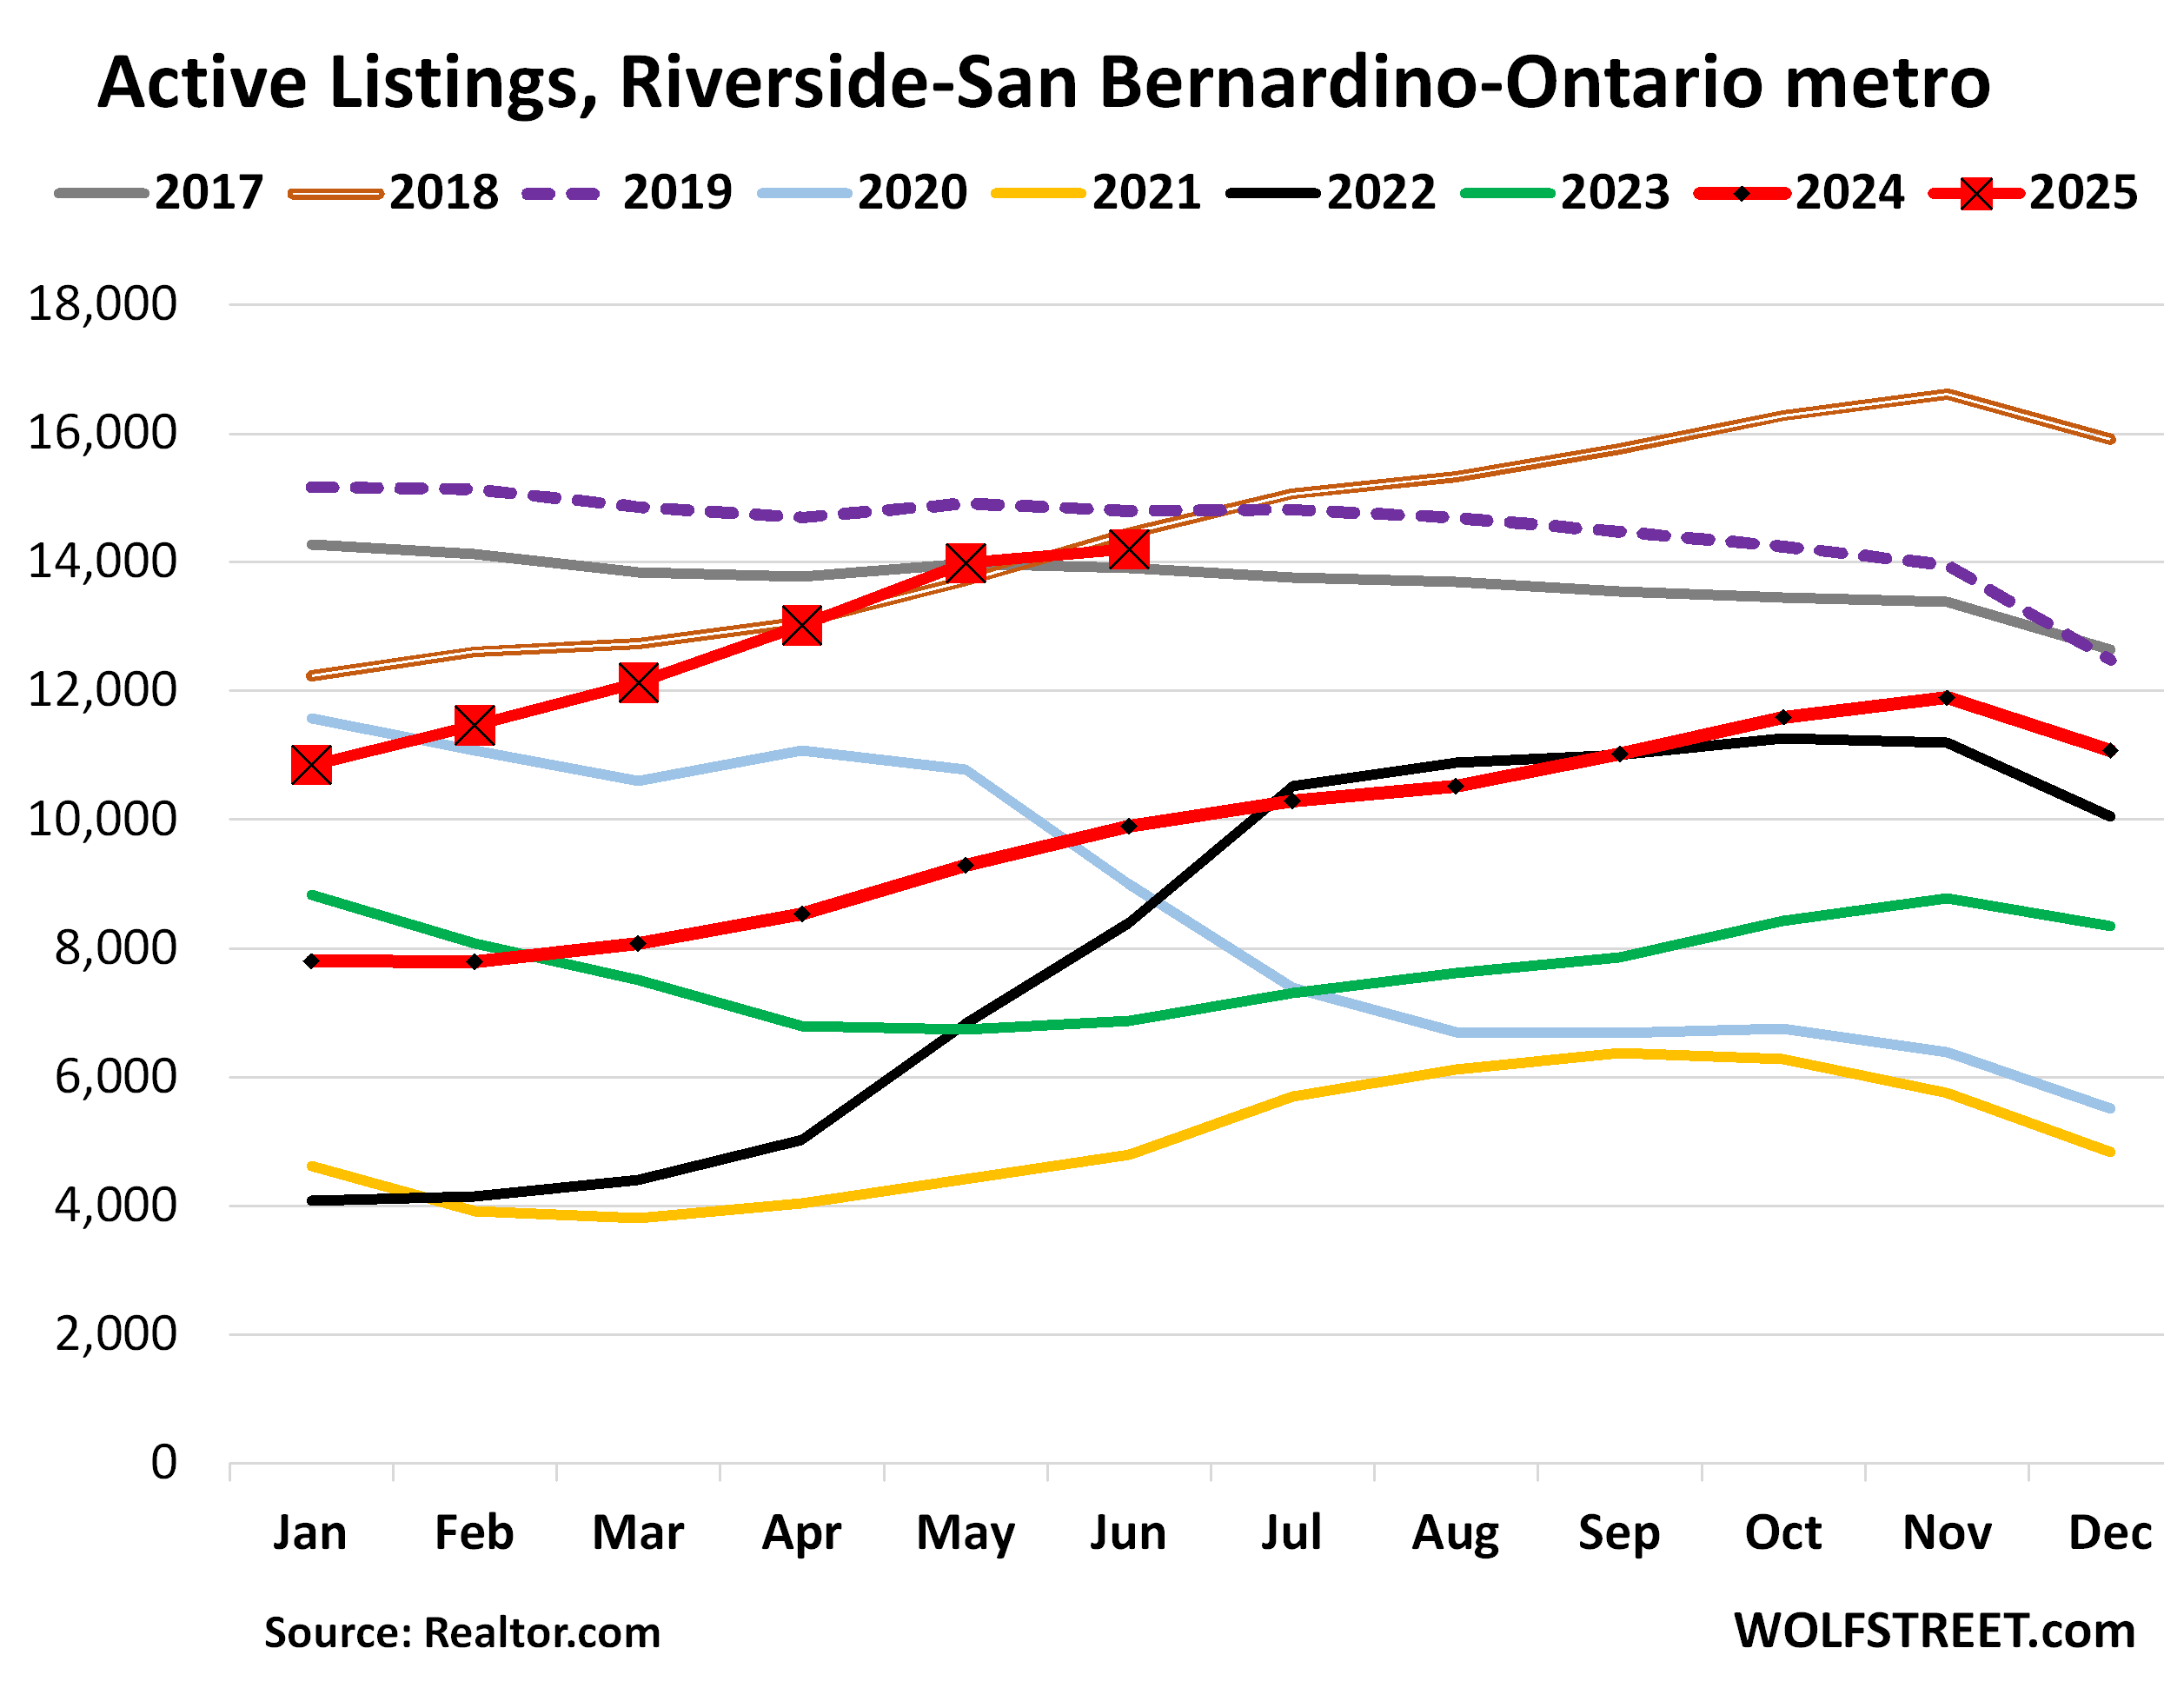
Riverside-San Bernardino-Ontario metro: Active listings spiked by 44% year-over-year, to 14,205 homes, just a hair below the Junes of 2018 and 2019, and all three were the highest in the data going back to 2016.
This metro is huge in terms of active listings and matches Los Angeles County: both had over 14,000 listings in June. The next largest market here is the San Francisco-Oakland-Fremont metro with 7,200 listings. San Diego County is next with 6,100, then the Sacramento-Roseville-Folsom metro with 5,400, Orange County with 4,700, Fresno with 2,100, and San Jose with 2,100 listings.
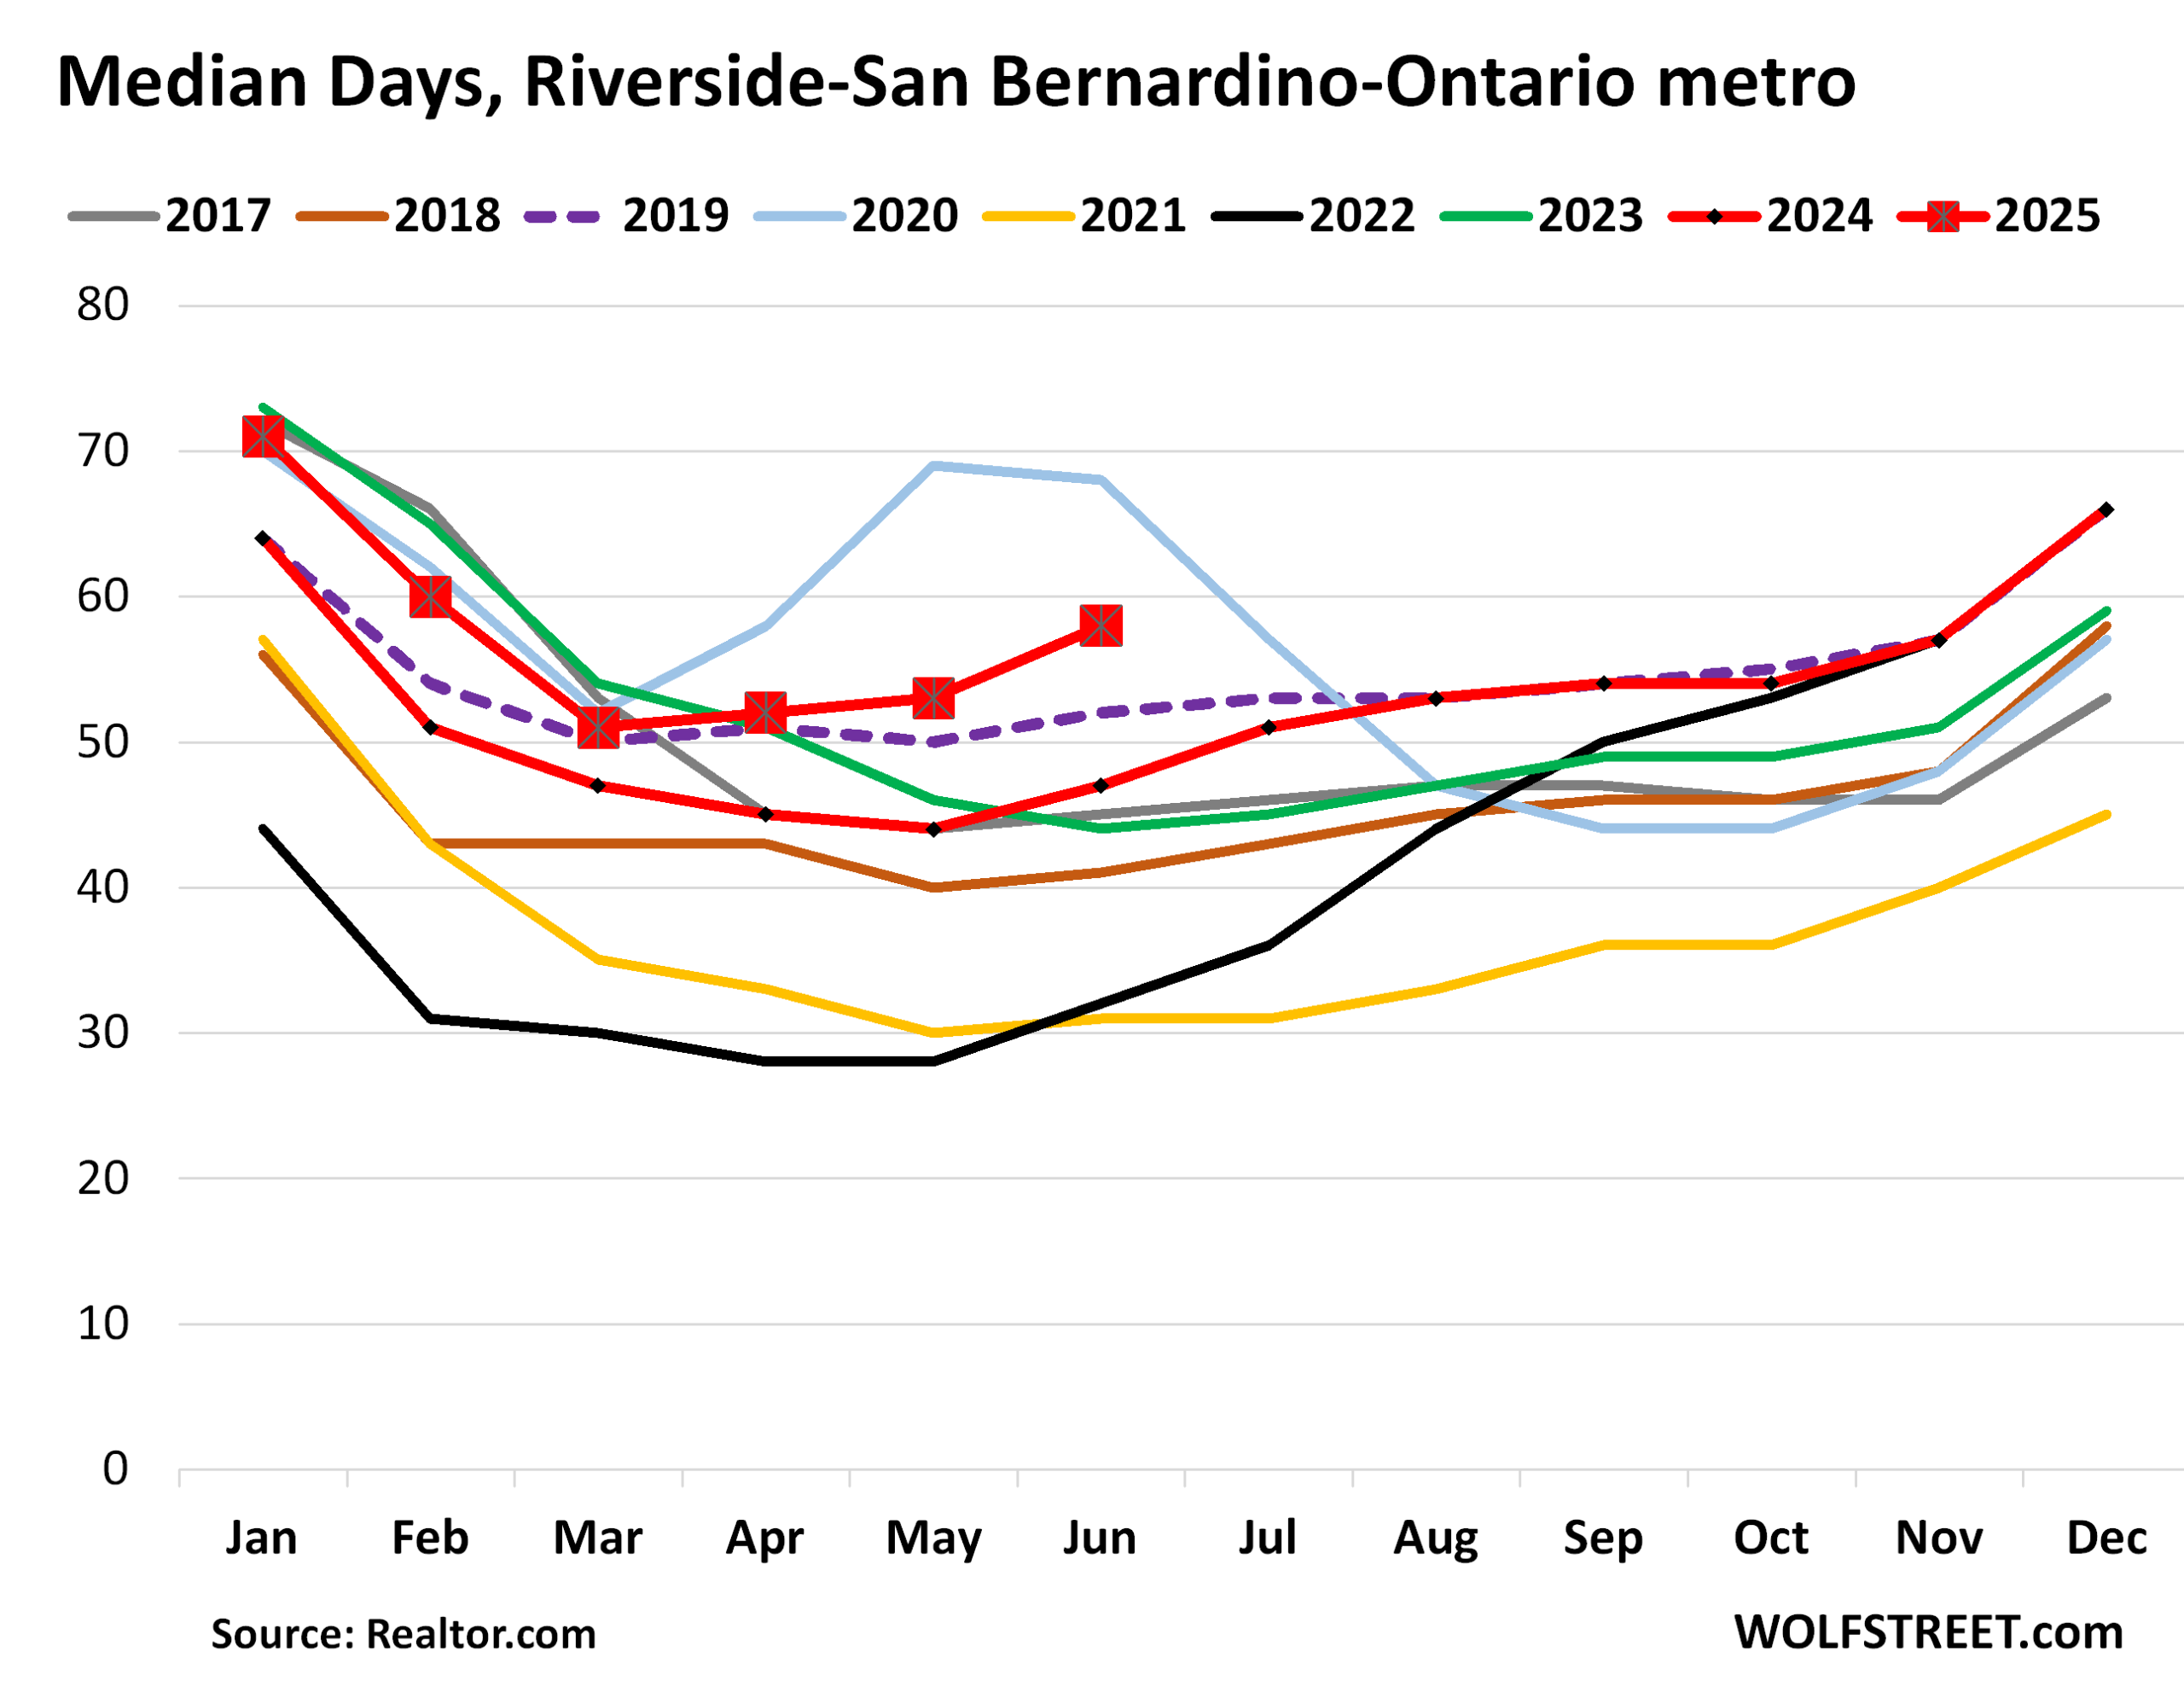
Median days on the market jumped to 58 days, the second-highest June in the data from realtor.com going back to 2016, behind only June 2020 (light blue), and up from 53 days in May.
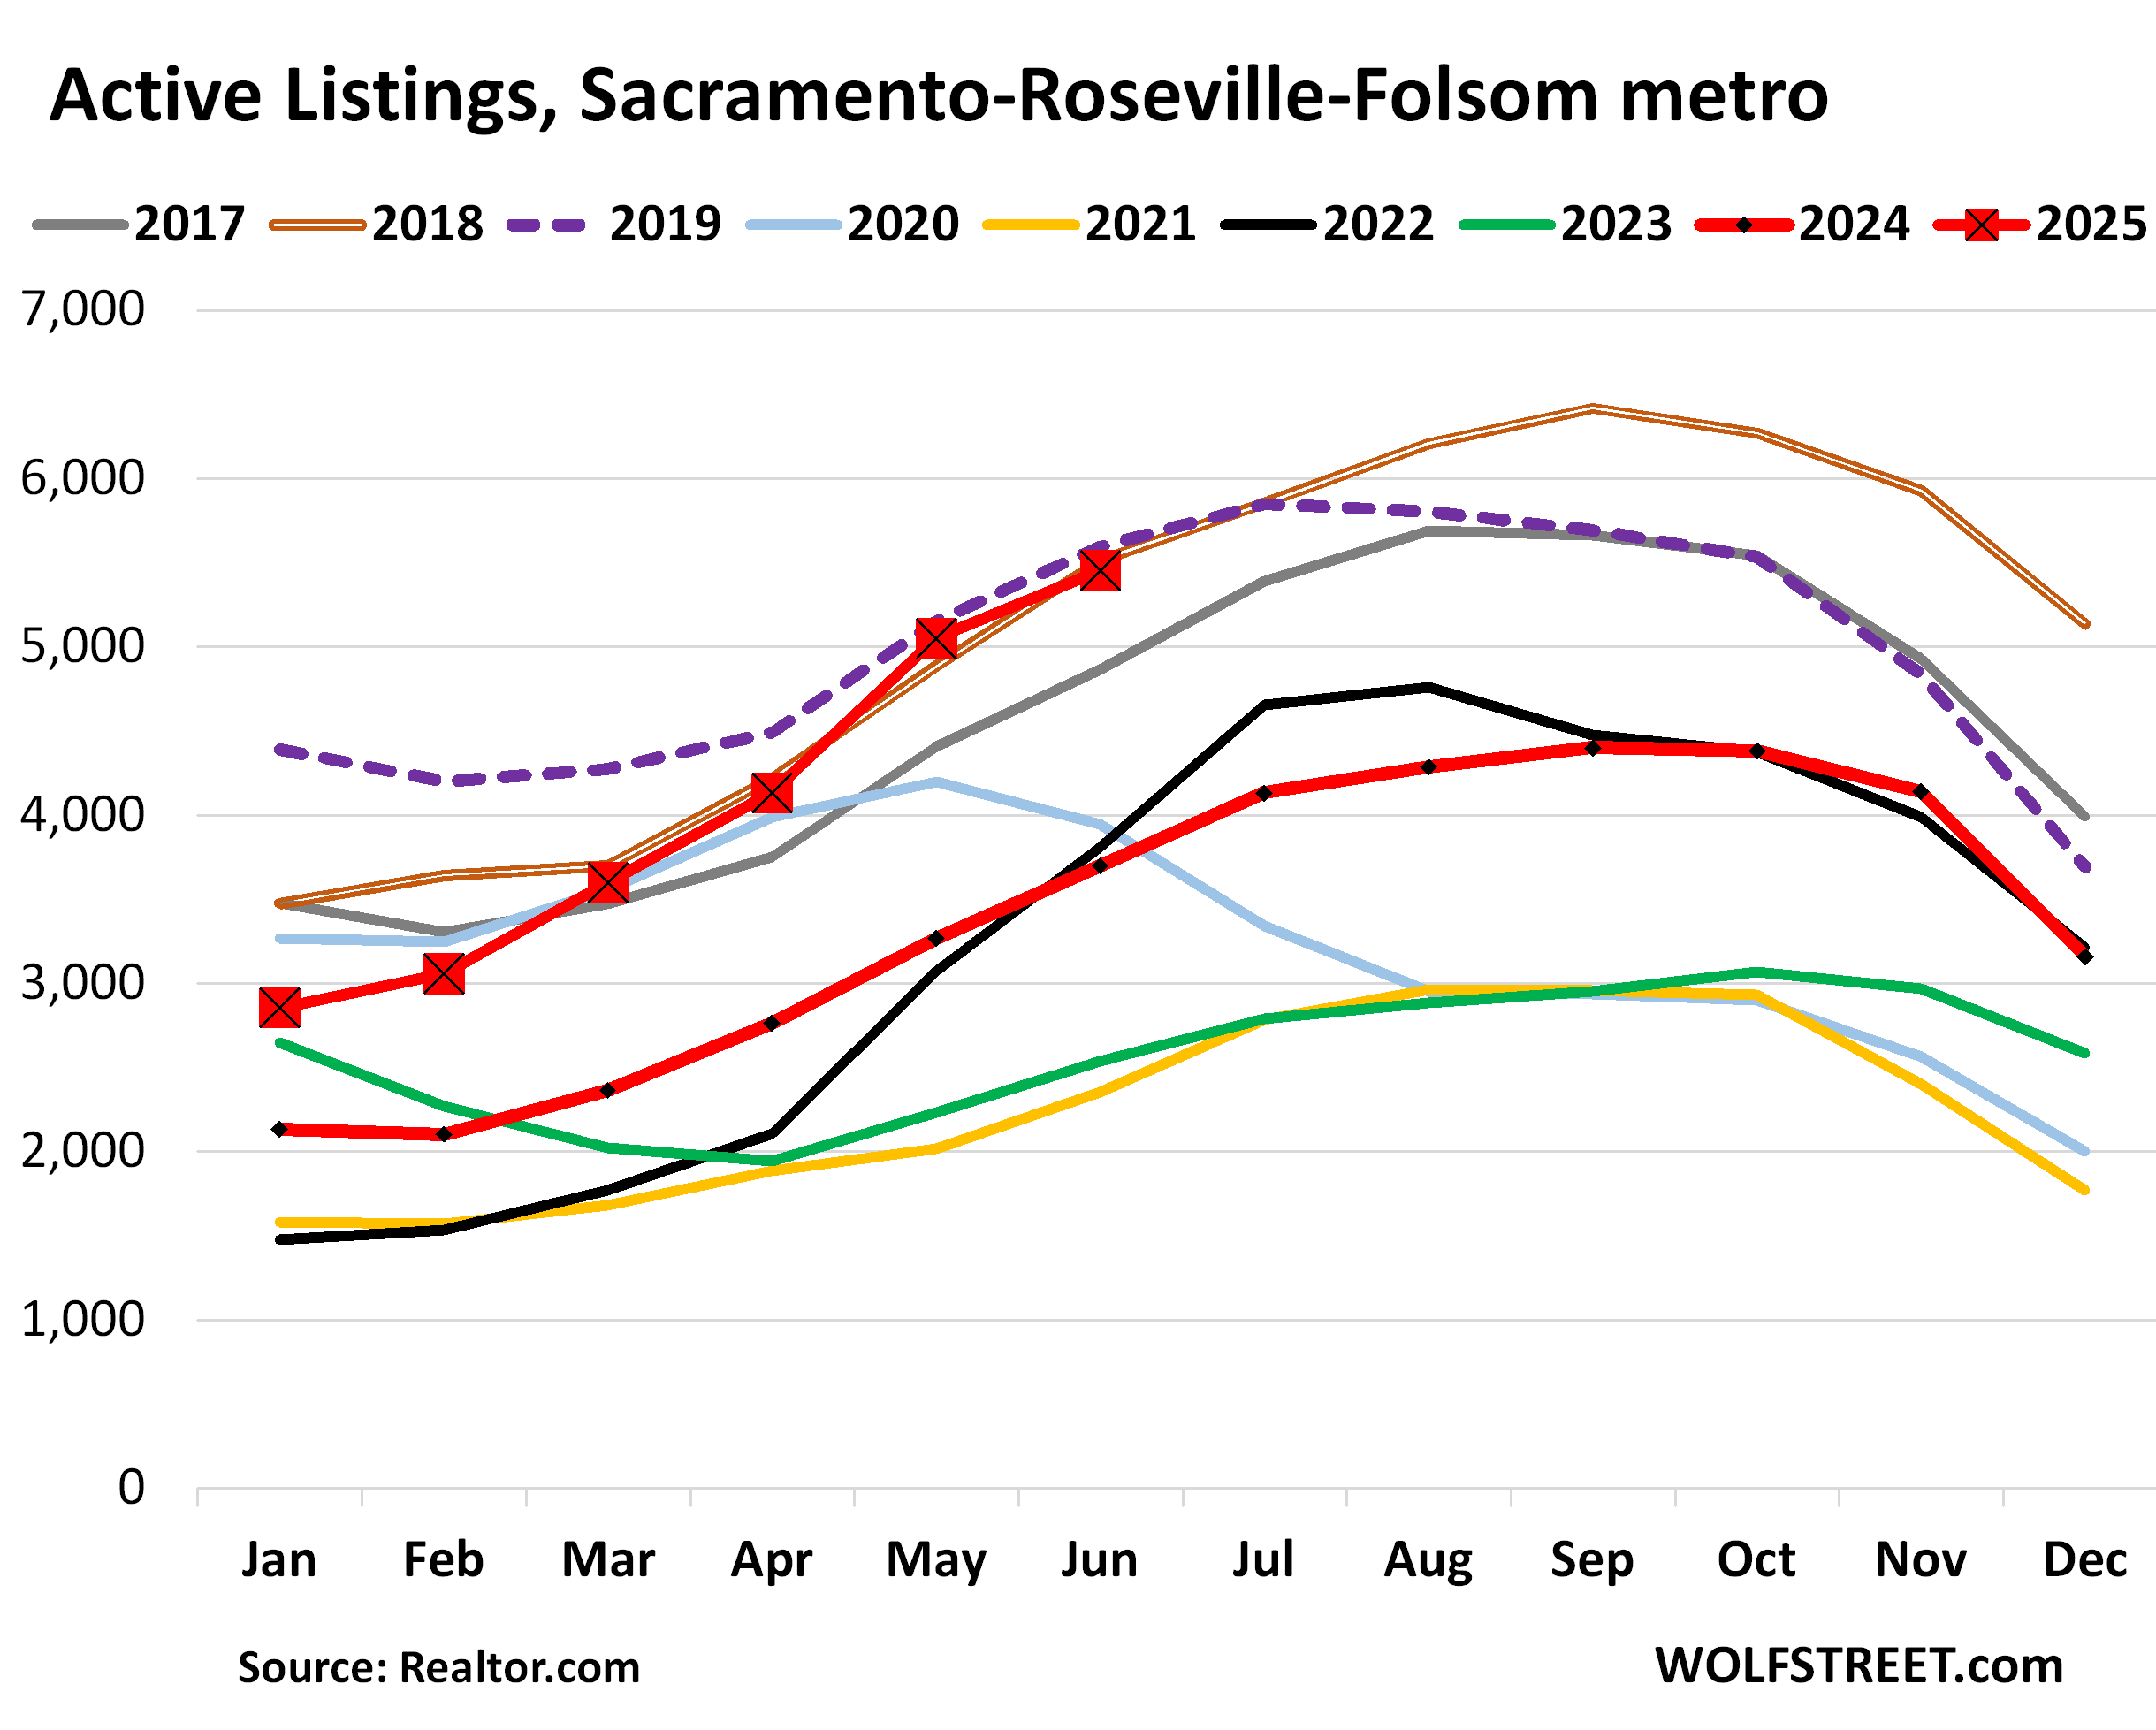
Sacramento-Roseville-Folsom metro: Active listings spiked by 47% year-over-year to 5,452 homes for sale, just a hair below 2018 and 2019.
Median days on the market jumped to 44 days in June, behind only June 2020, and up from 37 days a year ago.
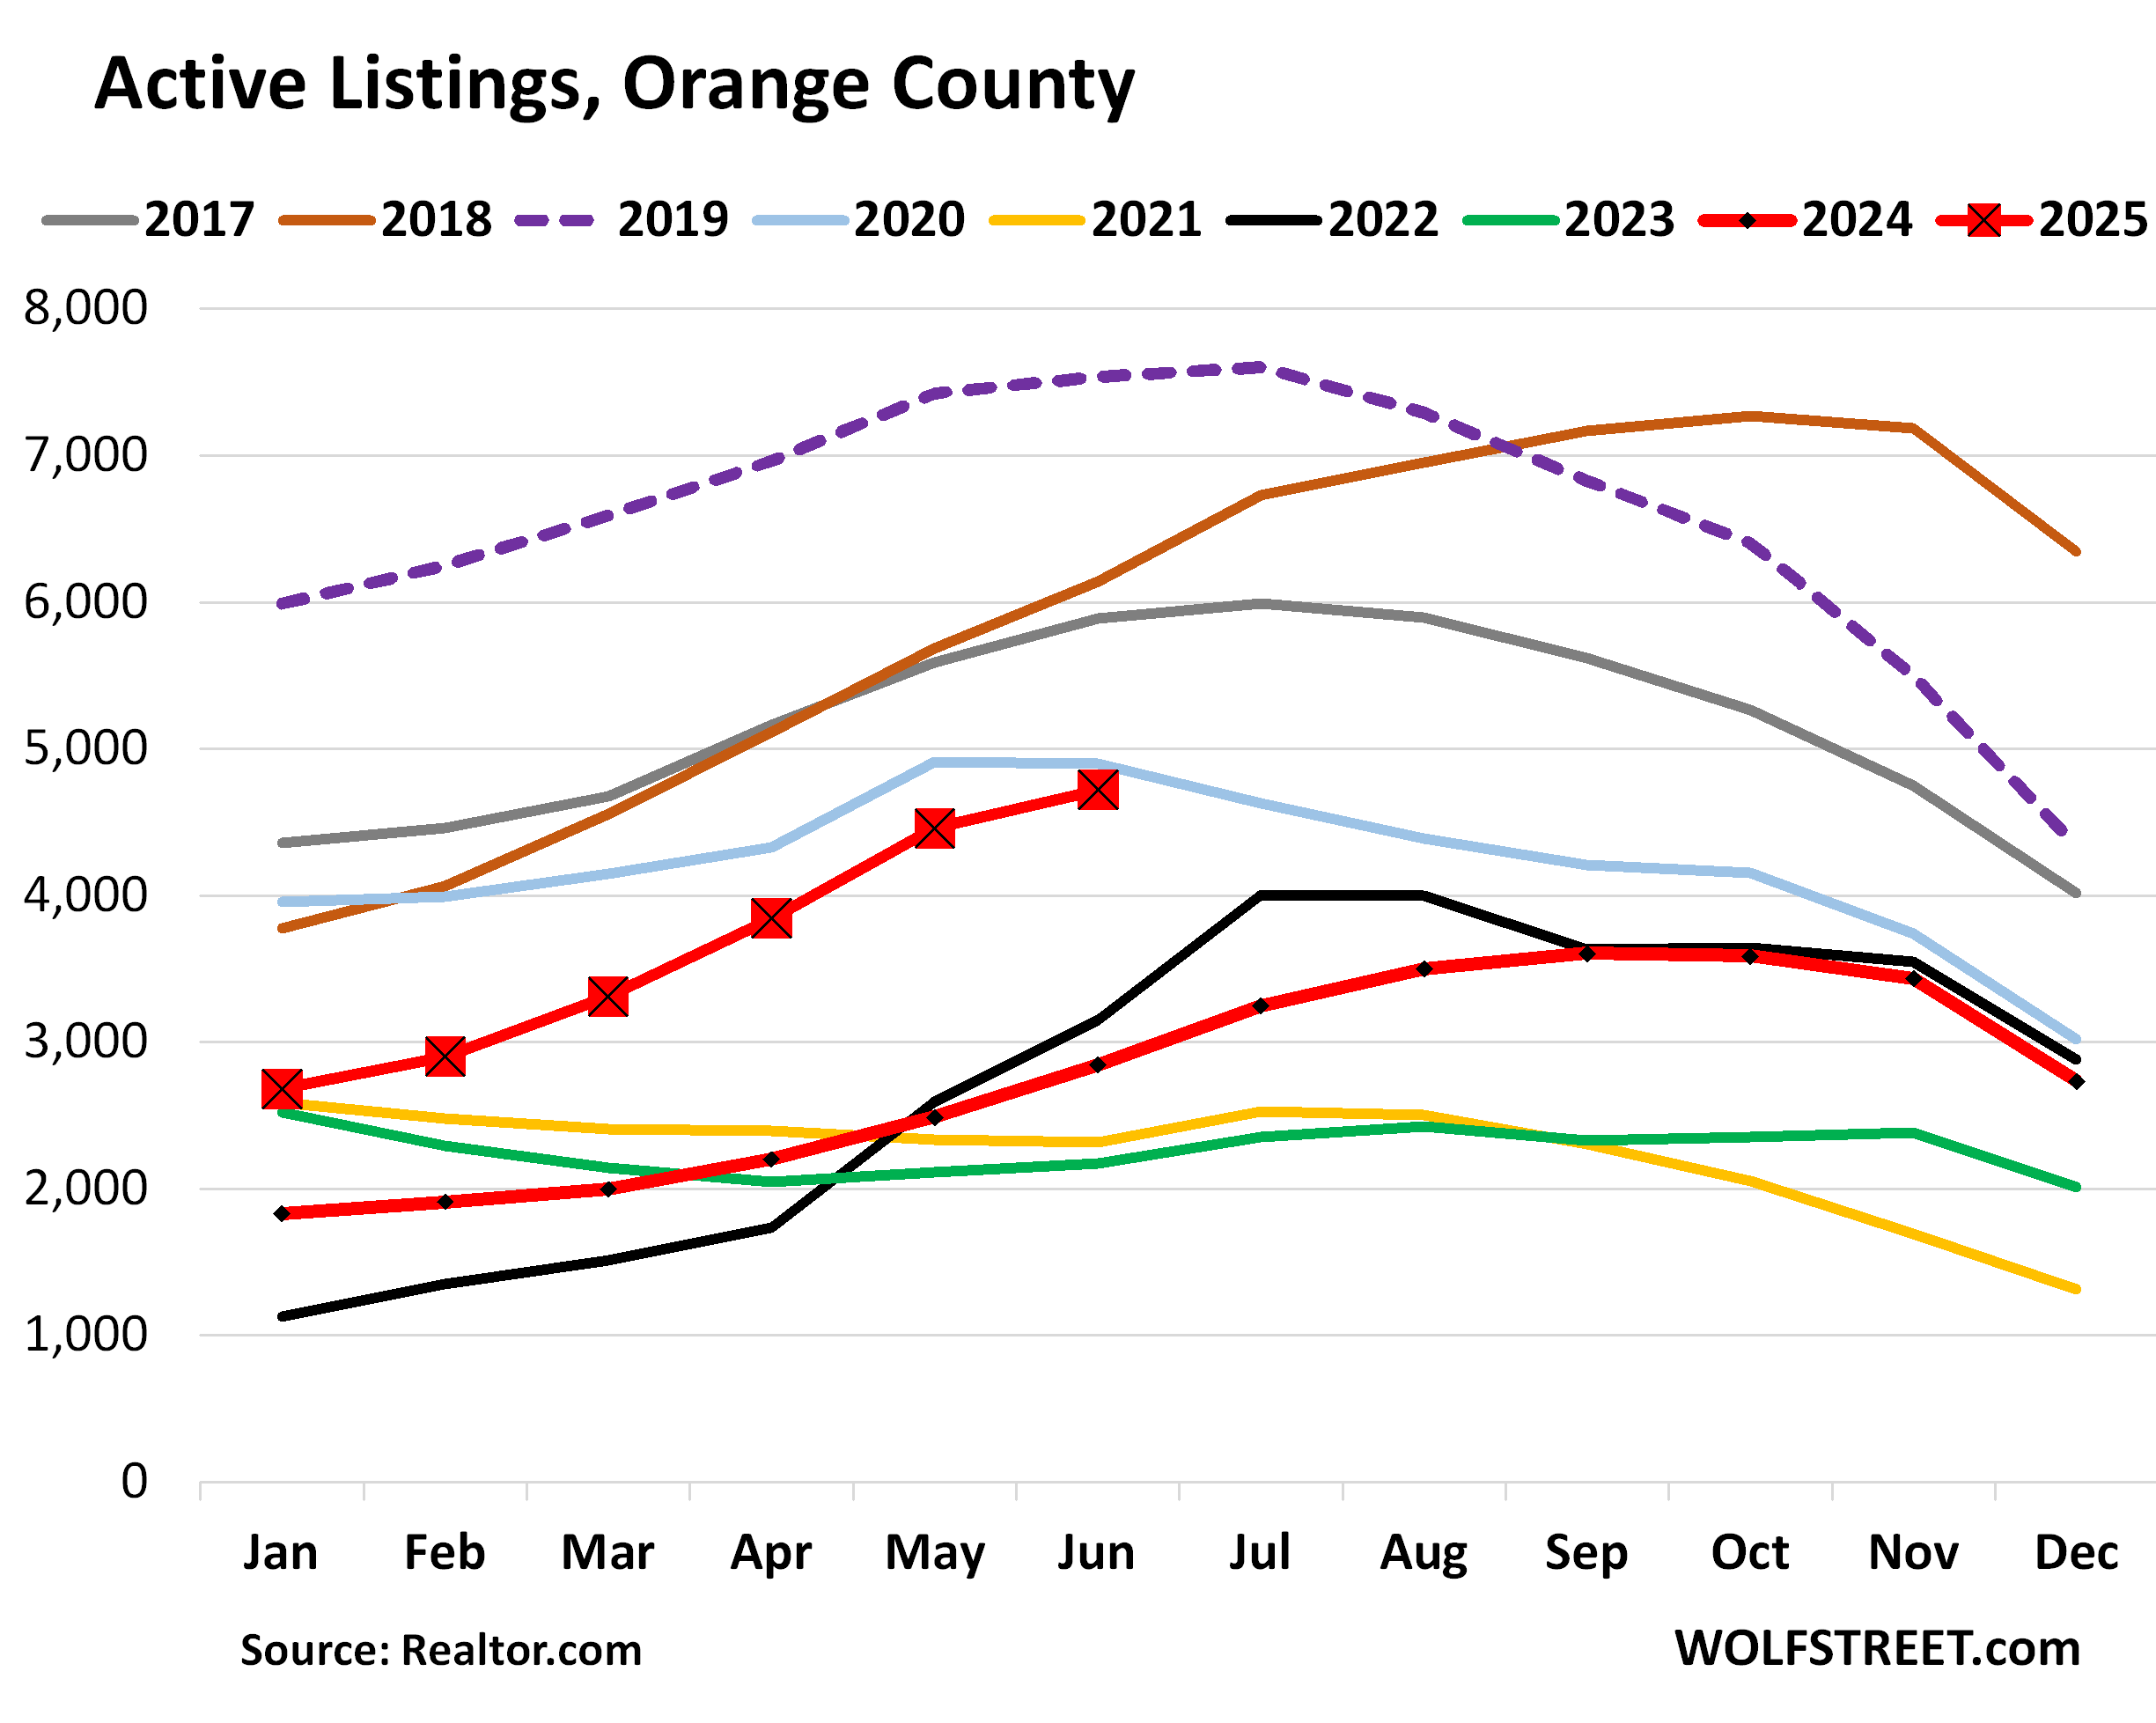
Orange County: Active listings spiked by 66% year-over-year in June, and by 118% from two years ago, to 4,719 homes.
Inventory has been low, as everywhere in 2021-2023, but got a late start taking off and was still low in 2024. But this year, the dynamics changed, and listings have more than doubled in two years.
Median days on the market have surged to 47 days, up from 37 days a year ago, and just a hair below 2019 and 2020, and all three are the highest in the data going back to 2016.
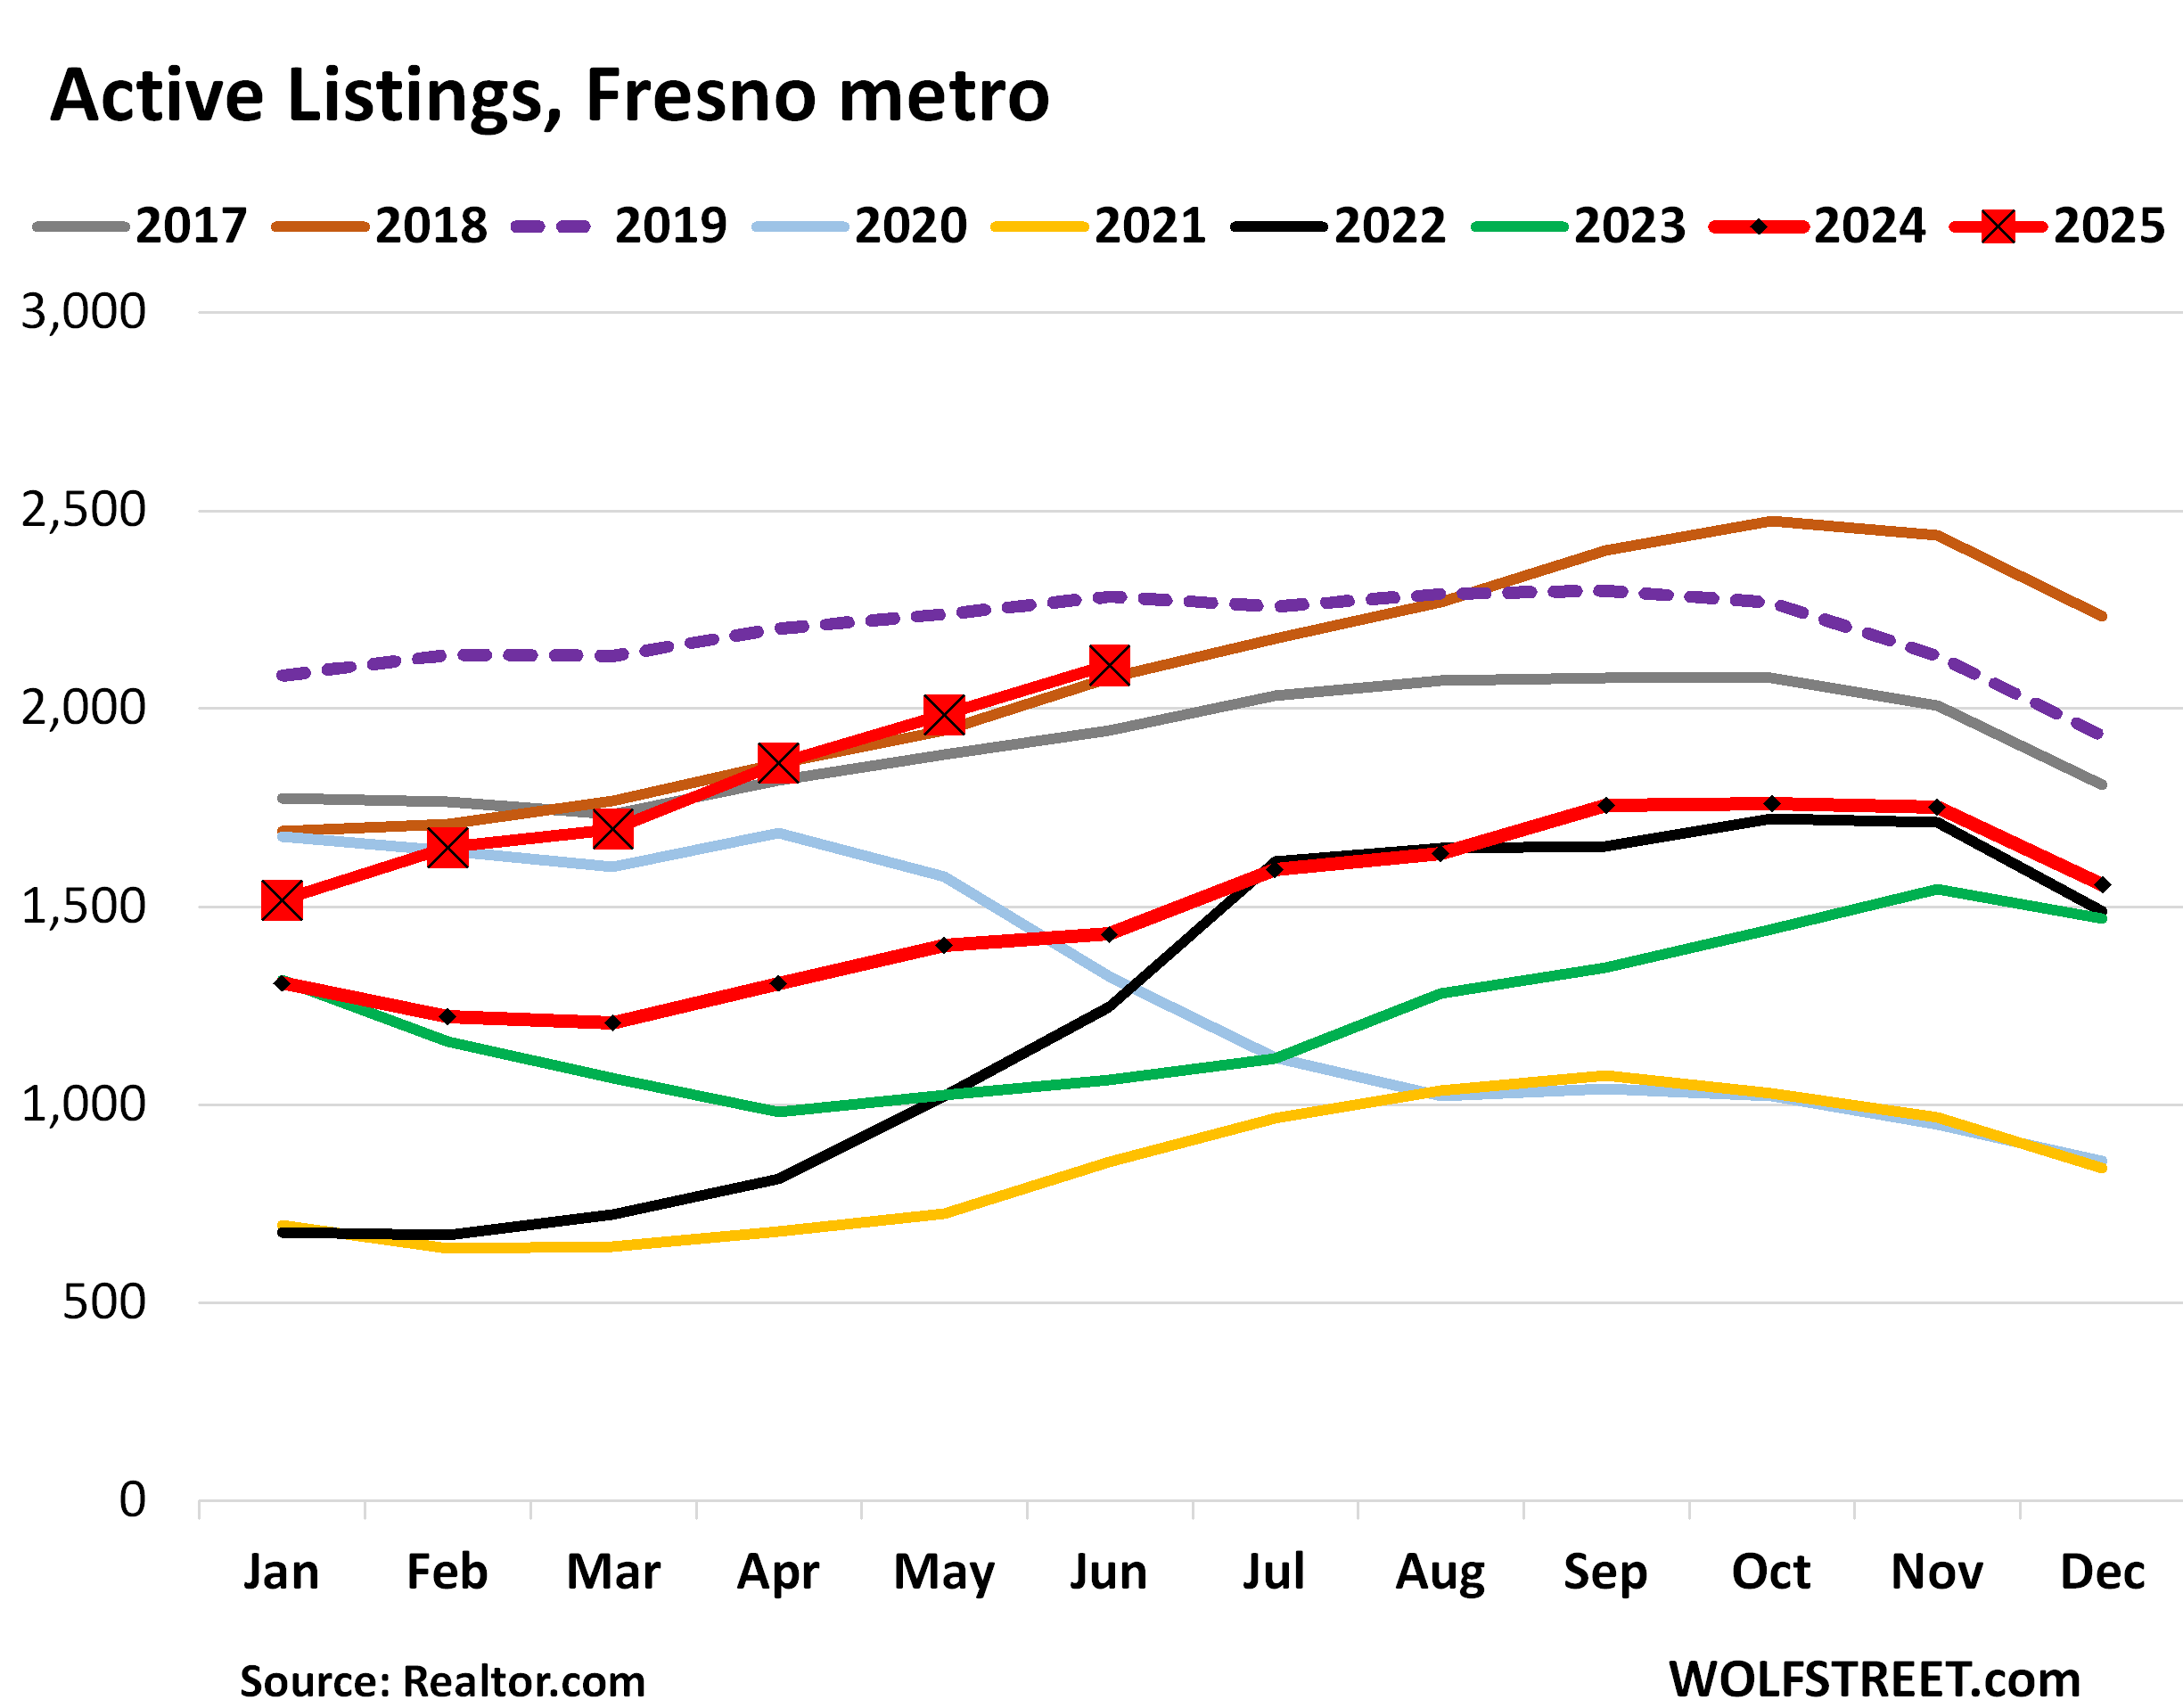
Fresno metro: Active listings spiked by 48% year-over-year to 2,110 homes for sale, the second-highest in the data going back to 2016, behind only June 2019. They doubled in two years.
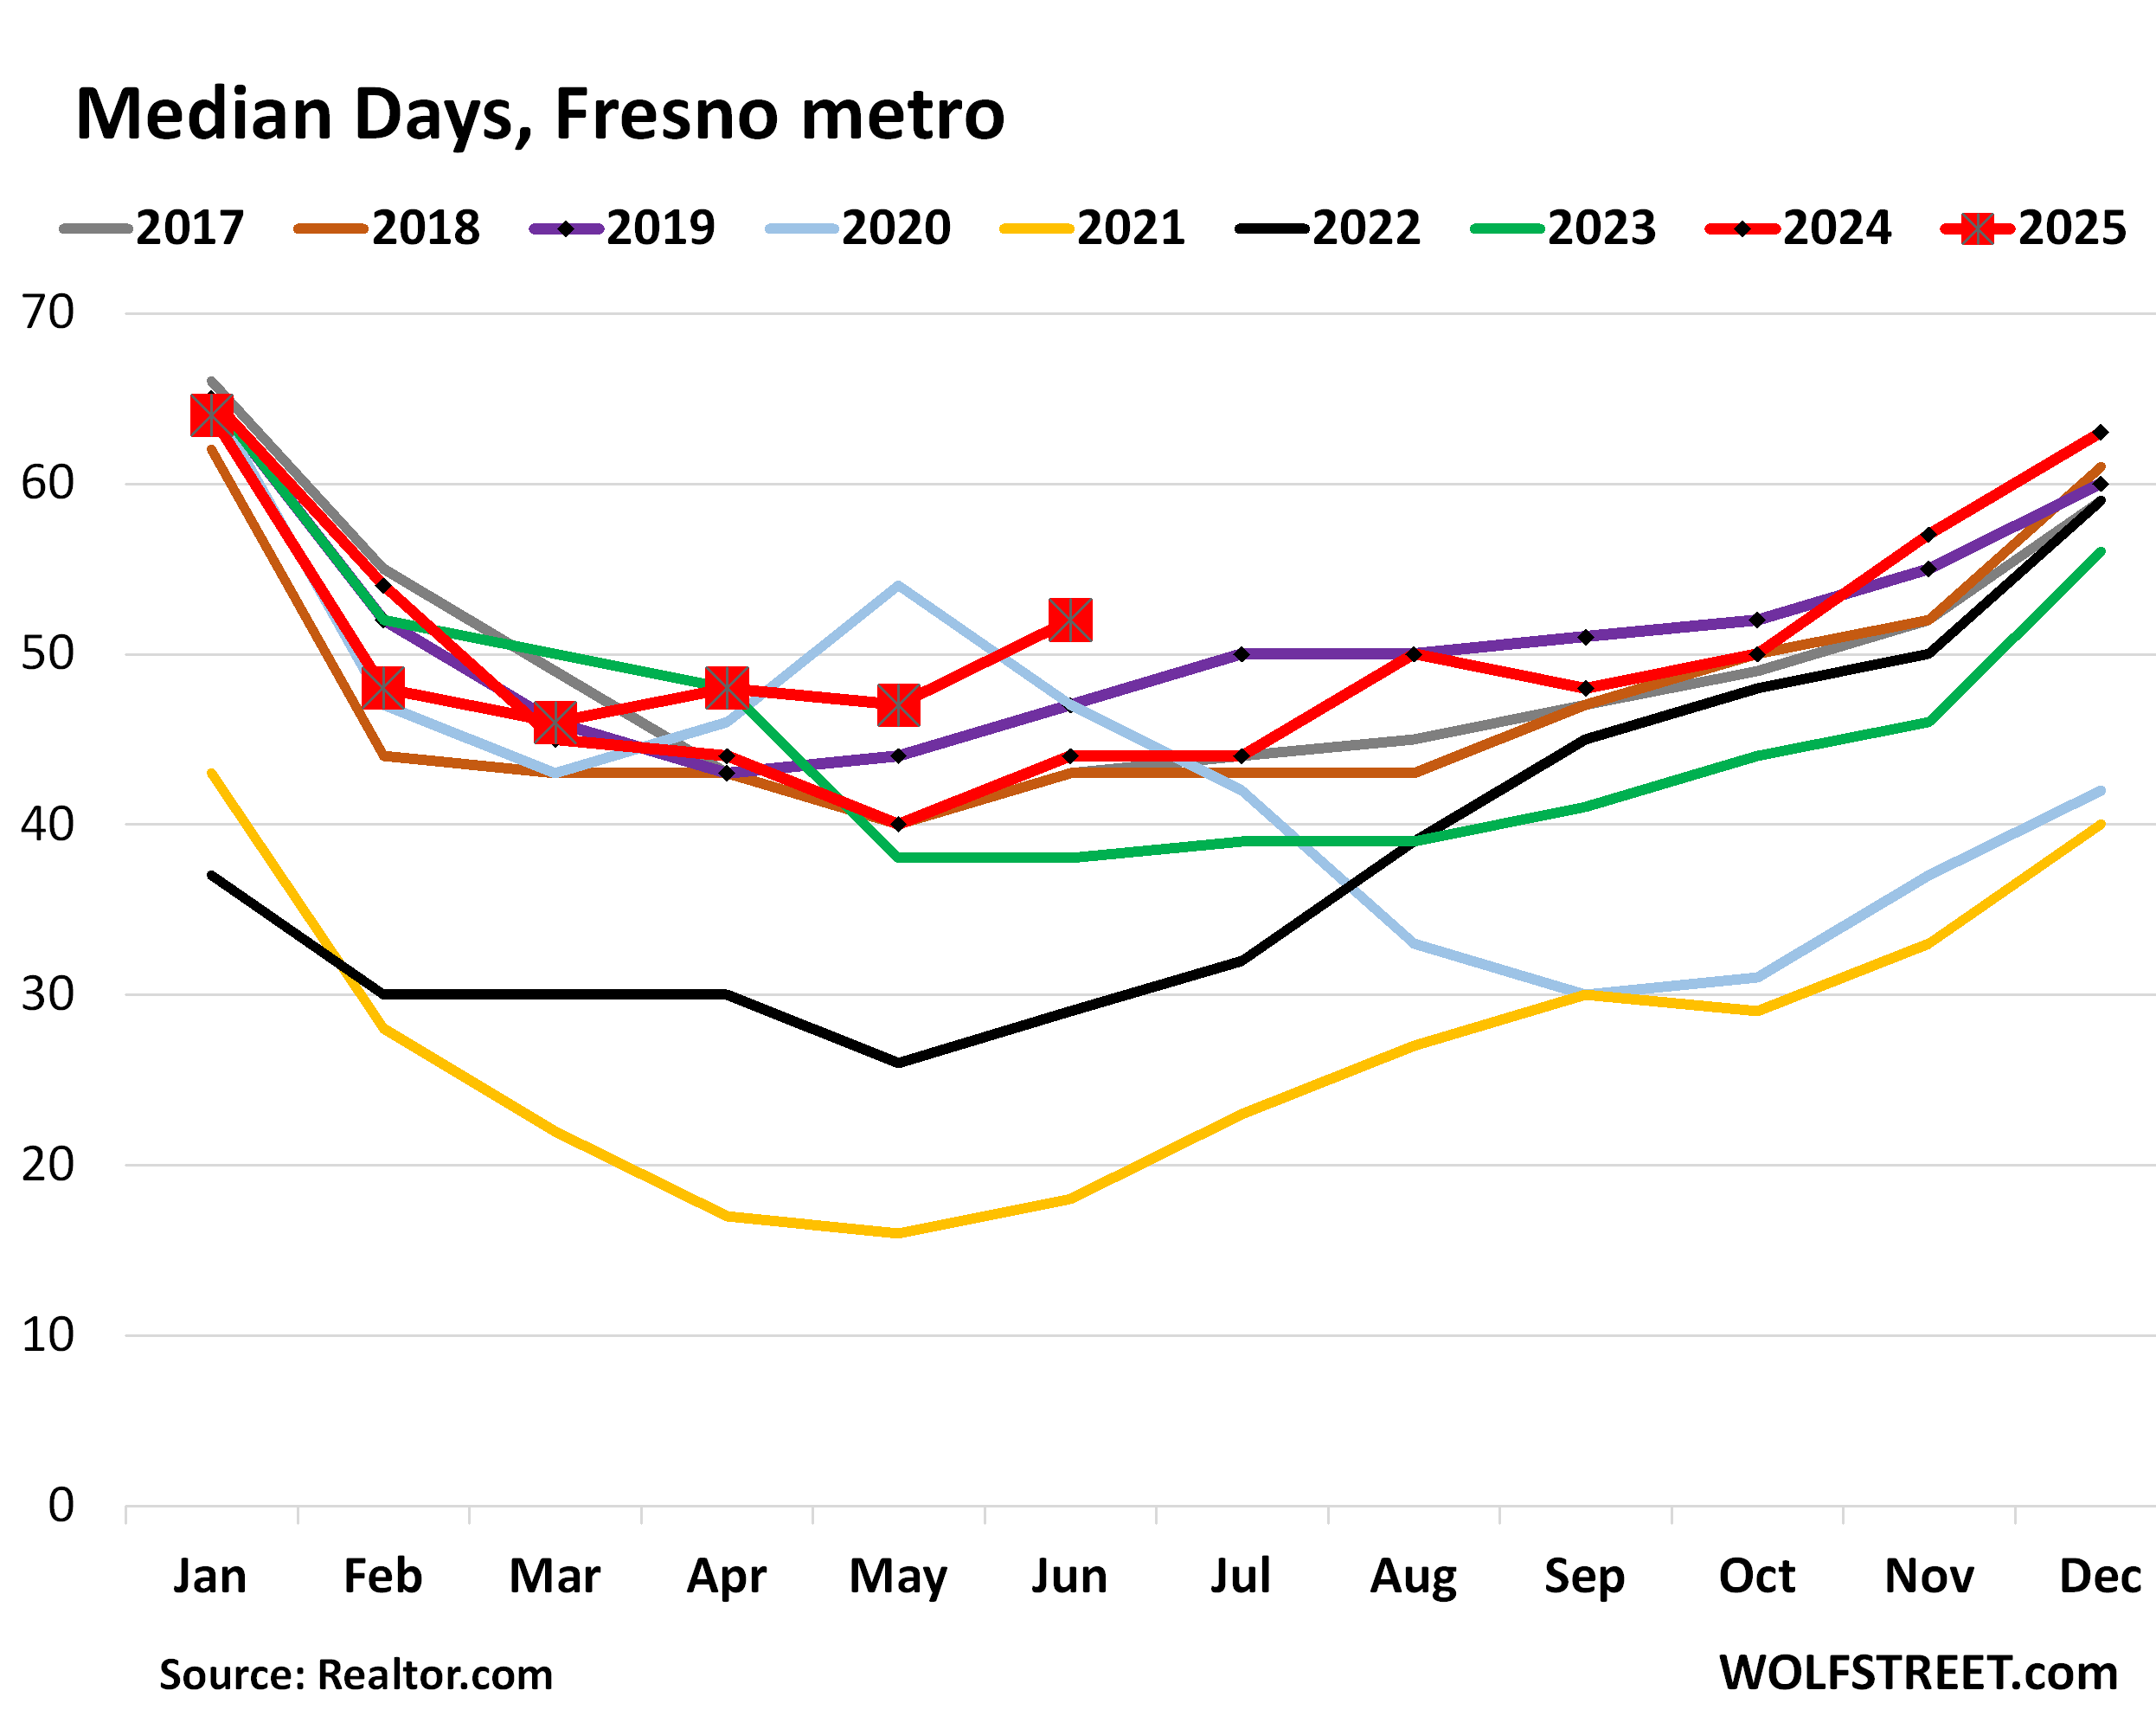
Median days on the market before the home was pulled off the market or sold jumped to 52 days, the highest for any June in the data going back to 2016, and up from 44 days a year ago.
The problem is Demand.
It’s not that sellers are suddenly putting huge numbers of homes on the market; they’re not. But what is on the market doesn’t sell because prices, which exploded during the pandemic, are now too high, and demand at those too-high prices has withered. One of the most fundamental economic principles – demand destruction by too-high prices – has set in.
Active listings have surged because demand has withered, and despite the surging trend by sellers to pull their properties off the market, as realtor.com had put it, “in frustration” because they can’t get the prices they’d been dreaming about.
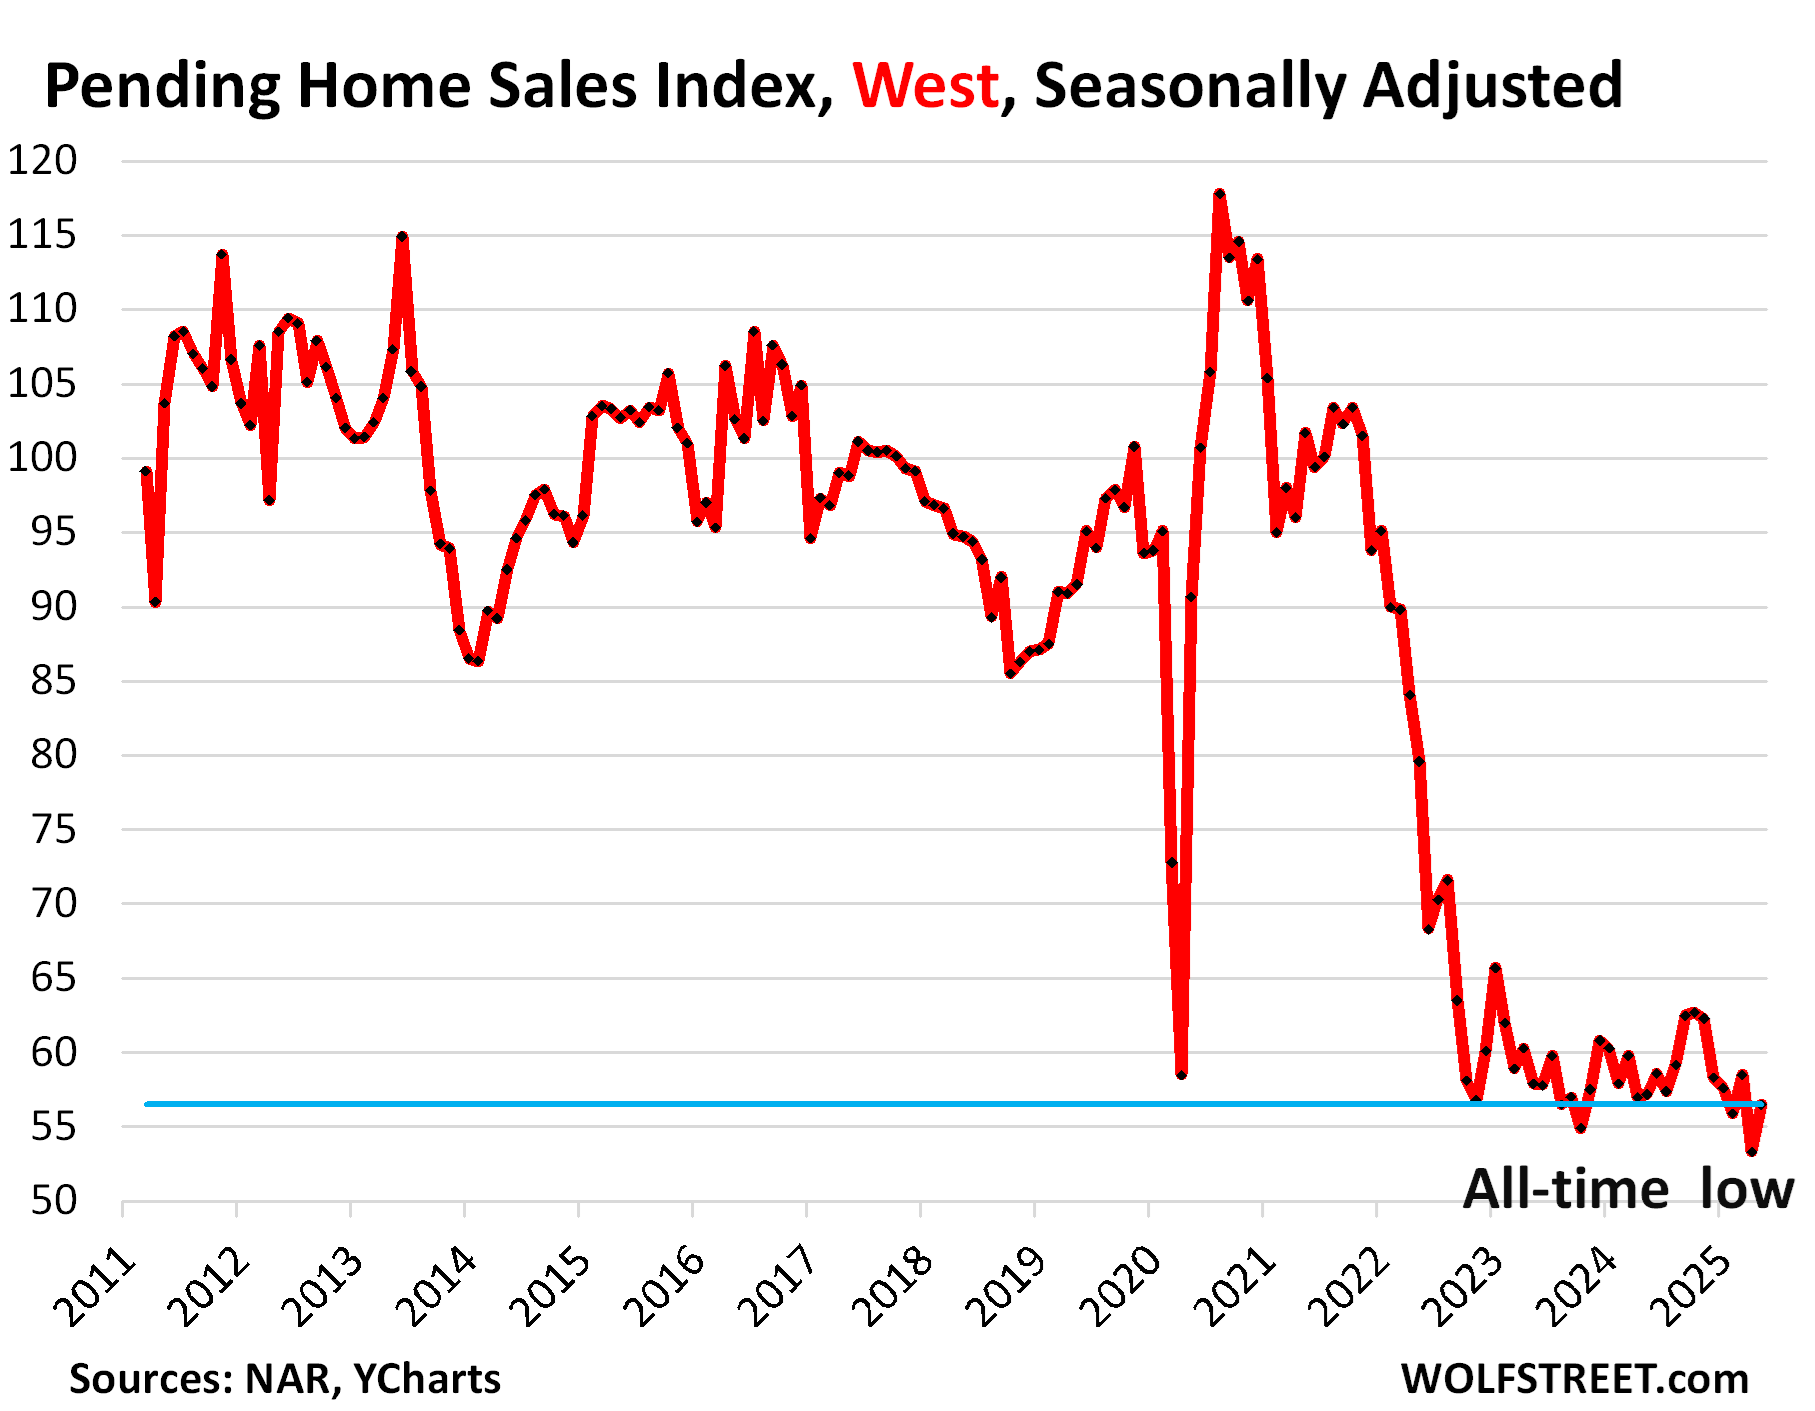
One of the measures for demand, pending sales of existing homes in the West plunged by 38% in May compared to May 2019, according to the latest data from the National Association of Realtors. April pending sales had been the lowest since at least 2011, the extent of the data.
Is Oil & Gas Right for Your Portfolio?
Crude Oil, LNG, Jet Fuel price quote
ENB Top News
ENB
Energy Dashboard
ENB Podcast
ENB Substack