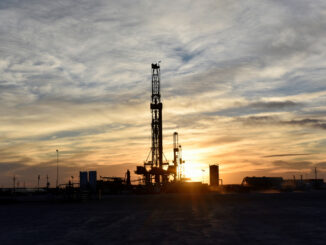
In the latest weekly update from Baker Hughes, the U.S. oil and gas rig count remained unchanged at 551 for the week ending February 13, 2026. This stability comes after three consecutive weeks of increases, with the total now sitting 37 rigs—or about 6%—below the level from the same period last year. Specifically, oil rigs decreased by three to 409, marking their lowest count since early January, while gas rigs rose by three to 133, the highest since July 2023. Miscellaneous rigs held steady at nine.
This balance reflects ongoing adjustments in drilling activity amid fluctuating commodity prices and market demands.
Weekly Oil Production Overview
U.S. crude oil production showed notable strength in the most recent data from the Energy Information Administration (EIA), covering the week ending February 6, 2026. Field production reached 13,713 thousand barrels per day (kb/d), representing a significant increase of approximately 498 kb/d from the previous week.
This surge brings output close to record highs and underscores robust operational efficiency in key producing regions. Compared to the same week a year ago, production is up, aligning with EIA forecasts for an average of 13.6 million b/d in 2026 overall.
The uptick may be influenced by favorable weather conditions and technological advancements, though the latest rig count suggests potential moderation in future growth if drilling remains flat.Rig Breakdown by Basin, State, and Type (Oil vs. Gas)The rig count provides valuable insights when broken down by major basins and states, highlighting regional trends in oil and gas exploration. Note that while the total rig count was steady week-over-week, shifts occurred within oil and gas categories. Basins are primarily classified by their dominant resource type, with oil-focused areas like the Permian seeing declines matching the drop in oil rigs, and gas-heavy basins potentially absorbing the gains.By BasinUsing the latest available detailed breakdown (adjusted for the week’s changes), here’s a summary of rigs in major U.S. basins as of February 13, 2026:
|
Basin
|
Total Rigs
|
Oil Rigs
|
Gas Rigs
|
Week-over-Week Change
|
Notes
|
|---|---|---|---|---|---|
|
Permian (primarily oil)
|
238
|
~230
|
~8
|
-3
|
Largest basin; decline aligns with overall oil rig drop.
oilprice.com
|
|
Haynesville (primarily gas)
|
50
|
~5
|
~45
|
+0 (estimated; recent gains in gas)
|
Strong gas focus; up significantly year-over-year.
|
|
Eagle Ford (mixed, oil dominant)
|
40
|
~35
|
~5
|
0
|
Stable in South Texas shale.
|
|
Williston/Bakken (oil)
|
29
|
~28
|
~1
|
0
|
North Dakota/Montana focus.
|
|
Marcellus (gas)
|
25
|
~2
|
~23
|
0
|
Key Appalachian gas play.
|
|
Utica (gas)
|
14
|
~3
|
~11
|
0
|
Ohio/Pennsylvania gas.
|
|
Cana Woodford (mixed)
|
21
|
~15
|
~6
|
0
|
Oklahoma shale.
|
|
DJ-Niobrara (mixed)
|
13
|
~10
|
~3
|
0
|
Colorado/Wyoming.
|
These figures are derived from Baker Hughes data for the prior week, with adjustments based on the reported net zero change in total rigs but shifts in oil (-3) and gas (+3).
By State
State-level data offers another layer of granularity, with Texas hosting the majority of rigs due to its overlap with the Permian and Eagle Ford. Based on recent trends and the steady total count, here’s an estimated breakdown for February 13, 2026:
|
State
|
Total Rigs
|
Oil Rigs
|
Gas Rigs
|
Week-over-Week Change
|
Notes
|
|---|---|---|---|---|---|
|
Texas
|
~260
|
~220
|
~40
|
-2 (estimated)
|
Home to Permian and Eagle Ford; likely saw oil rig drops.
|
|
New Mexico
|
~50
|
~45
|
~5
|
-1 (estimated)
|
Permian extension; minor decline.
|
|
North Dakota
|
~30
|
~28
|
~2
|
0
|
Bakken focus.
|
|
Oklahoma
|
~30
|
~20
|
~10
|
0
|
Woodford and SCOOP/STACK plays.
|
|
Louisiana
|
~40
|
~15
|
~25
|
+1 (estimated)
|
Haynesville gas gains possible.
|
|
Pennsylvania
|
~25
|
~2
|
~23
|
0
|
Marcellus/Utica gas.
|
|
Colorado
|
~15
|
~12
|
~3
|
0
|
DJ Basin.
|
|
Wyoming
|
~15
|
~13
|
~2
|
0
|
Powder River Basin.
|
|
Other States
|
~86
|
~54
|
~23
|
+2 (net)
|
Includes Ohio, California, Alaska, etc.
|
This breakdown is informed by prior week variances (e.g., Texas up 6 previously, but adjusted for this week’s oil decline) and basin overlaps.
States like Texas and New Mexico, heavily tied to oil, may have borne the brunt of the rig reductions, while gas-producing states like Louisiana could have seen slight upticks.Top Oil Companies by Stock Performance: Exploration & Production (E&P) and Oilfield ServicesFor investors eyeing the energy sector, stock performance in 2026 so far highlights standout companies in exploration & production (E&P) and oilfield services. Year-to-date (YTD) returns as of mid-February show strong gains amid rising energy demand and sector rotation. Below are the top performers in each category, based on S&P 500 and broader market data. These are not recommendations but factual highlights for consideration.
Best E&P Companies by YTD Stock Performance
E&P firms focus on finding and extracting oil and gas. Here’s a list of top performers:
|
Company (Ticker)
|
YTD Return
|
Key Notes
|
|---|---|---|
|
Texas Pacific Land Corp. (TPL)
|
+43.24%
|
Land and royalty interests in Permian; strong revenue from royalties.
finance.yahoo.com
|
|
North European Oil Royalty Trust (NRT)
|
+37.39%
|
Royalty trust with North Sea assets; high dividend appeal.
|
|
Gran Tierra Energy Inc. (GTE)
|
+27.83%
|
Focused on Colombia exploration; benefiting from global oil prices.
|
|
California Resources Corp. (CRC)
|
+24.60%
|
California onshore operations; efficiency gains driving returns.
|
|
ExxonMobil Corp. (XOM)
|
+29.45%
|
Integrated giant with strong E&P portfolio; up 39% over 12 months.
nerdwallet.com
|
These companies have outperformed amid higher oil prices and production optimism.
Best Oilfield Services Companies by YTD Stock Performance
|
Company (Ticker)
|
YTD Return
|
Key Notes
|
|---|---|---|
|
Valaris Ltd. (VAL)
|
+73.13%
|
Offshore drilling; rebounding demand for rigs.
finance.yahoo.com
|
|
Liberty Energy Inc. (LBRT)
|
+39.11%
|
Fracking and completion services; shale-focused.
|
|
ProFrac Holding Corp. (ACDC)
|
+37.92%
|
Hydraulic fracturing; benefiting from gas activity.
|
|
TechnipFMC PLC (FTI)
|
+36.97%
|
Subsea and surface technologies; international exposure.
|
|
Helix Energy Solutions Group Inc. (HLX)
|
+34.93%
|
Well intervention and robotics; offshore services.
|
Additional notables include Halliburton (HAL) at +26.10% and Schlumberger (SLB) at +25.2%, driven by higher drilling and tech demand.
Investors should monitor these amid AI-driven energy needs and grid expansions.In summary, while the rig count holds steady, underlying shifts in oil and gas activity, robust production, and strong stock performances signal a dynamic start to 2026 for the energy sector. Stay tuned to Energy News Beat for more updates.
Get your CEO on the podcast: https://sandstoneassetmgmt.com/media/
Is oil and gas right for your portfolio? https://sandstoneassetmgmt.com/invest-in-oil-and-gas/