Germany is an example of what interest-rate repression and QE do to home prices, and what happens when raging inflation causes those policies to be reversed.
By Wolf Richter for WOLF STREET.
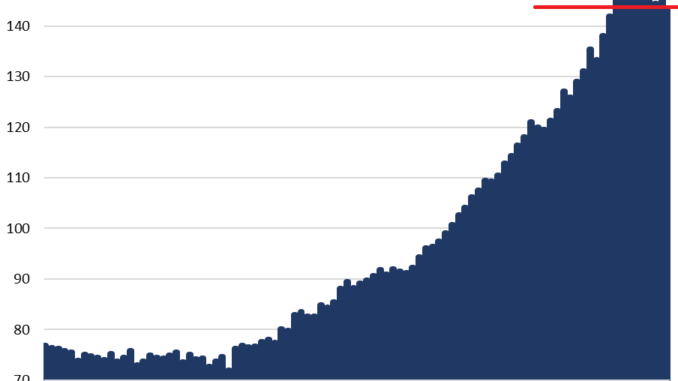
Prices of existing homes in Germany – used single-family houses, duplexes, and condos – that were sold in Q4 have now dropped by 14% from the peak in Q2 2022, according to data from the German statistical agency Destatis today. The index has now unwound all the gains since Q4 2020. These are the biggest drops in the data going back to 2000.
Quarter to quarter, prices dropped by another 2.1%, the sixth quarter in a row of declines. Year-over-year, priced are down 7.8%.
Germany’s housing bubble – inflated by the ECBs absurd negative interest rate policies and crazed mega-QE – has turned into a housing bust after raging inflation forced the ECB to reverse course. The ECB has by now shed €2 trillion of its QE assets. It also has hiked its deposit rate to 4.0% (up from -0.5% through mid-2022) and its main refinancing rate to 4.5%. Inflation in the Eurozone has come down a lot, as energy prices have plunged, and some goods prices have dropped, but it remains high in services where it started showing the first signs of rebounding.
Prices of new homes – new single-family houses, duplexes, and condos – dropped by 1.0% in the quarter, for an annual decline of 3.2%, and are down by 4.5% from the peak in Q3 2022.
The index has now unwound the gains since Q4 2021. Between 2010 and the peak in 2022, prices had spiked by 80%.
Note that sales of new homes is a much smaller market than sales of existing homes.
Prices of single-family houses and duplexes have drop more than condo prices in 2023:
Prices within cities overall:
Single-family houses and duplexes: -11.0% YoY, and -2.7% QoQ
Condos: -7.1% YoY, and -1.9% QoQ
Prices in the seven big metros (Berlin, Hamburg, Munich, Cologne, Frankfurt, Stuttgart, and Dusseldorf):
Single-family houses and duplexes: -9.1% YoY, and -1.5% QoQ
Condos: -5.8% YoY, and -1.7% QoQ.
Prices in thinly populated and rural areas:
Single-family houses and duplexes: -6.9% YoY, and -2.1% QoQ
Condos: -2.8% YoY, and -3.1% QoQ.
Home prices and the ECB’s balance sheet.
The overall home price index, which combines new and used single-family houses, duplexes, and condos, fell by 2.0% in Q4 from Q3, and is down by 12.6% from its peak in Q2 2022.
We compare this overall home price index to the ECB’s balance sheet.
On the way up from 2008 to the peak in 2022, the home price index soared by 100%. But the ECB’s balance sheet ballooned by 309% over the same period.
On the way down, the home price index has dropped by 12.6% from the peak, while the ECB’s balance sheet has dropped by 21.7% (by €2.0 trillion) from the peak.
This shows that the movements are not proportional, but they’re both big movements, and they’re going in the same direction. In creating the chart, we have put both in the same space but on different scales: the home price index in red (left scale), and the ECB’s total assets in trillions of euros in purple (right scale), with their bottoms and tops roughly aligned.
It shows the reality of QE: Interest rate repression through policy rates and through QE causes raging home price inflation. Similarly, higher short-term rates accompanied by QT wring some of the home price inflation back out of the housing market.


