Here’s why: New house prices -18% from peak, back to Nov 2021, further sweetened by mortgage-rate buydowns.
By Wolf Richter for WOLF STREET.
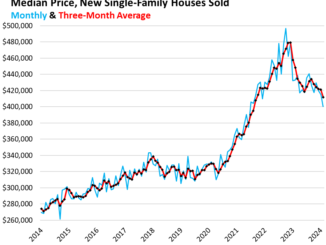
The median-price of new single-family houses at all stages of construction that were sold in March rose to $430,700, which was down by 1.9% from a year ago and by 18.2% from the peak in October 2022, according to data from the Census Bureau today (blue line in the chart below).
The three-month moving average median price – which irons out some of the very volatile data and includes all revisions – edged up to $419,500, which was down 3.5% year-over-year, down 2.7% from March 2022, down 11.8% from its peak in December 2022, and back where it had first been in November 2021 (red).
These are contract prices that do not include the costs of mortgage-rate buydowns that homebuilders use to stimulate sales in this market of 7%-plus mortgages. Mortgage-rate buydowns lower monthly payments but do not lower the contract price of the house. Prices also don’t include other incentives, such as free upgrades. And homebuilders are building smaller homes at lower price points, with less expensive amenities, to meet the market and make deals. And it’s working; as we’ll see in a moment, sales have been decent, while sales of existing homes are still getting clobbered by high asking prices and high mortgage rates.
Price difference between new and used houses.
Homeowners have totally opened up the market for homebuilders by clinging to their hopes that mortgage rates will “soon” drop back to 3% (good luck!), and that therefore prices will soon start to spike again, and that they can ride up this market with their vacant house they’d moved out of some time ago but haven’t put on the market yet.
So prices of new and resale single-family houses have moved close together, they’re within a hair. And with mortgage-rate buydowns, the monthly payments can be lower on a new house compared to an existing house, as homebuilders have been aggressively competing with these homeowners, and have said so in their earnings calls.
The price difference in dollars. The national median price of new single-family houses has fallen much more than the national median price of existing single-family houses (via the National Association of Realtors).
To iron out the large ups and downs and some of the seasonal differences, we look at the six-month moving average of the median price of both, new single-family houses (red) and existing single-family houses (green).
The price difference has shrunk to a range between around 5% and 7%, the lowest since 2006, just as the Housing Bust was taking on momentum:
The difference in percentages. The median price of new houses in March was only 7.2% higher than the median price of existing houses (6-month moving averages for both), not including the mortgage-rate buydowns and other incentives.
The narrowing price differences also occurred during the early phases of the Housing Bust, as homebuilders slashed their prices, and homeowners were slow to follow. But eventually they did, until prices of used homes fell so far that they became competitive again with new houses as the difference widened again.
So sales of new houses held up while sales of existing houses plunged.
Sales of new single-family houses: The seasonally adjusted annual rate of sales rose to 693,000 new houses in March, up by 8.3% from a year ago and down by only 1.3% from March 2019. So not anything fancy, but decent given the environment of 7%-plus mortgage rates.
But sales of existing single-family houses plunged by 19% from March 2019, according to data from the National Association of Realtors.
This divergence of sales illustrates the effectiveness of lower prices and mortgage-rate buydowns that homebuilders have pursued though it squeezed their profit margins from the big-fat levels during the free-money era.
Inventory for sale of new houses at all stages of construction rose to 465,000 houses, the highest since August-October 2022, and beyond that the highest since 2008. This amounts to 7 months of supply at the March level of sales. There is more than plenty of inventory for sale: