State of housing markets in New York, Los Angeles, San Diego, San Francisco, San Jose, Chicago, Dallas-Ft. Worth, Houston, Washington D.C., Philadelphia, Miami, Atlanta, Boston, Phoenix, Seattle, Tampa, Denver, Baltimore, Charlotte, Portland, Austin, Las Vegas, Kansas City…
By Wolf Richter for WOLF STREET.
What the housing market faces are mortgage rates that have reverted back to the old normal range of around 7%, the lowest demand for existing homes since 1995 amid rapidly rising active listings, and aggressive competition from homebuilders that have built up the largest inventory for sale of completed single-family houses since 2009, and they’re trying to sell those houses by cutting prices and throwing incentives at them, including mortgage-rate buydowns. And unlike sales of existing homes, sales of new homes have held up, and homebuilders, by sacrificing profit margins, have gained big chunks of market share.
But home prices don’t move the same in all markets. The markets we’re looking at here are all large, often multi-county Metropolitan Statistical Areas (MSAs), some of them spanning portions of several states, often grouping together several big cities and many suburbs, smaller towns, and bedroom communities. Each of these markets moves to its own drummer. In some of these markets, prices have dropped sharply from the peaks in mid-2022; in others, they rose until recently.
In some markets, there is essentially no seasonality to home prices, just peaks and troughs that occur at various periods of the year.
In other markets, there is distinct seasonality in home prices. Seasonal price changes must happen in a similar way in the same months every year, or they’re not seasonal. The charts below, which are based on raw, not-seasonally-adjusted prices of mid-tier homes in each market, demonstrate that absence or presence of seasonality.
Price declines from prior month: Prices of single-family houses, condos, and co-ops fell in December from November in 30 of the 33 of the large metros on our list here. In the remaining 3 metros, prices were unchanged in December from October (the metros of Washington D.C., San Jose, and Salt Lake City).
By Metropolitan Statistical Area (MSA), the top month-to-month price declines with drops of -0.3% or bigger:
- Tampa, FL: -0.9%
- Austin, TX: -0.8%
- Tucson, AZ: -0.7%
- Atlanta, GA: -0.7%
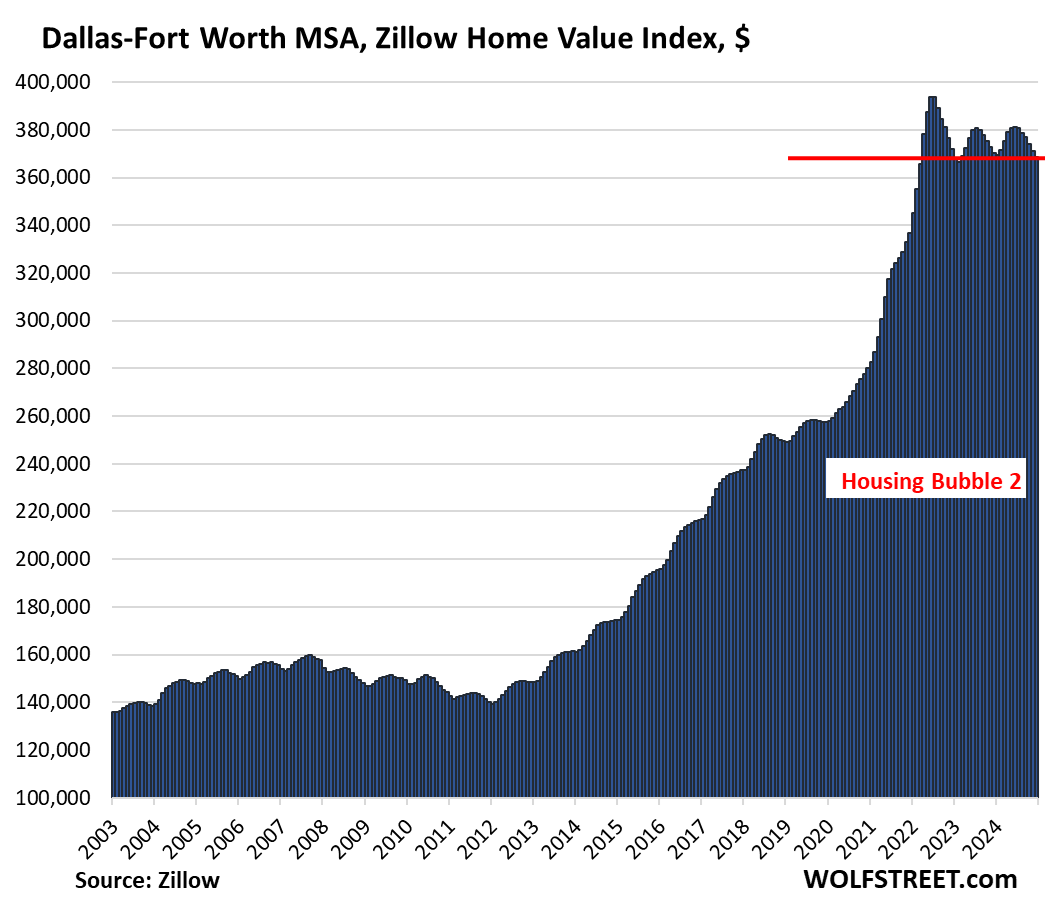
- Dallas, TX: -0.6%
- Milwaukee, WI: -0.6%
- Orlando, FL: -0.6%
- San Antonio, TX: -0.5%
- Phoenix, AZ: -0.5%
- Boston, MA: -0.5%
- Miami, FL: -0.4%
- Raleigh, NC: -0.4%
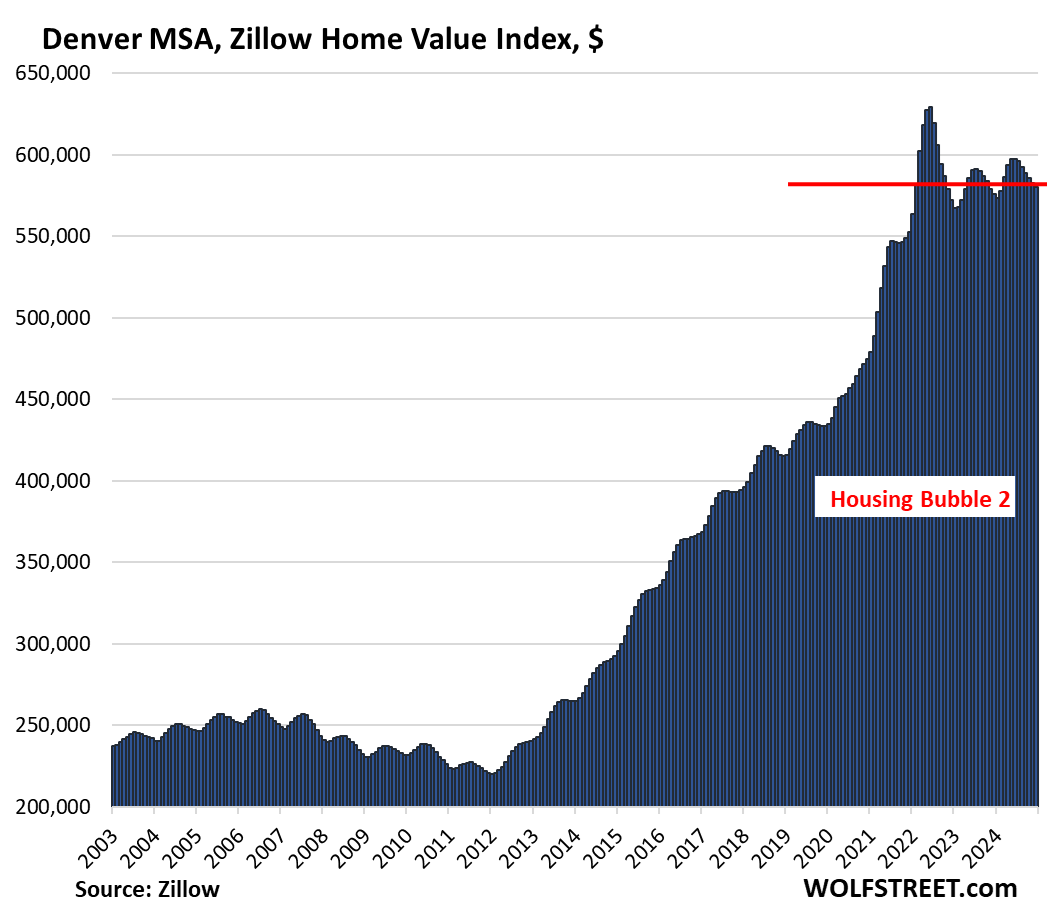
- Denver, CO: -0.4%
- Charlotte, NC: -0.4%
- San Francisco, CA: -0.4%
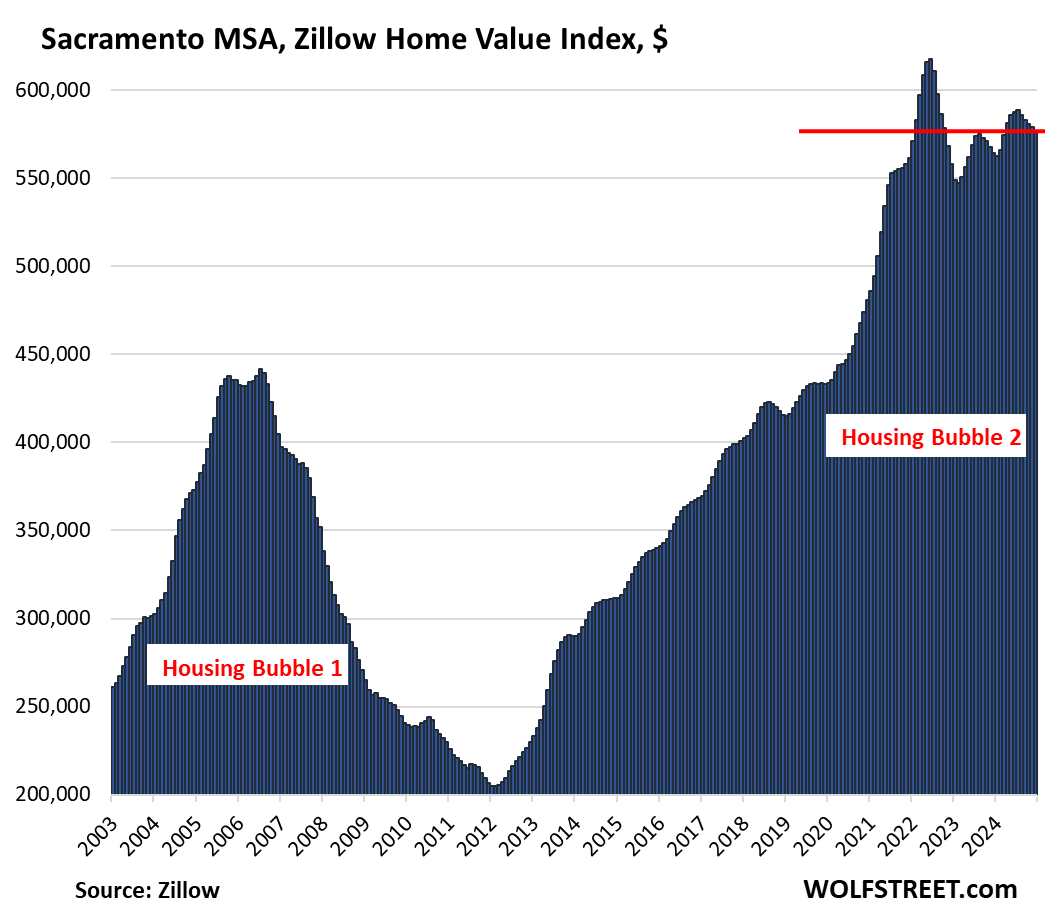
- Sacramento, CA: -0.4%
- Houston, TX: -0.3%
- San Diego, CA: -0.3%
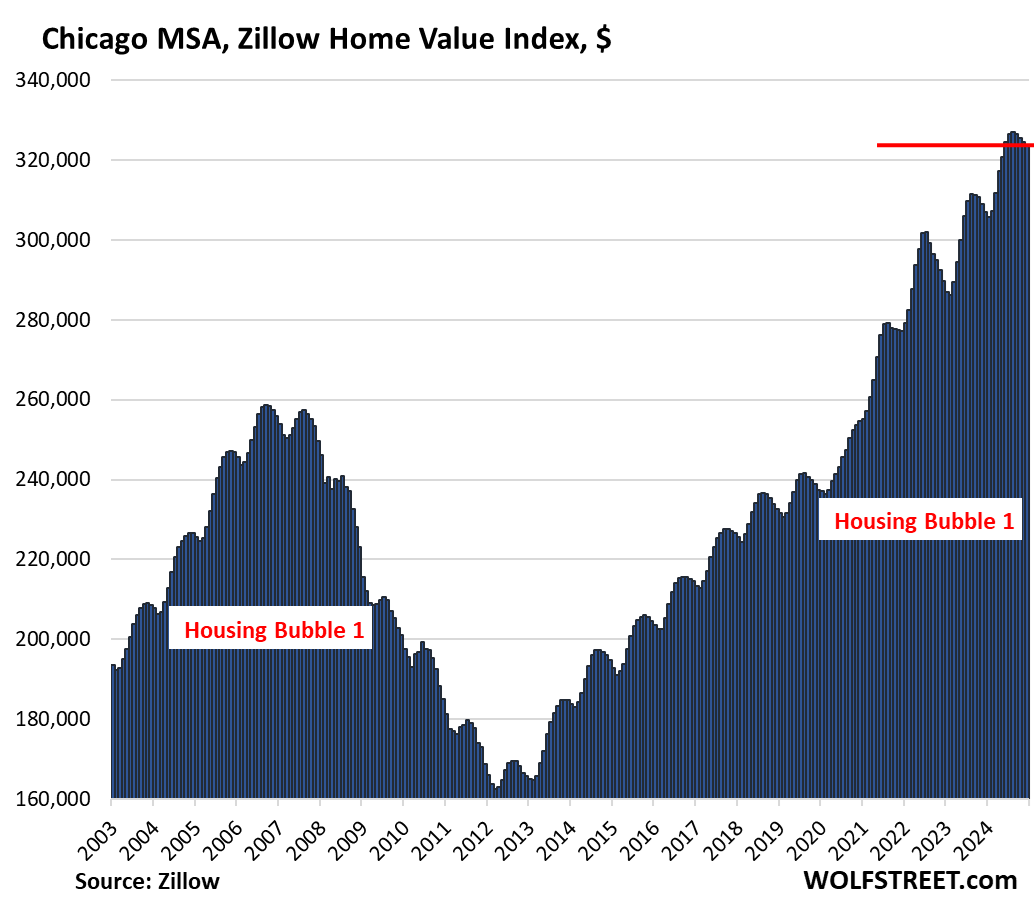
- Chicago, IL: -0.3%
- Minneapolis, MN: -0.3%
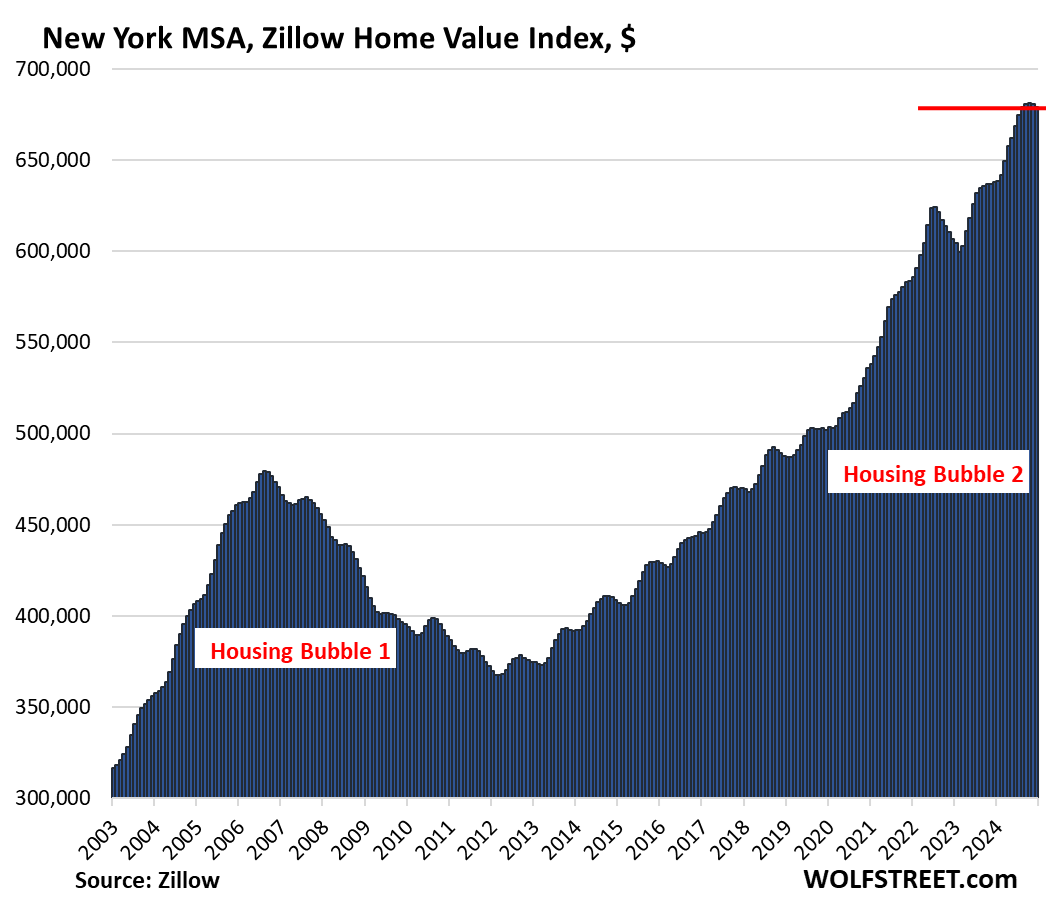
- New York, NY: -0.3%
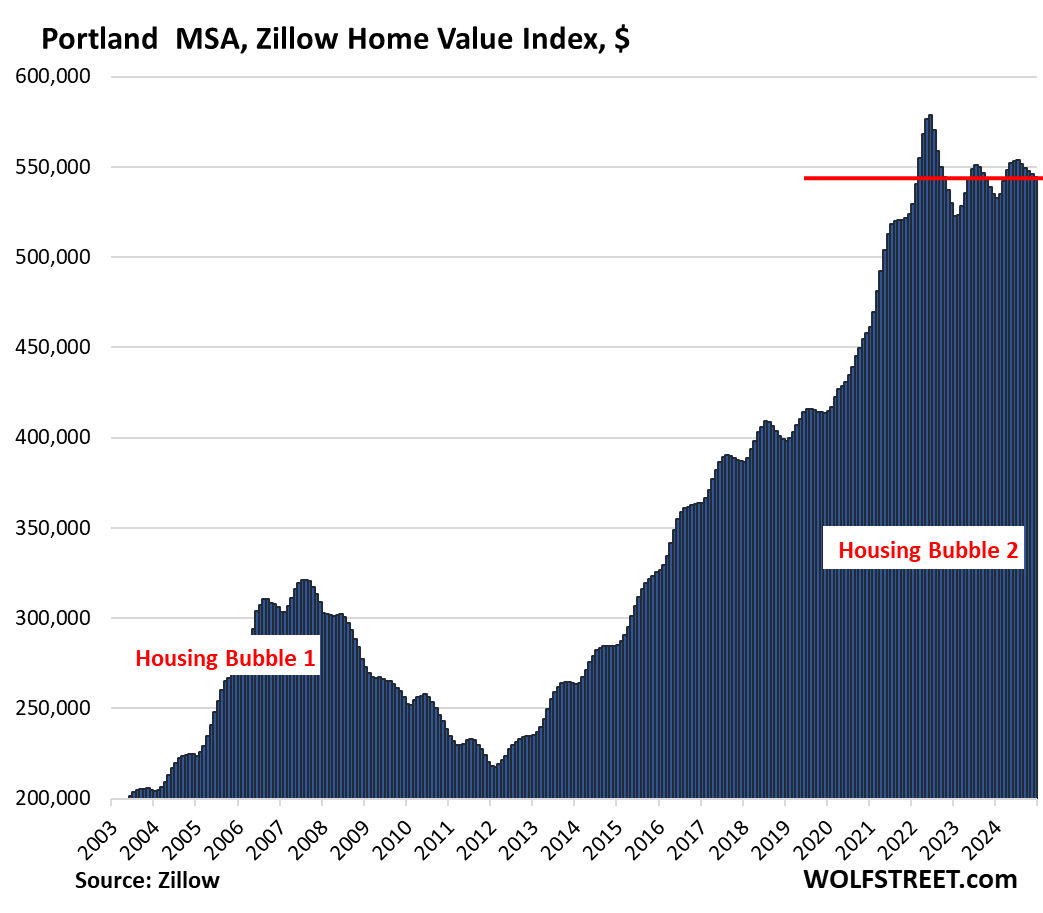
- Portland, OR: -0.3%
- Cleveland, OH: -0.3%
- Birmingham, AL: -0.3%
21 Metros of 33 are down from their 2022 peaks: In 21 of the 33 MSAs, home prices were down from their respective peaks in mid-2022, with two of them down by the double digits: the metros of Austin (-22.6%) and San Francisco (-10.6); and two of them down about 9%: Phoenix (-9.2%) and San Antonio (-8.7%).
No New highs in December: No MSA here of the 33 MSAs made a new high in December. Even prices in the New York City metro dipped for the second month, after the huge uninterrupted run-up.
All data is from the “raw” mid-tier Zillow Home Value Index (ZHVI), released today. The ZHVI is based on millions of data points in Zillow’s “Database of All Homes,” including from public records (tax data), MLS, brokerages, local Realtor Associations, real-estate agents, and households across the US. It includes pricing data for off-market deals and for-sale-by-owner deals. Zillow’s Database of All Homes also has sales-pairs data.
To qualify for this list, the MSA must be one of the largest by population, and must have had a ZHVI of at least $300,000 at the peak. The metros of New Orleans, Oklahoma City, Tulsa, Cincinnati, Pittsburgh, etc. don’t qualify for this list because their ZHVI has never reached $300,000, despite massive run-ups of home prices in recent years, but from very low levels.
The Most Splendid Housing Bubbles in America series began in 2017 to document visually metro-by-metro the surge in home prices fueled by the Fed’s years of interest rate repression and QE that included the purchases of mortgage-backed securities, ultimately pushing mortgage rates below 3%.
But in 2022, the Fed changed course, mortgage rates have reverted to the old normal range of around 7%, as the Fed has shed $2.1 trillion in assets under its QT program.
The first 21 metros here are all below their highs in mid-2022, sorted by magnitude of decline.
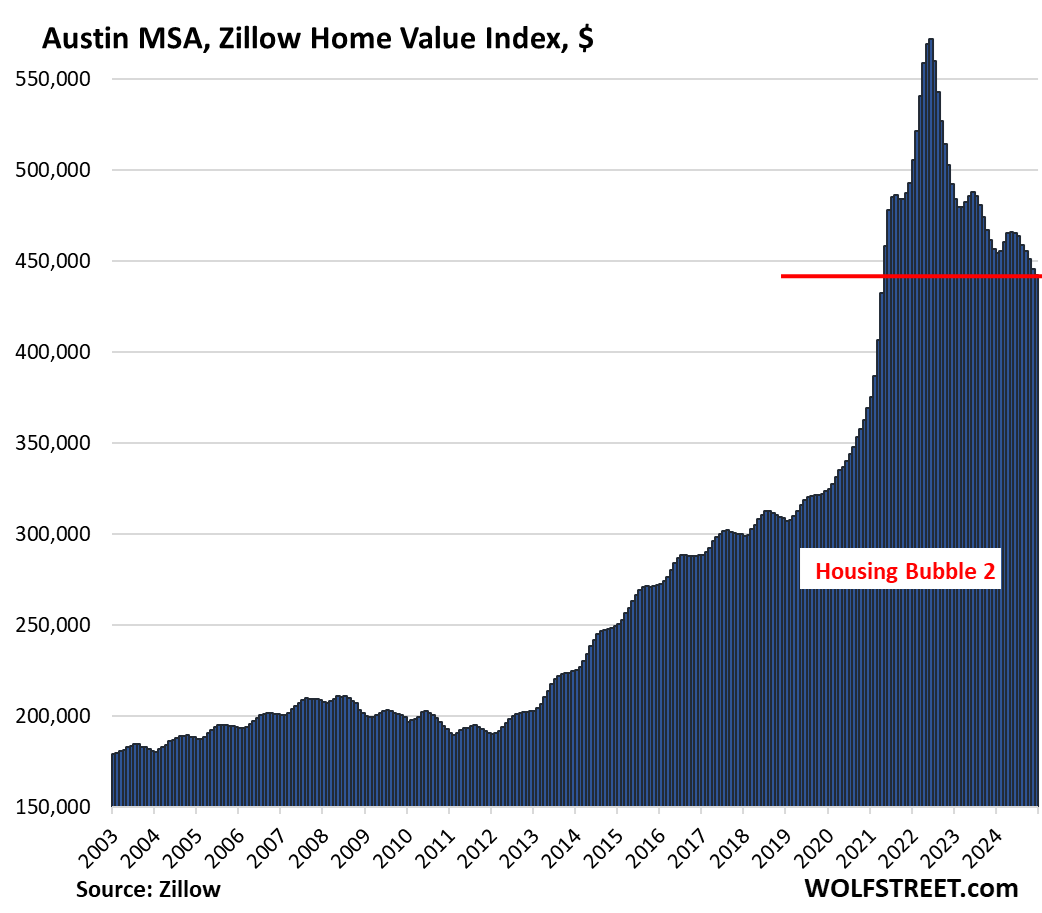
| Austin MSA, Home Prices | |||
| From Jun 2022 peak | MoM | YoY | Since 2000 |
| -22.7% | -0.8% | -3.2% | 156% |
The index for the Austin MSA – includes the five counties of Travis (Austin-Round Rock), Williamson, Hays, Caldwell, and Bastrop – has dropped to the lowest level since April 2021.
The price spikes in 2021 had been nuts. Over the six months February-July 2021, prices had spiked by nearly 30%, which were then followed by additional price spikes through June 2022, after which it all started coming apart. This kind of speculative mania should never occur in a housing market. But the Fed’s interest rate repression, including trillions of dollars of QE, turned housing markets into absurdities.
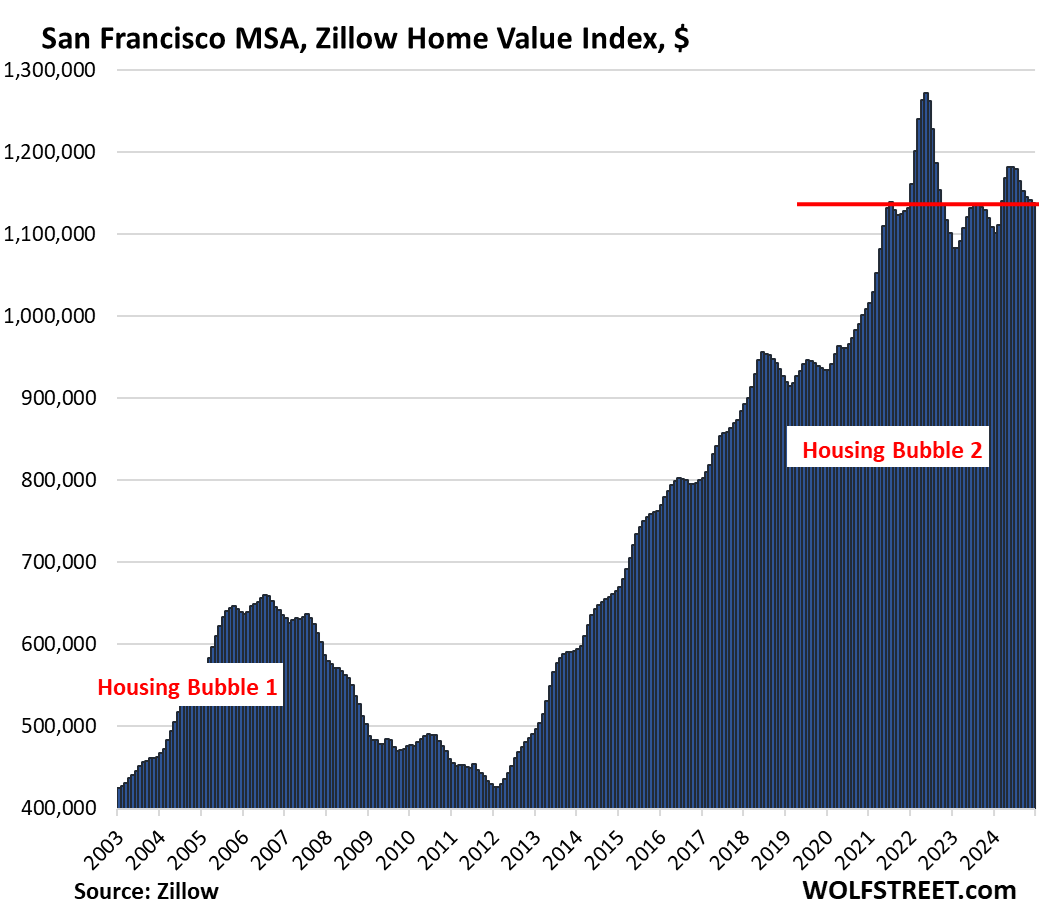
| San Francisco MSA, Home Prices | |||
| From May 2022 peak | MoM | YoY | Since 2000 |
| -10.6% | -0.4% | 2.7% | 290% |
Prices in the San Francisco MSA – which includes San Francisco, Oakland, much of the East Bay, much of the North Bay, and goes south on the Peninsula through San Mateo County – are back where they’d first been in July 2021:
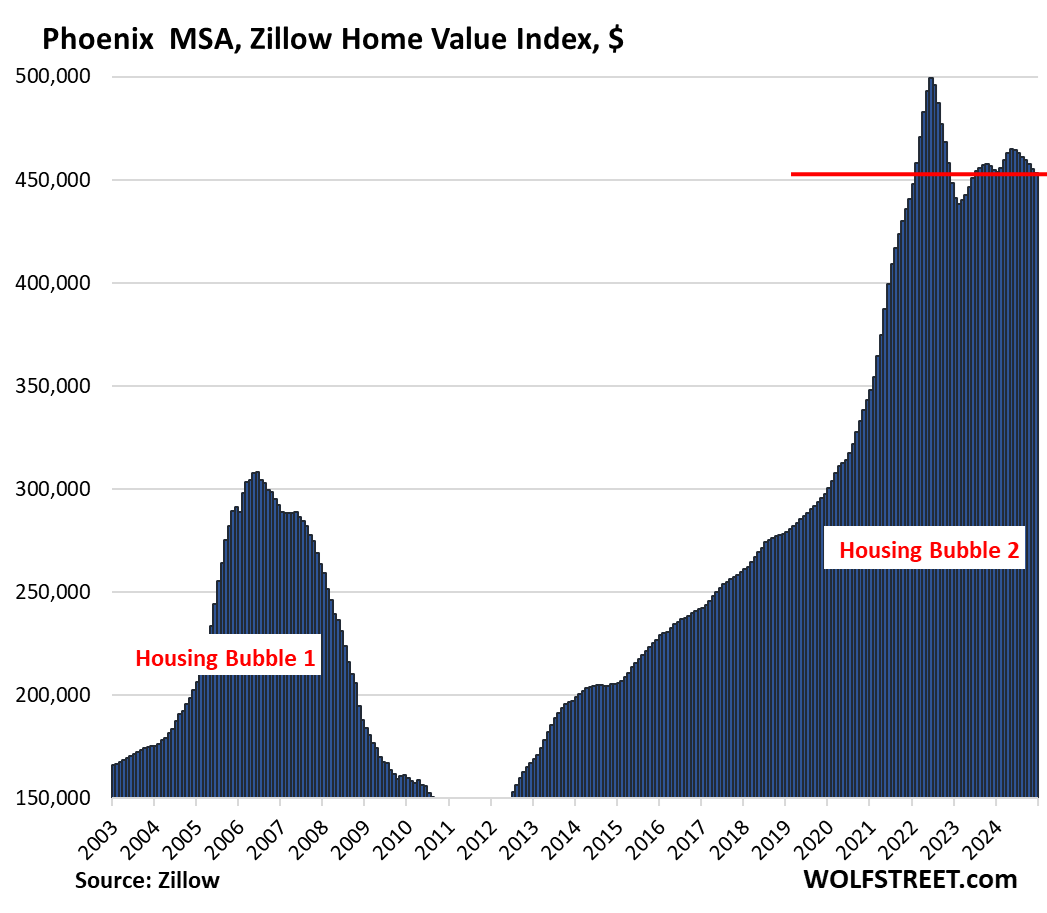
| Phoenix MSA, Home Prices | |||
| From Jun 2022 peak | MoM | YoY | Since 2000 |
| -9.2% | -0.5% | -0.3% | 219% |
Prices are back where they’d first been in February 2022:
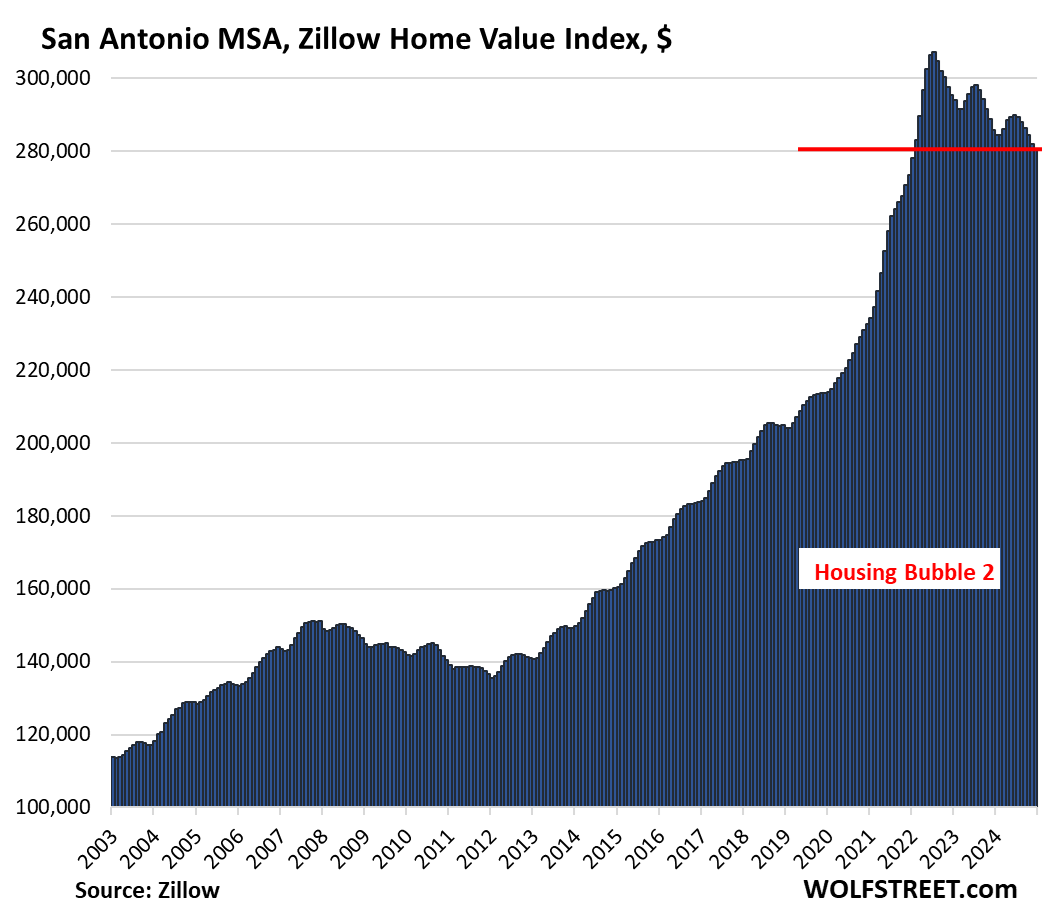
| San Antonio MSA, Home Prices | |||
| From Jul 2022 peak | MoM | YoY | Since 2000 |
| -8.7% | -0.5% | -1.8% | 147.5% |
Prices in San Antonio have dropped to the lowest level since February 2022.
| Denver MSA, Home Prices | |||
| From Jun 2022 peak | MoM | YoY | Since 2000 |
| -7.8% | -0.4% | 0.8% | 211% |
Prices are back where they’d first been in February 2022.
| Sacramento MSA, Home Prices | |||
| From July 2022 peak | MoM | YoY | Since 2000 |
| -6.7% | -0.4% | 2.1% | 244.8% |
| Dallas-Fort Worth MSA, Home Prices | |||
| From Jun 2022 peak | MoM | YoY | Since 2000 |
| -6.4% | -0.6% | -0.4% | 192% |
| Portland MSA, Home Prices | |||
| From May 2022 peak | MoM | YoY | Since 2000 |
| -6.0% | -0.3% | 1.8% | 217% |
Prices are back where they’d first been in February 2022.
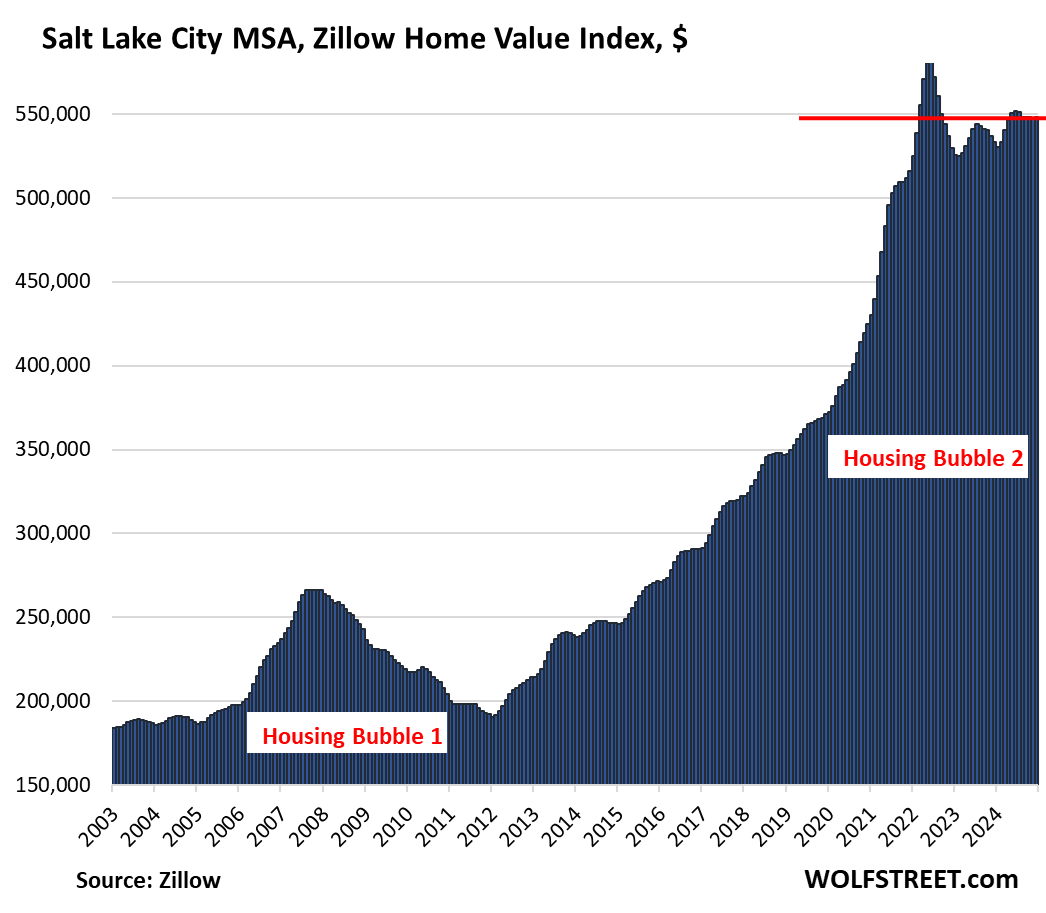
| Salt Lake City MSA, Home Prices | |||
| From July 2022 peak | MoM | YoY | Since 2000 |
| -5.7% | 0.0% | 2.8% | 214% |
Over the past four months, prices have remained essentially unchanged and are back where they’d first been in March 2022:
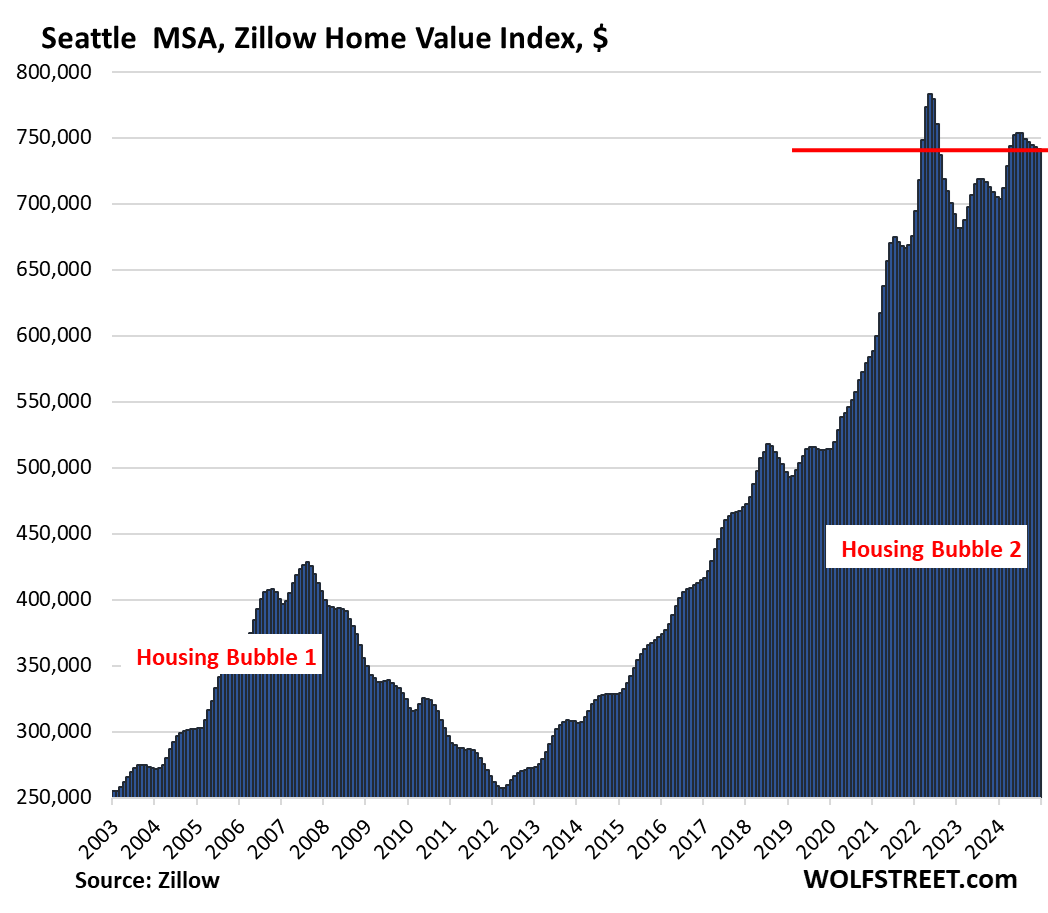
| Seattle MSA, Home Prices | |||
| From May 2022 peak | MoM | YoY | Since 2000 |
| -5.3% | -0.2% | 5.1% | 238% |
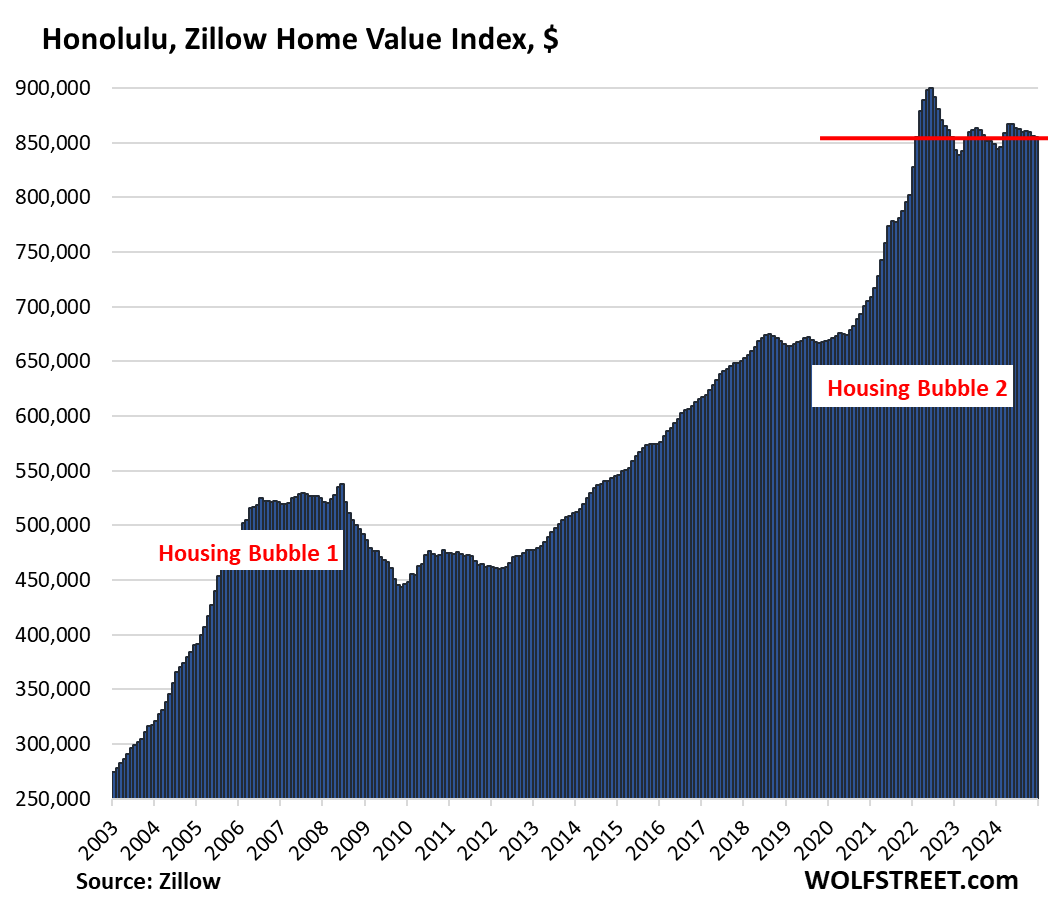
| Honolulu, Home Prices | |||
| From Jun 2022 peak | MoM | YoY | Since 2000 |
| -5.0% | -0.2% | 0.7% | 280% |
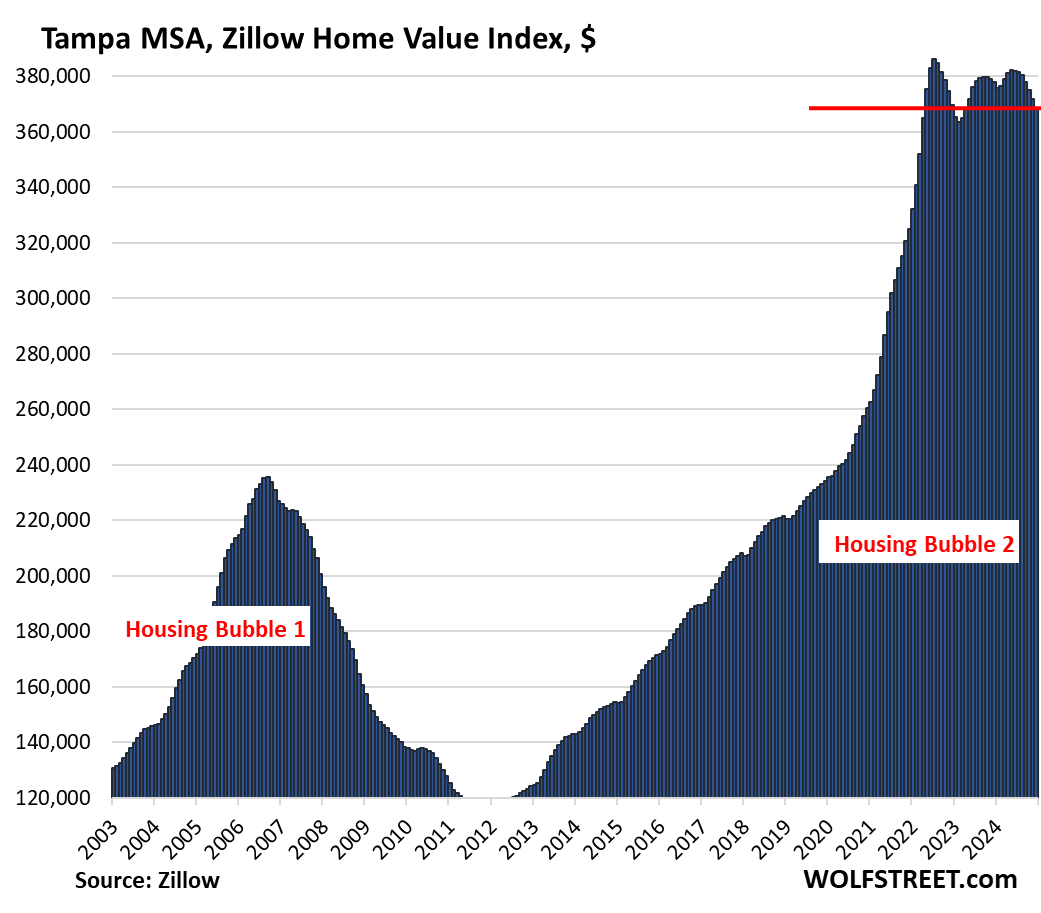
| Tampa MSA, Home Prices | |||
| From Jul 2022 peak | MoM | YoY | Since 2000 |
| -3.9% | -0.6% | -0.9% | 210% |
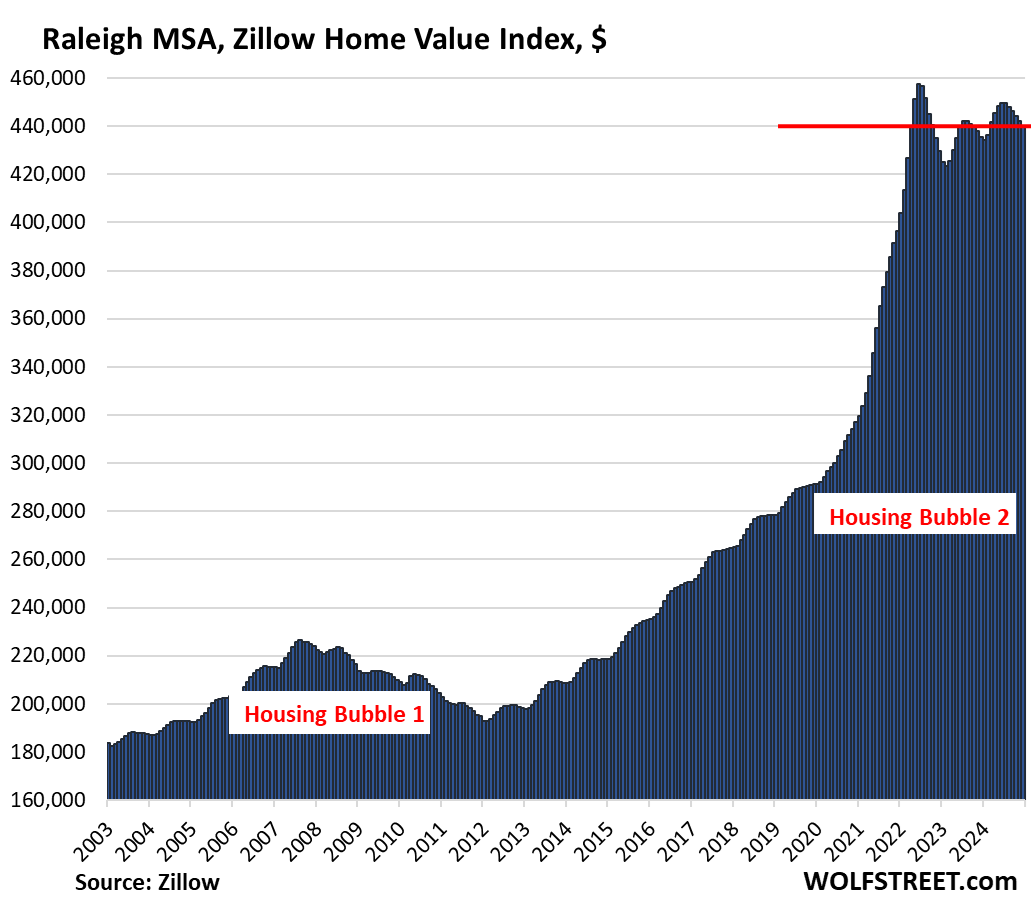
| Raleigh MSA, Home Prices | |||
| From July 2022 peak | MoM | YoY | Since 2000 |
| -3.8% | -0.4% | 1.1% | 157% |
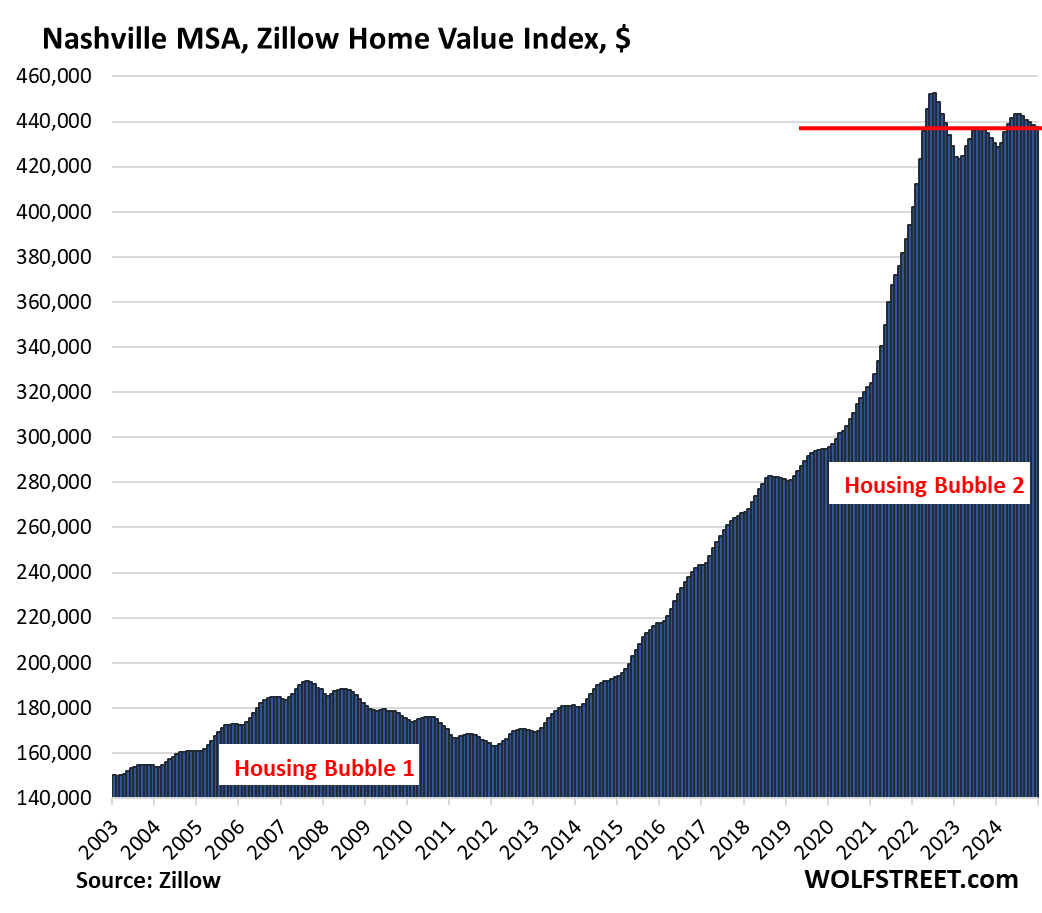
| Nashville MSA, Home Prices | |||
| From July 2022 peak | MoM | YoY | Since 2000 |
| -3.4% | -0.2% | 1.7% | 217% |
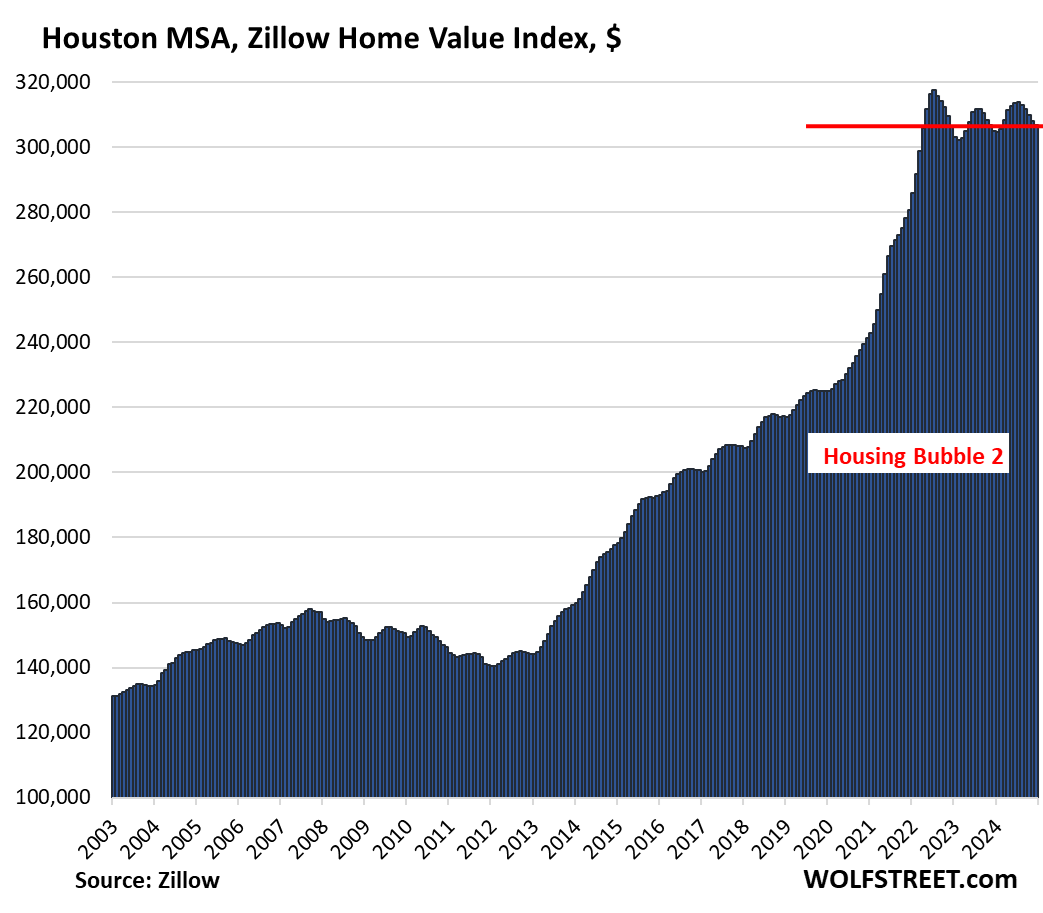
| Houston MSA, Home Prices | |||
| From Jul 2022 peak | MoM | YoY | Since 2000 |
| -3.4% | -0.3% | 0.6% | 150% |
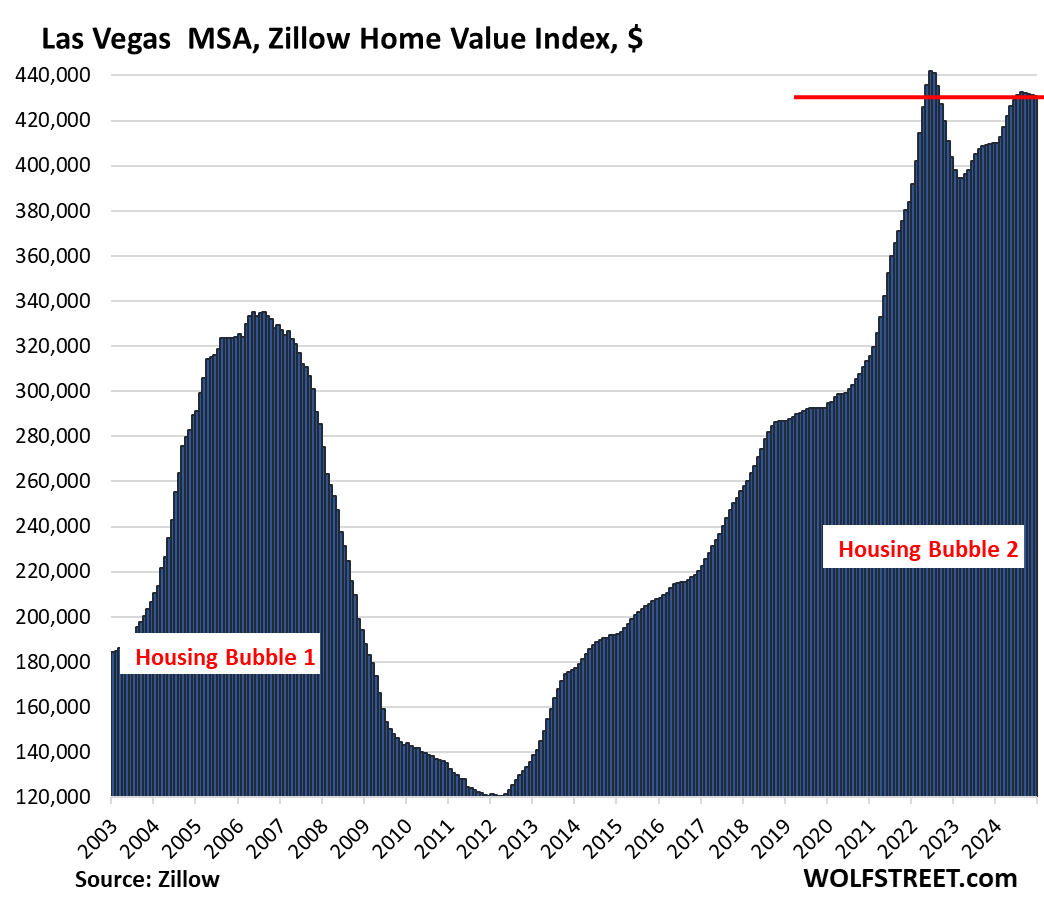
| Las Vegas MSA, Home Prices | |||
| From June 2022 peak | MoM | YoY | Since 2000 |
| -2.5% | -0.1% | 5.1% | 179% |
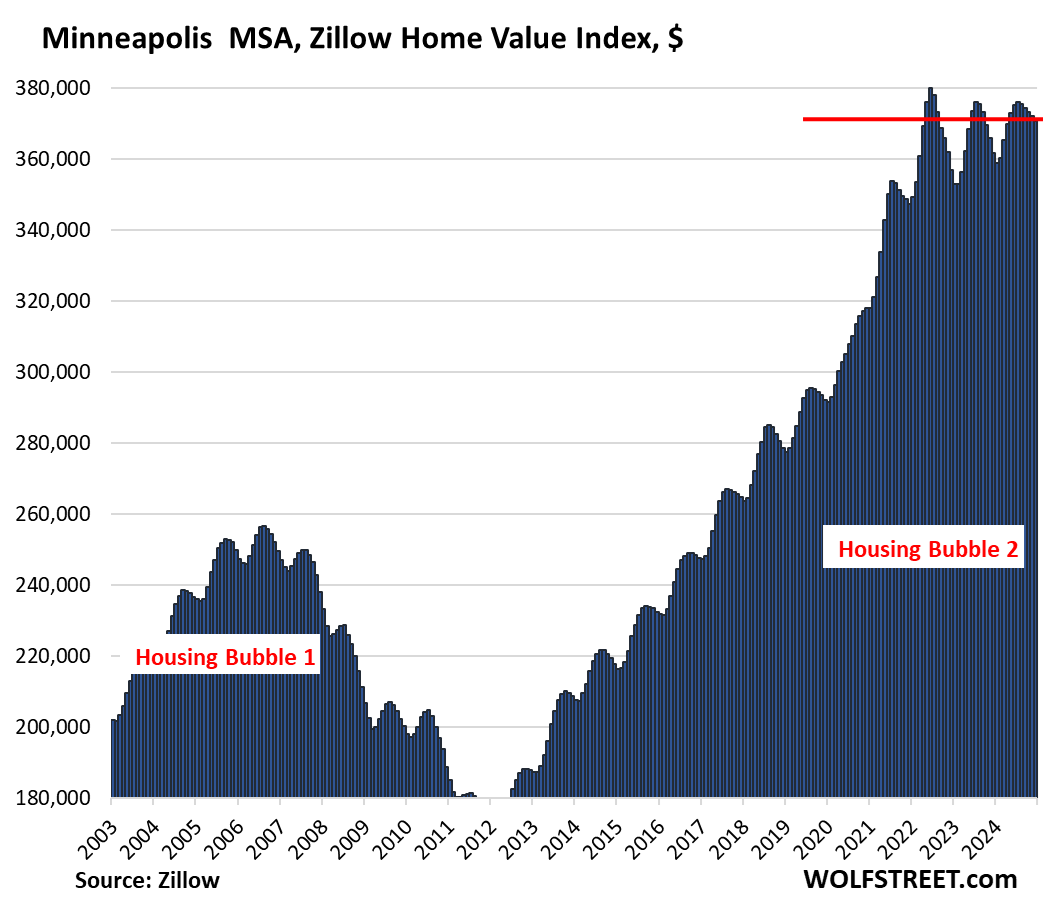
| Minneapolis MSA, Home Prices | |||
| From May 2022 peak | MoM | YoY | Since 2000 |
| -2.4% | -0.3% | 2.5% | 156% |
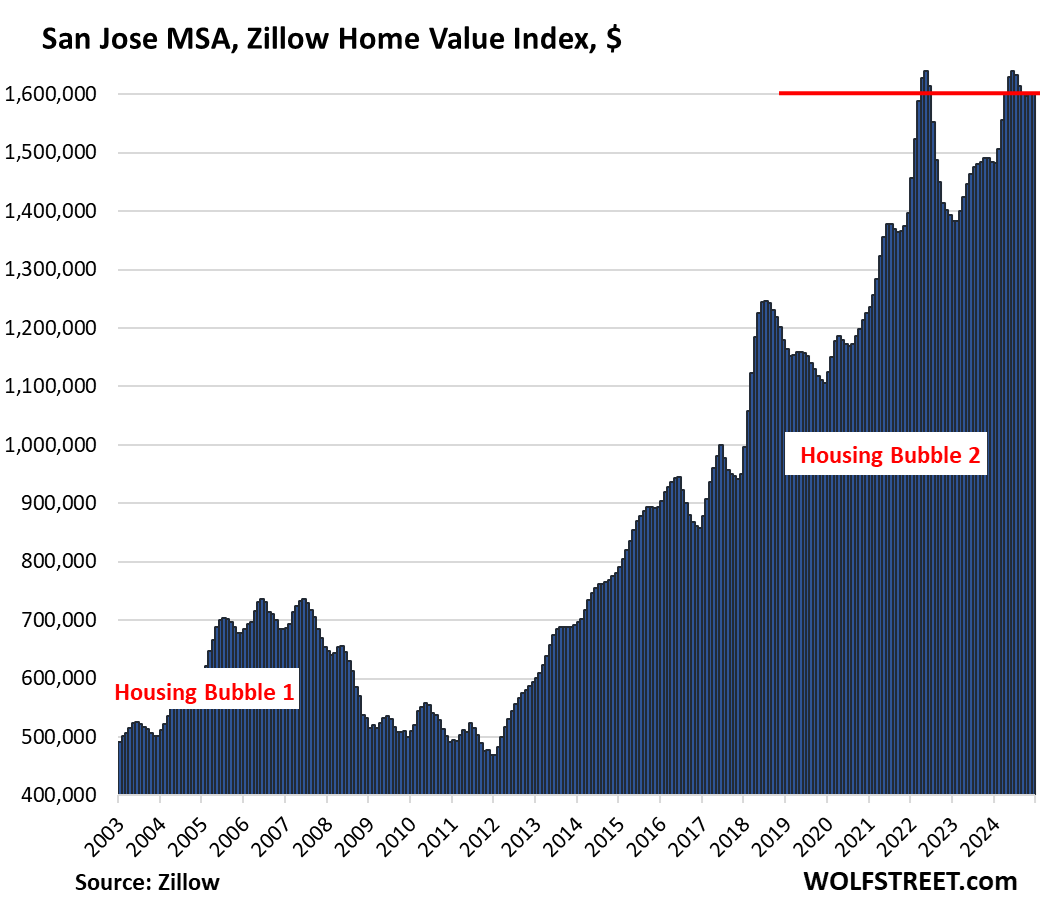
| San Jose MSA, Home Prices | |||
| From May 2022 peak | MoM | YoY | Since 2000 |
| -2.3% | 0.0% | 7.9% | 337% |
Prices have been essentially unchanged for the past four months.
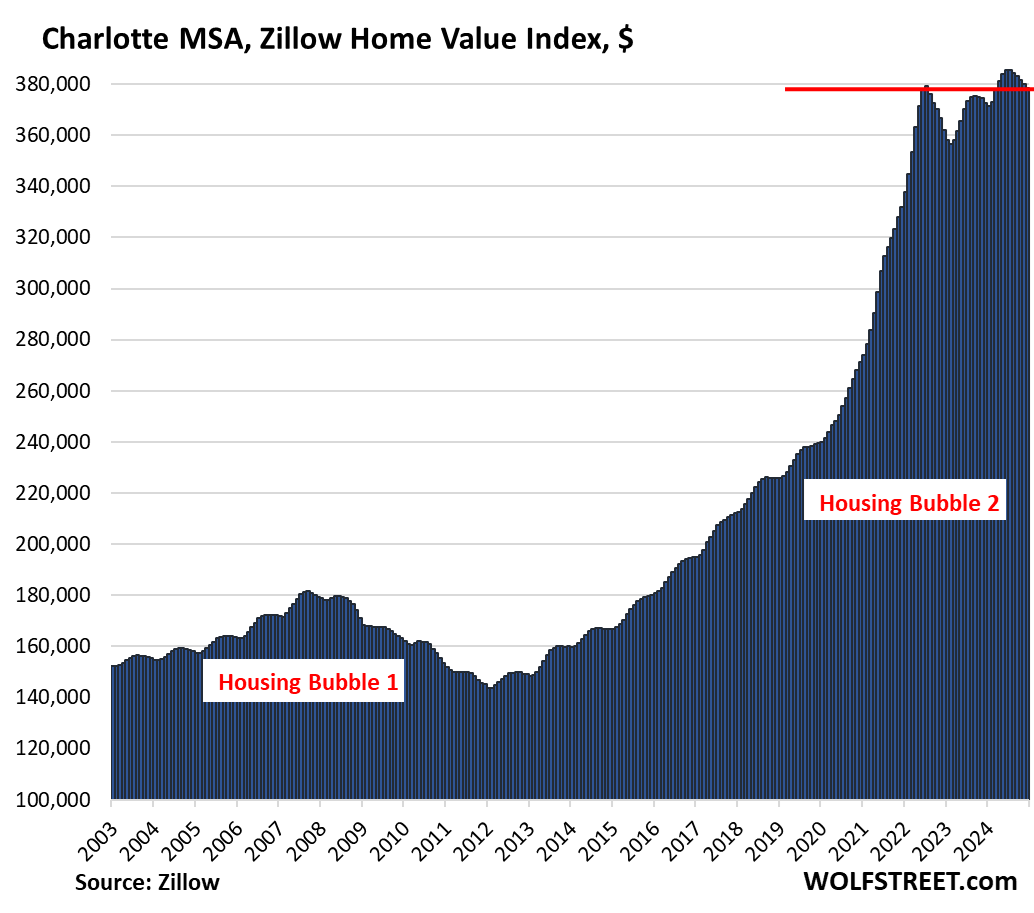
| Charlotte MSA, Home Prices | |||
| From June 2022 | MoM | YoY | Since 2000 |
| -0.2% | -0.4% | 1.6% | 169% |
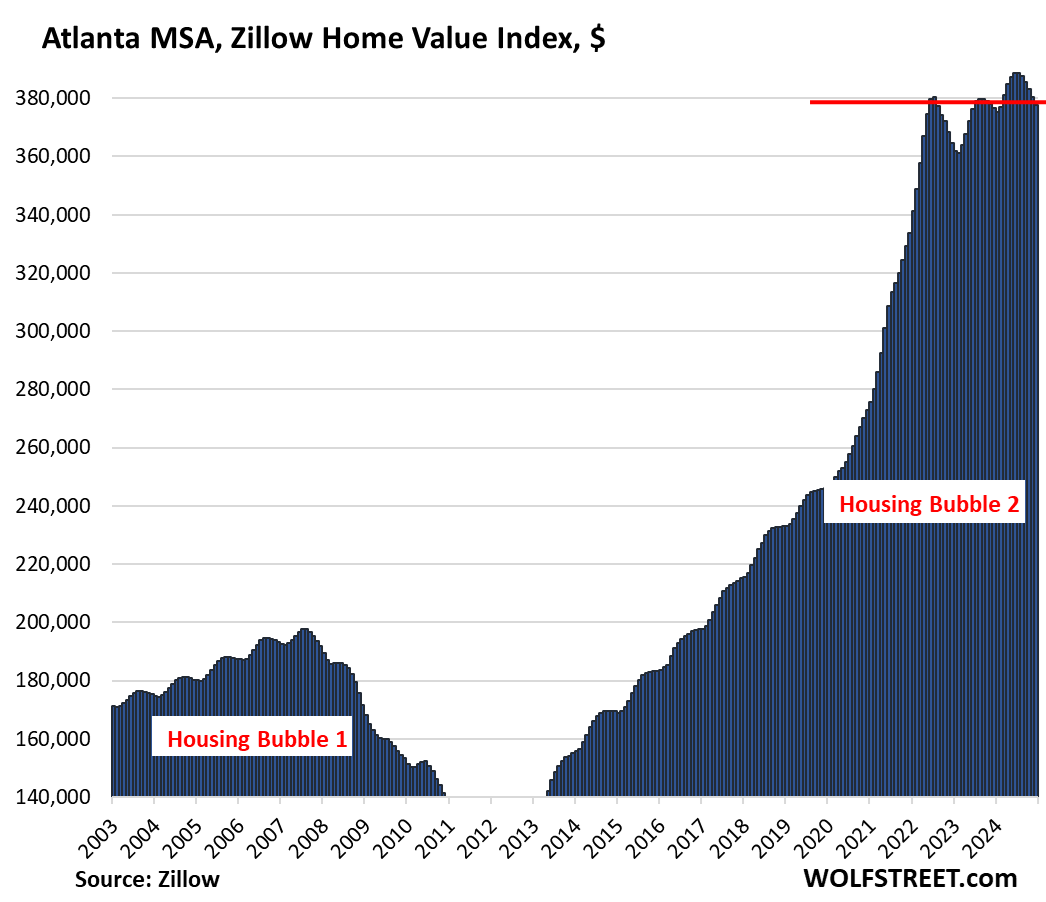
| Atlanta MSA, Home Prices | |||
| From July 2022 | MoM | YoY | Since 2000 |
| -0.6% | -0.7% | 0.3% | 160% |
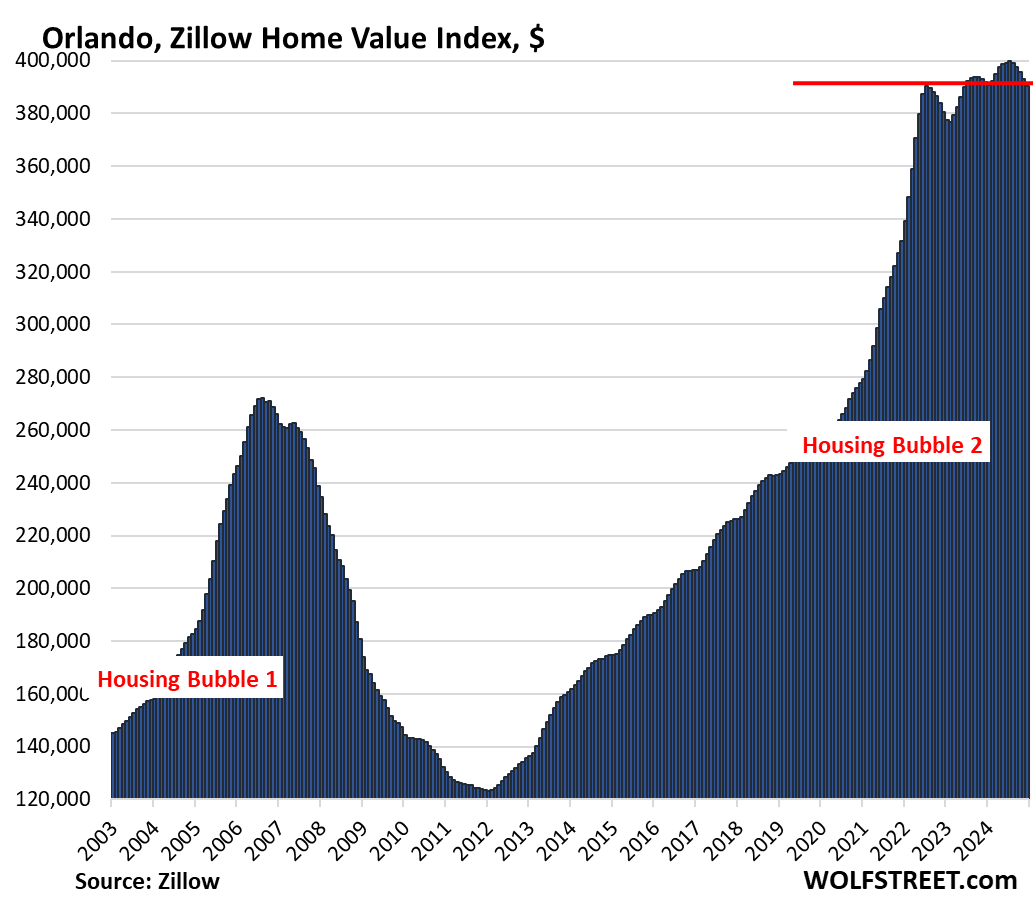
| Orlando MSA, Home Prices | |||
| From June 2022 | MoM | YoY | Since 2000 |
| -0.01% | -0.6% | -0.3% | 234.4% |
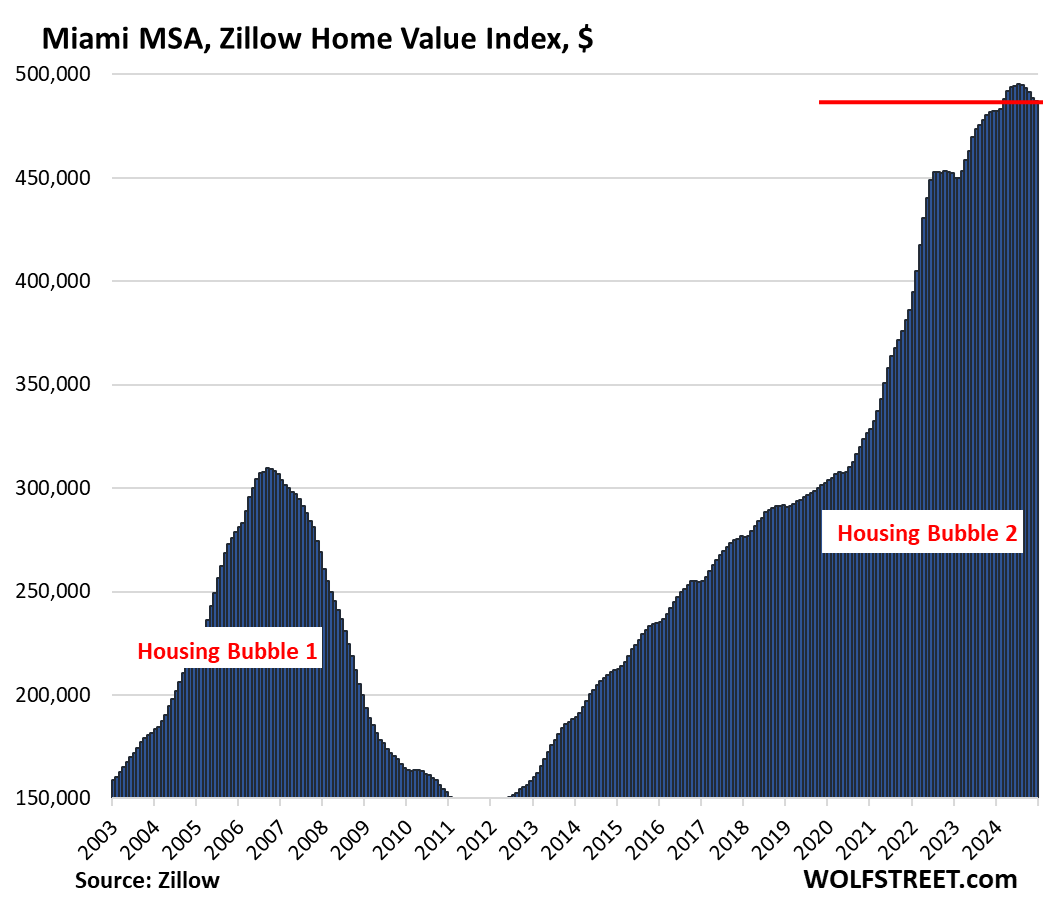
The next 12 markets have set new highs in 2023 or 2024, sorted by year-over-year gain:
| Miami MSA, Home Prices | ||
| MoM | YoY | Since 2000 |
| -0.4% | 1.0% | 329.4% |
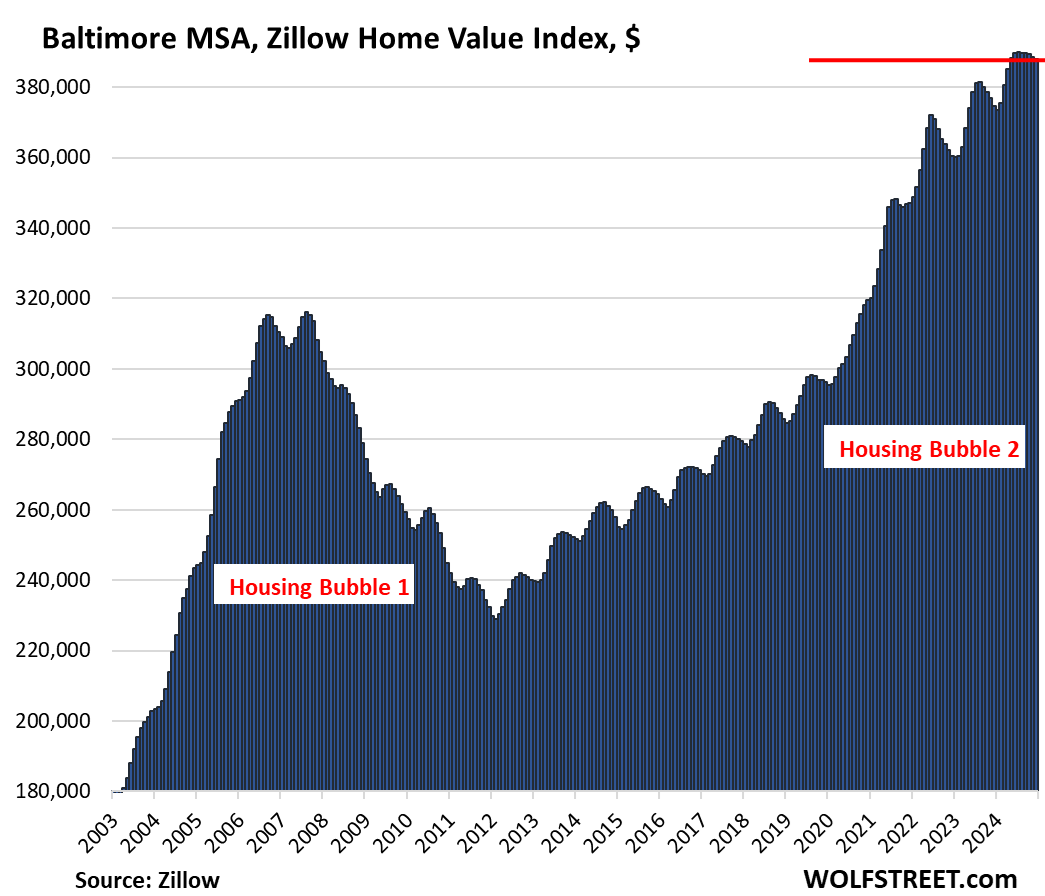
| Baltimore MSA, Home Prices | |||
| MoM | YoY | Since 2000 | |
| -0.1% | 3.6% | 173% | |
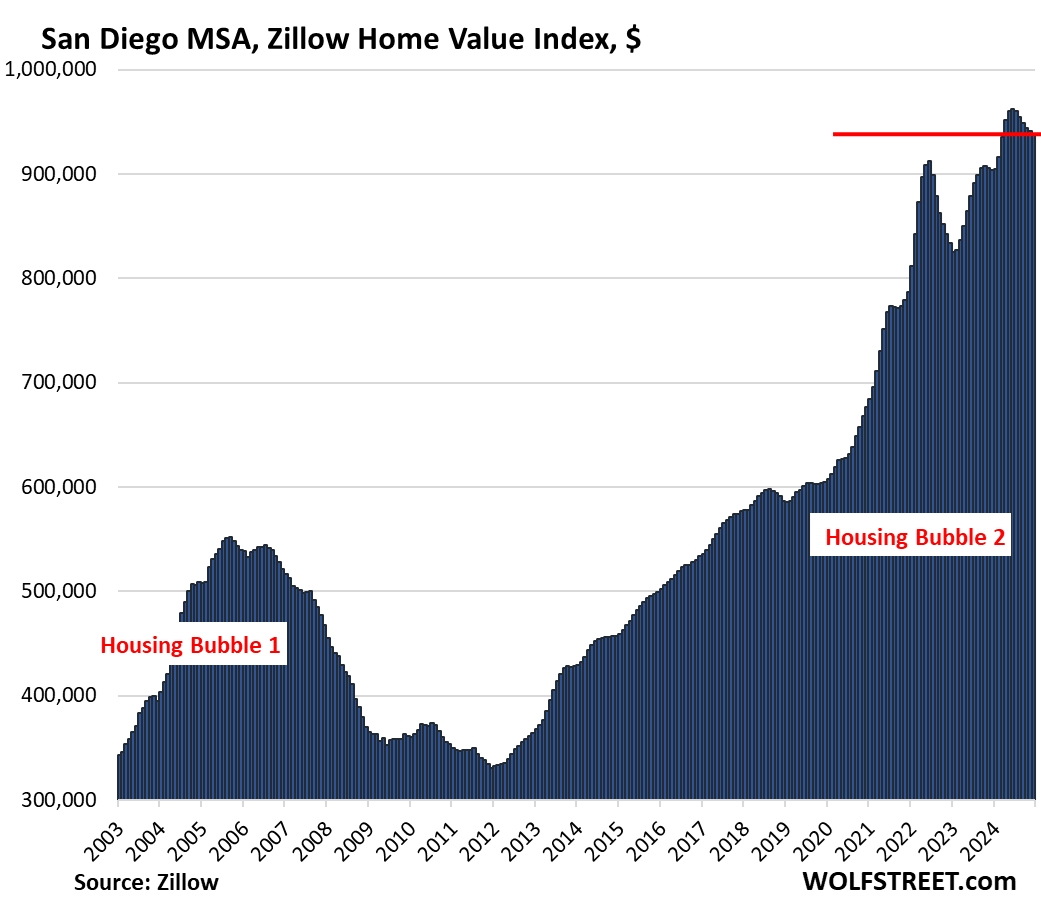
| San Diego MSA, Home Prices | ||
| MoM | YoY | Since 2000 |
| -0.3% | 3.8% | 333% |
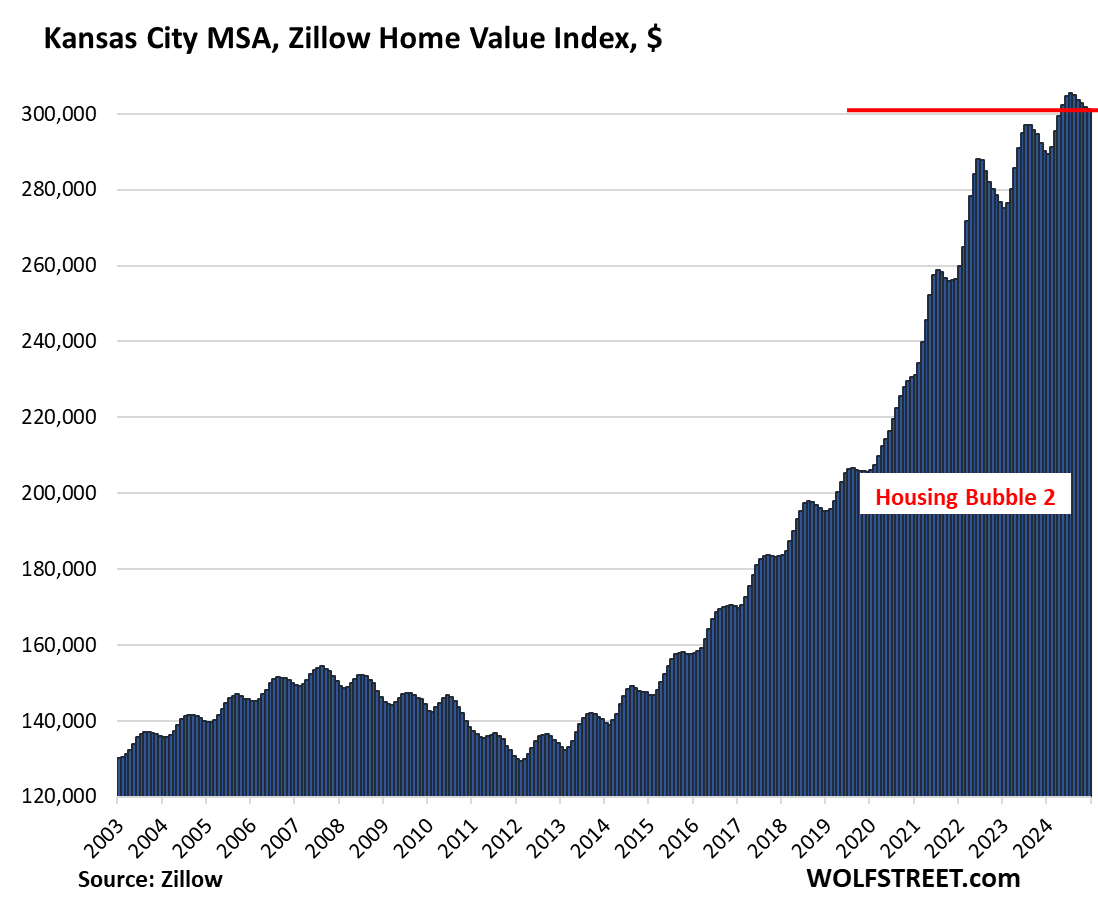
| Kansas City MSA, Home Prices | ||
| MoM | YoY | Since 2000 |
| -0.2% | 3.8% | 175% |
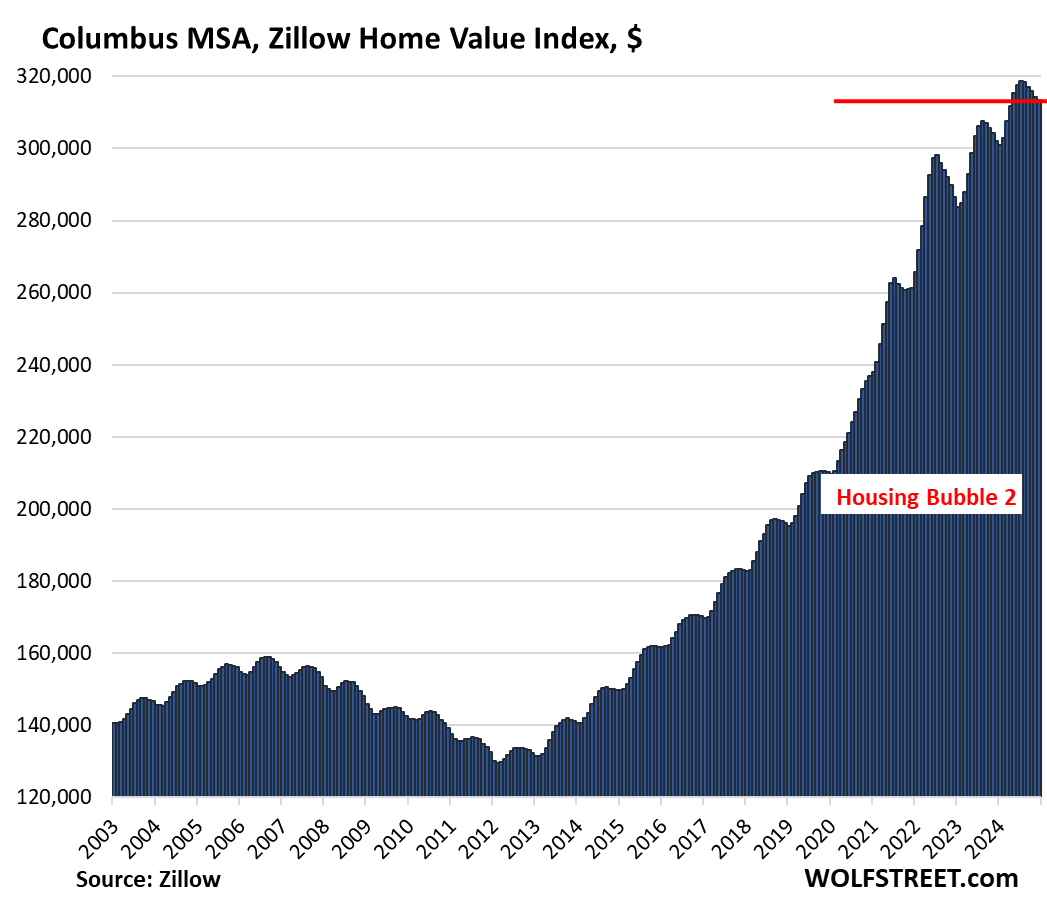
| Columbus MSA, Home Prices | ||
| MoM | YoY | Since 2000 |
| -0.2% | 3.8% | 153% |
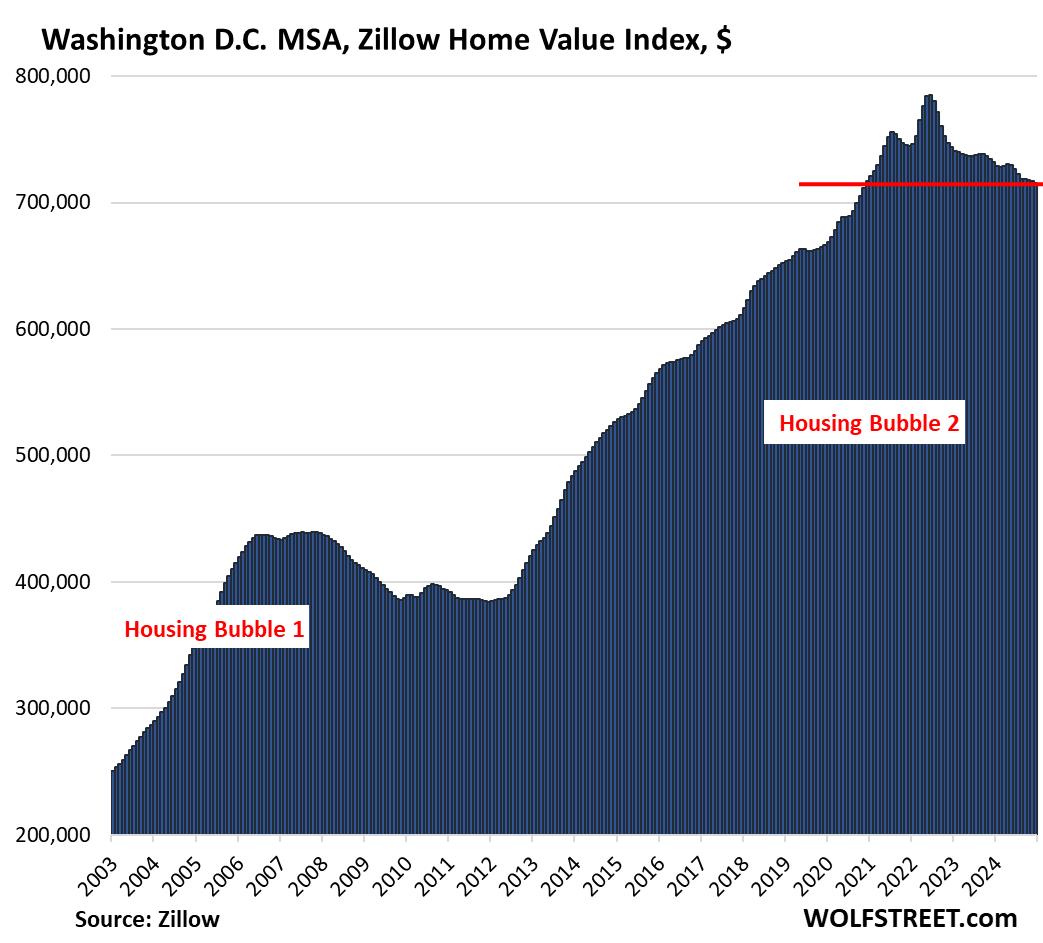
| Washington D.C. MSA, Home Prices | ||
| MoM | YoY | Since 2000 |
| 0.0% | 4.4% | 215% |
This is a huge metro that includes Washington D.C. and parts of the three states, Maryland, Virginia, and West Virginia.
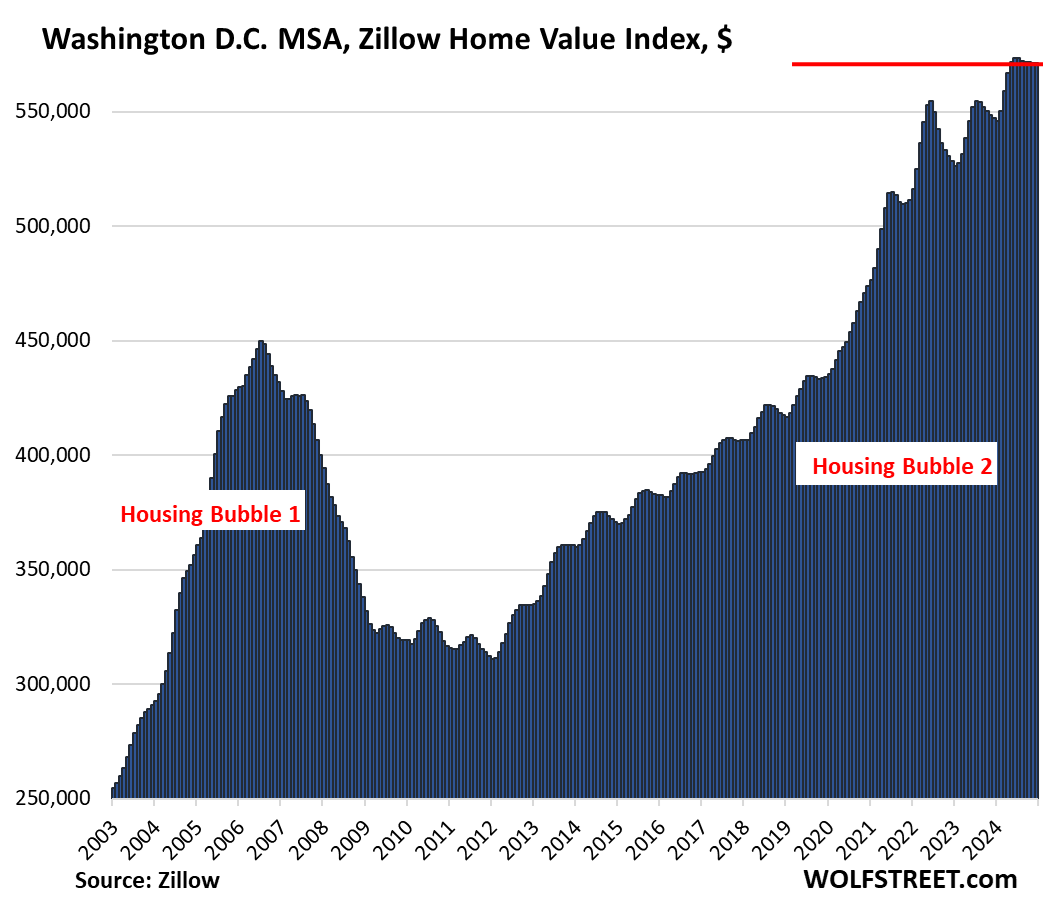
But in Washington D.C. by itself, so in the city by itself, prices of single-family houses, seasonally adjusted, have dropped by 8.6% from the peak, to the lowest level since November 2020. We will discuss the major cities with the biggest declines in house and condo prices in a separate article fairly soon, and Washington D.C. is one of them, but not at the top. This is just to show how there can be big differences between the metro index, which puts a lot of different markets into one bucket, and the index of a city by itself:
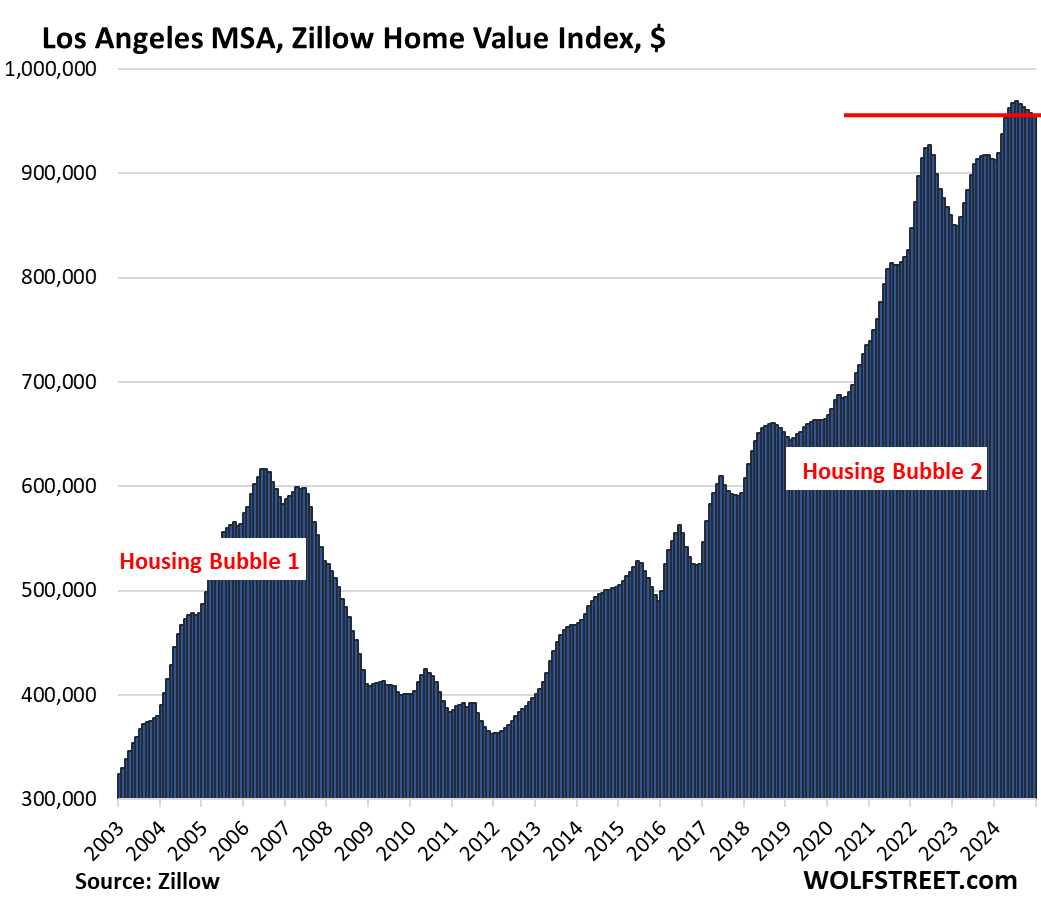
| Los Angeles MSA, Home Prices | ||
| MoM | YoY | Since 2000 |
| -0.2% | 4.6% | 329% |
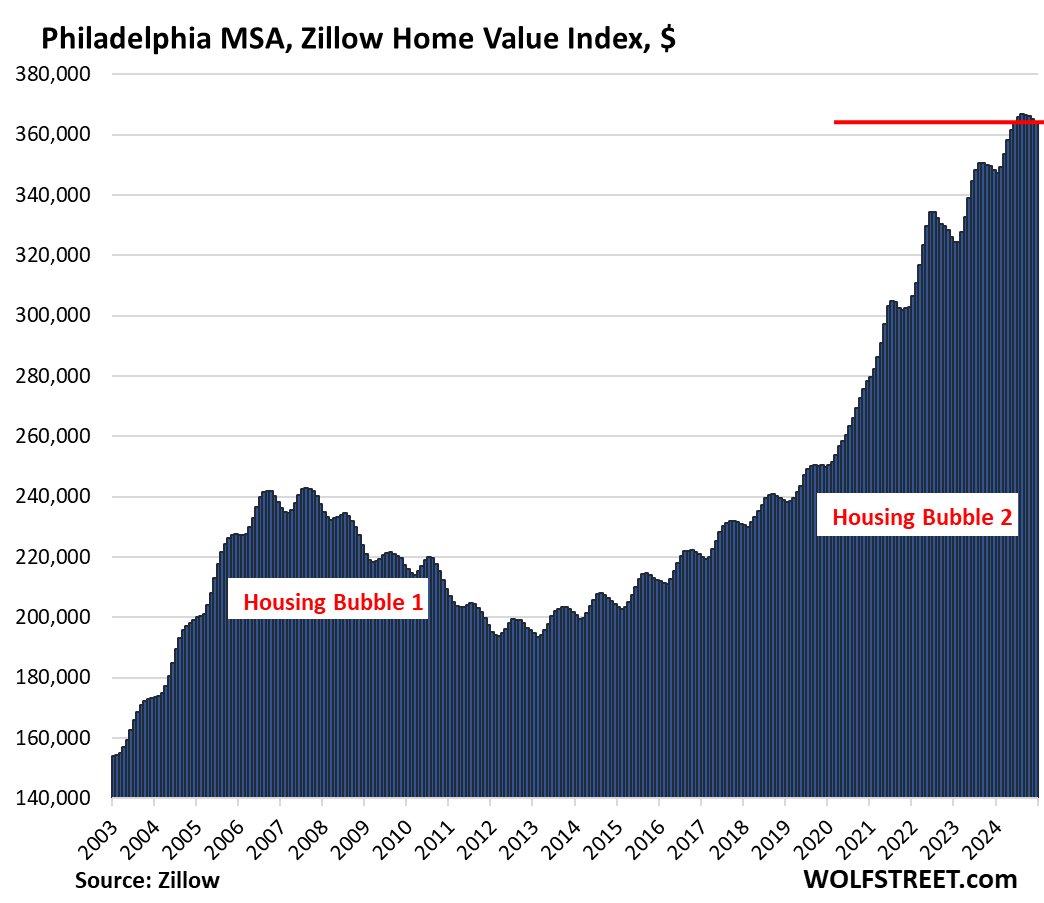
| Philadelphia MSA, Home Prices | ||
| MoM | YoY | Since 2000 |
| -0.2% | 4.6% | 200% |
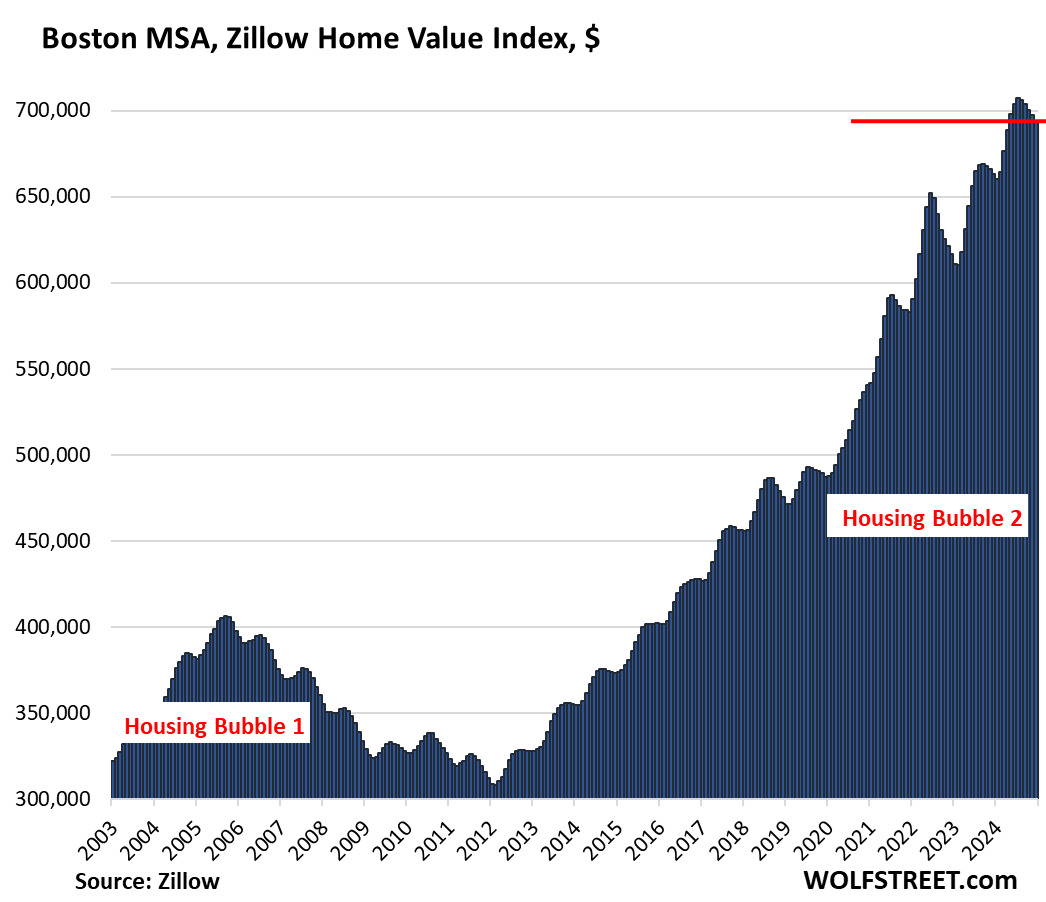
| Boston MSA, Home Prices | ||
| MoM | YoY | Since 2000 |
| -0.5% | 4.7% | 224% |
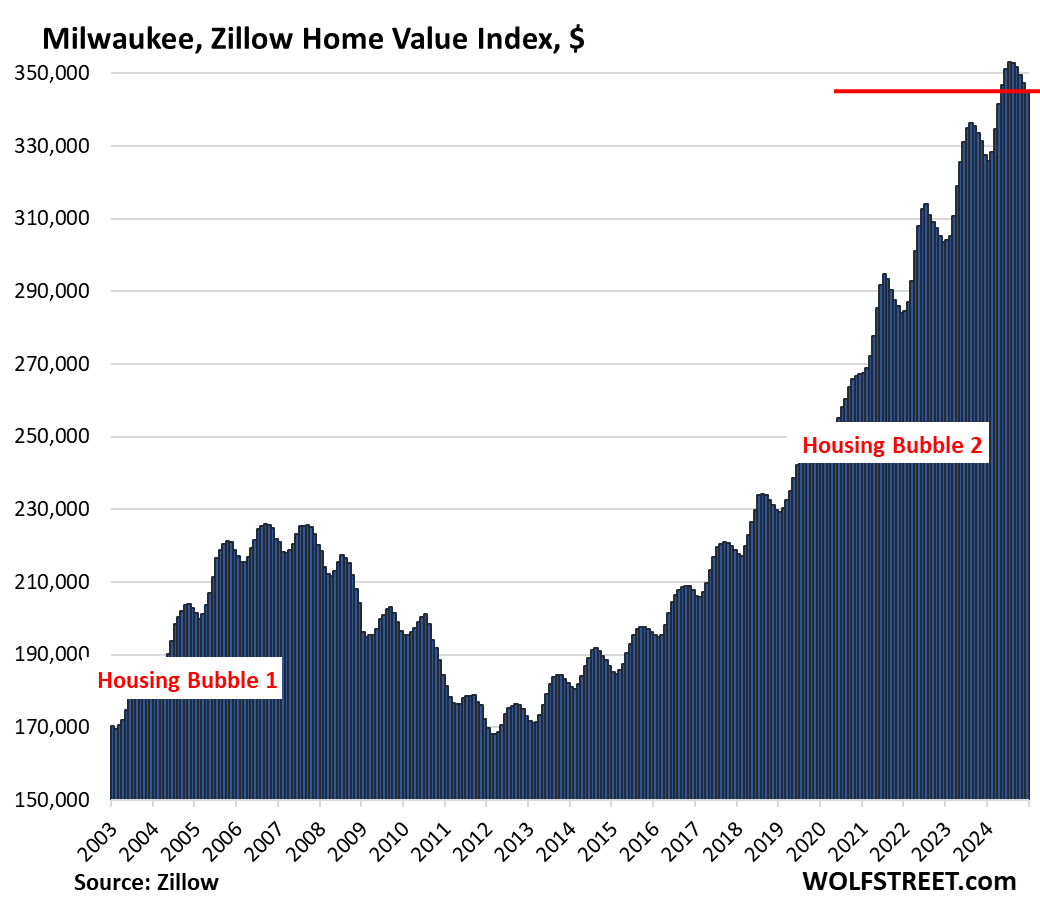
| Milwaukee MSA, Home Prices | ||
| MoM | YoY | Since 2000 |
| -0.6% | 5.3% | 142.3% |
| Chicago MSA, Home Prices | ||
| MoM | YoY | Since 2000 |
| -0.3% | 5.4% | 112% |
| New York MSA, Home Prices | ||
| MoM | YoY | Since 2000 |
| -0.3% | 6.4% | 211% |
We give you energy news and help invest in energy projects too, click here to learn more
Crude Oil, LNG, Jet Fuel price quote
ENB Top News
ENB
Energy Dashboard
ENB Podcast
ENB Substack