19 Metros below 2022 peaks: Austin -22%, San Francisco -10%, Phoenix -9%, San Antonio -8%, Denver -7%, Salt Lake City -6%, Sacramento -6%, Portland -6%, Dallas -6%, Seattle -5%, Honolulu -5%…
By Wolf Richter for WOLF STREET.
The dynamics in the housing market are now sort of messy: The lowest demand for existing homes since 1995 has led to rapidly rising active listings, as buyers are on strike because prices are too high. Homebuilders have been building single-family houses at breakneck speed, creating the biggest pile of unsold completed houses since 2009, and they’re throwing around massive incentives, including mortgage-rate buydowns, to move the inventory.
Mortgage rates, which have risen on renewed inflation fears since the Fed started cutting rates, are back to the old normal, before the era of QE started in 2008, and Fannie Mae’s CEO said that people should get used to them. To top it off, renting a nice single-family house is now far cheaper than buying an equivalent house after the mindboggling spike in home prices and the now old-normal mortgage rates.
So, prices in many major metropolitan areas, even in San Diego and Los Angles, have started to sag.
Price declines from prior month:
Prices of single-family houses, condos, and co-ops fell in November from October in all 33 of the large metros here.
Some declines are seasonal, or at least in part. But many markets here haven’t had a distinct seasonality in two decades, and therefore their declines cannot be seasonal. Seasonal price changes must happen in a similar way in the same months every year, or they’re not seasonal.
By Metropolitan Statistical Area (MSA), the top month-to-month price declines with drops of -0.3% or bigger:
- Austin, TX: -1.1%
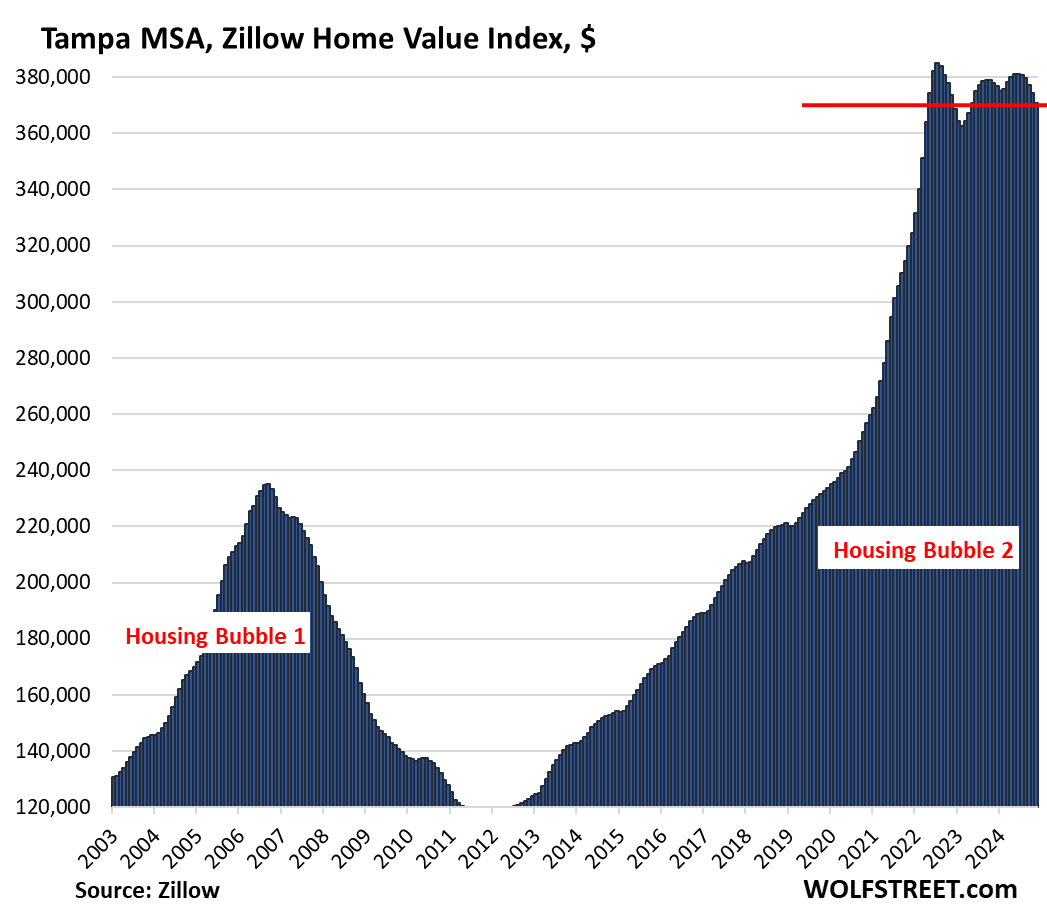
- Tampa, FL: -0.9%
- Dallas, TX: -0.8%
- San Antonio, TX: -0.8%
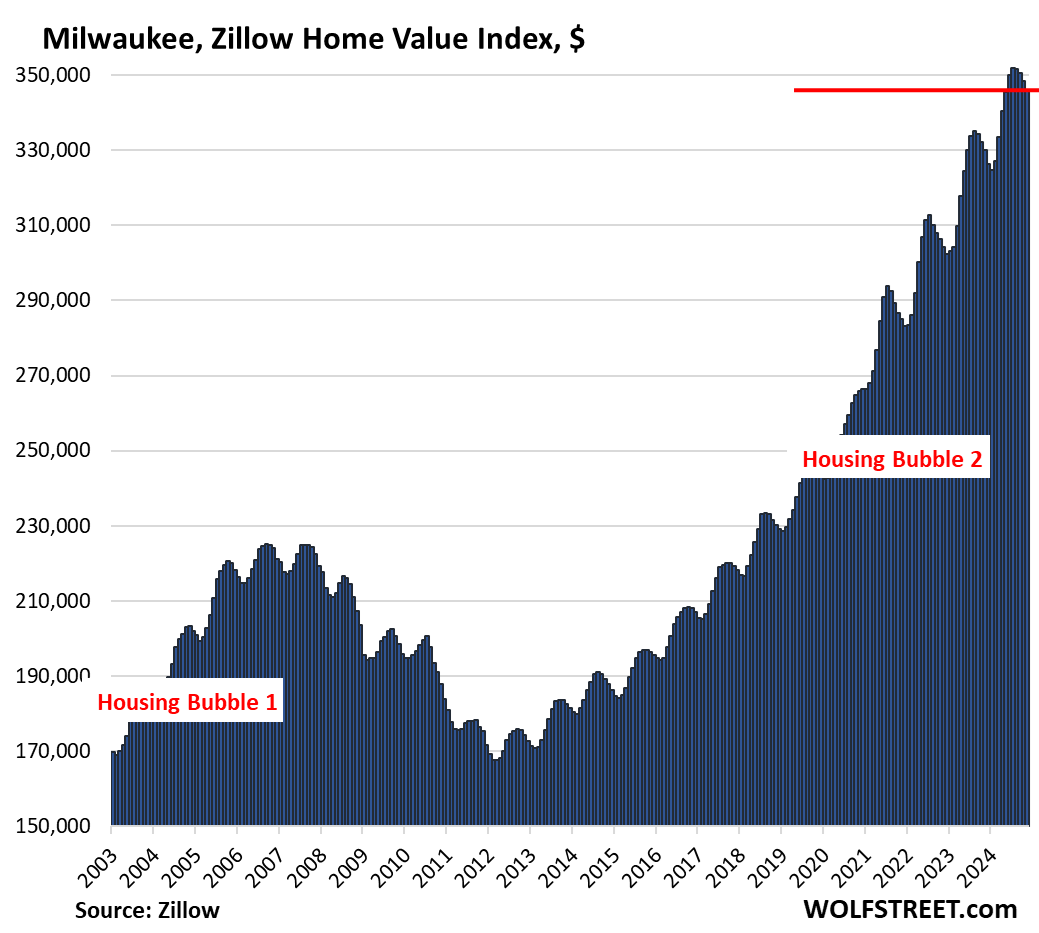
- Milwaukee, WI: -0.7%
- Tucson, AZ: -0.7%
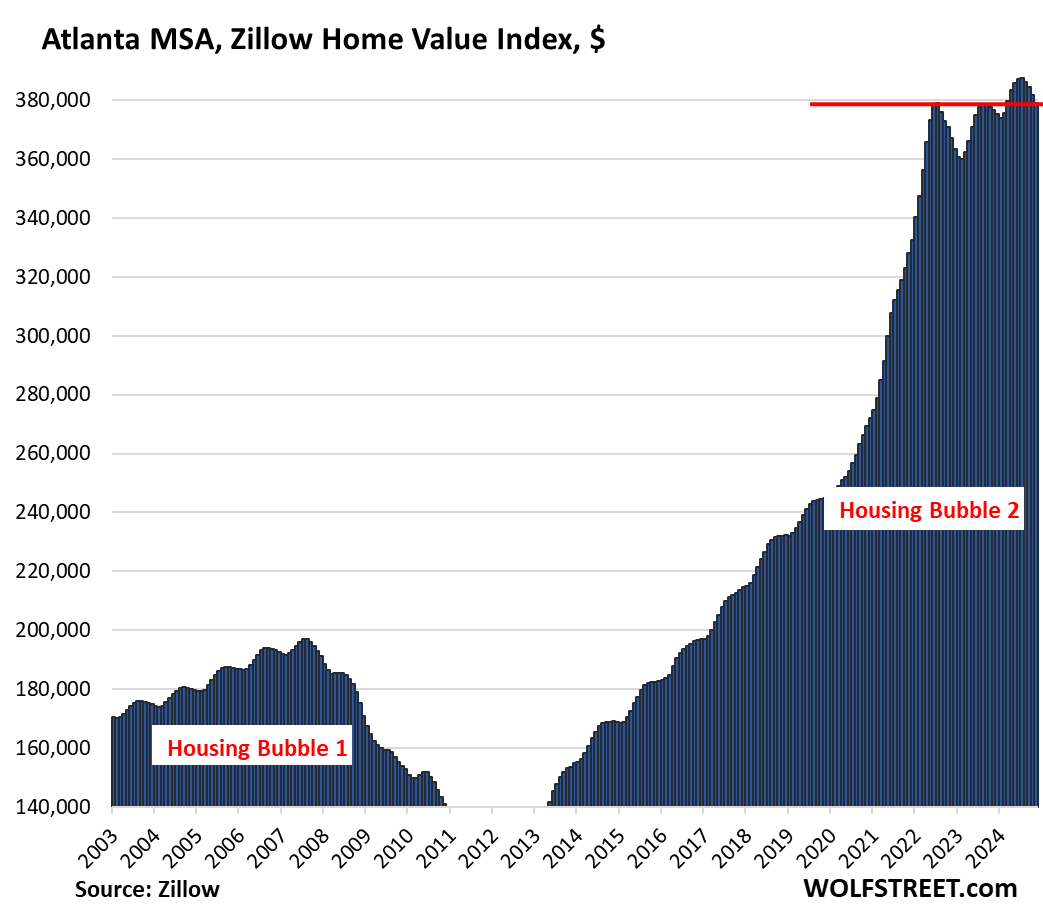
- Atlanta, GA: -0.7%
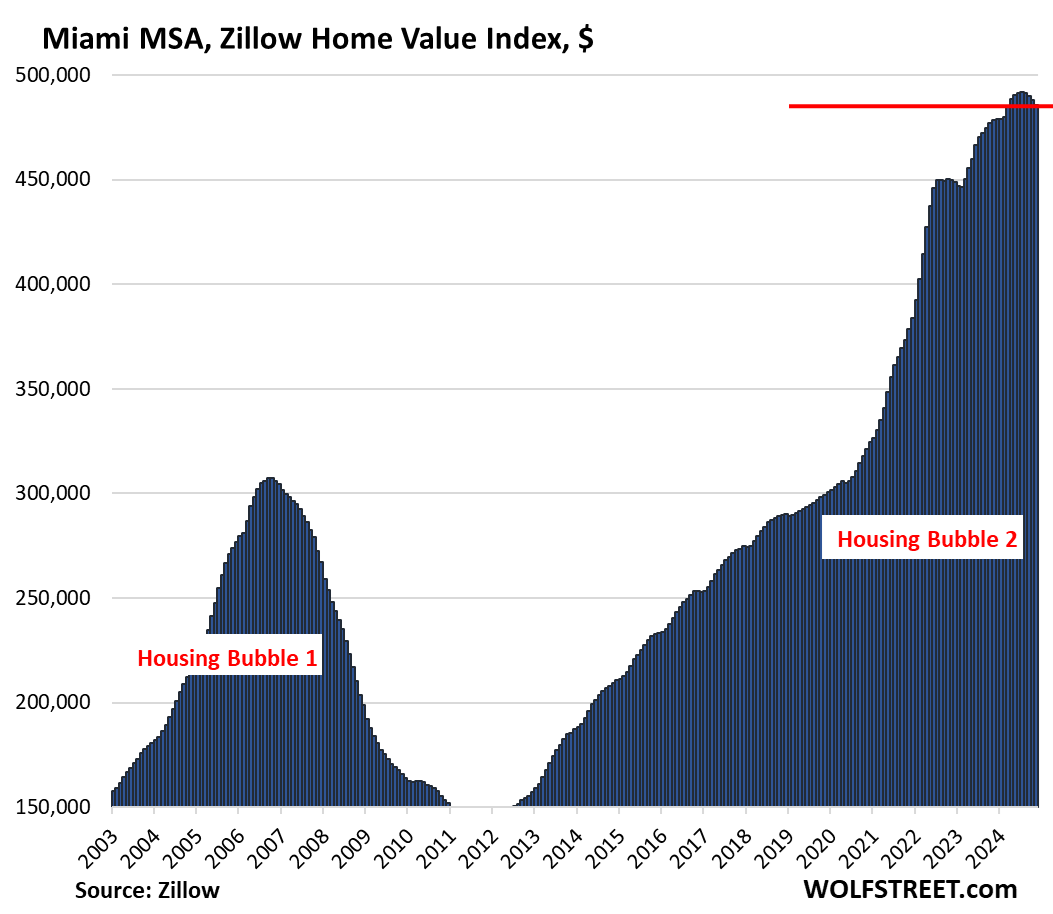
- Miami, FL: -0.6%
- Houston, TX: -0.6%
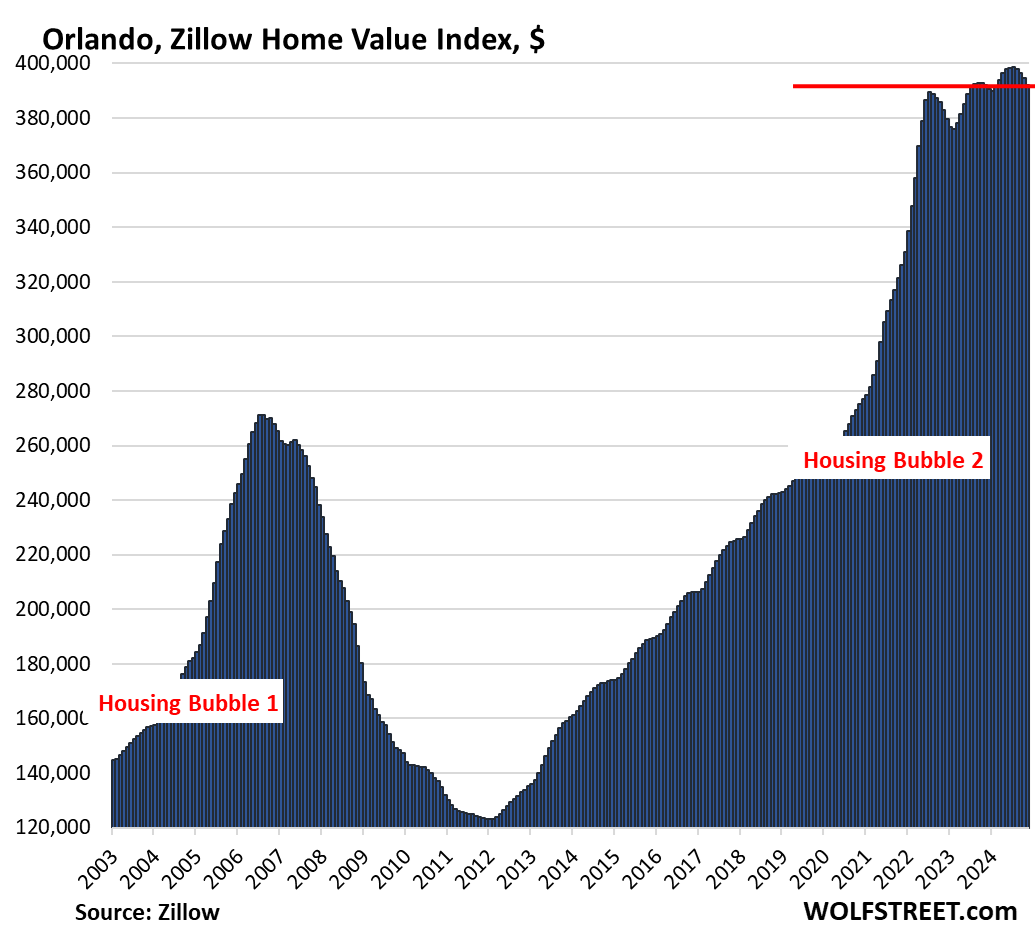
- Orlando, FL: -0.6%
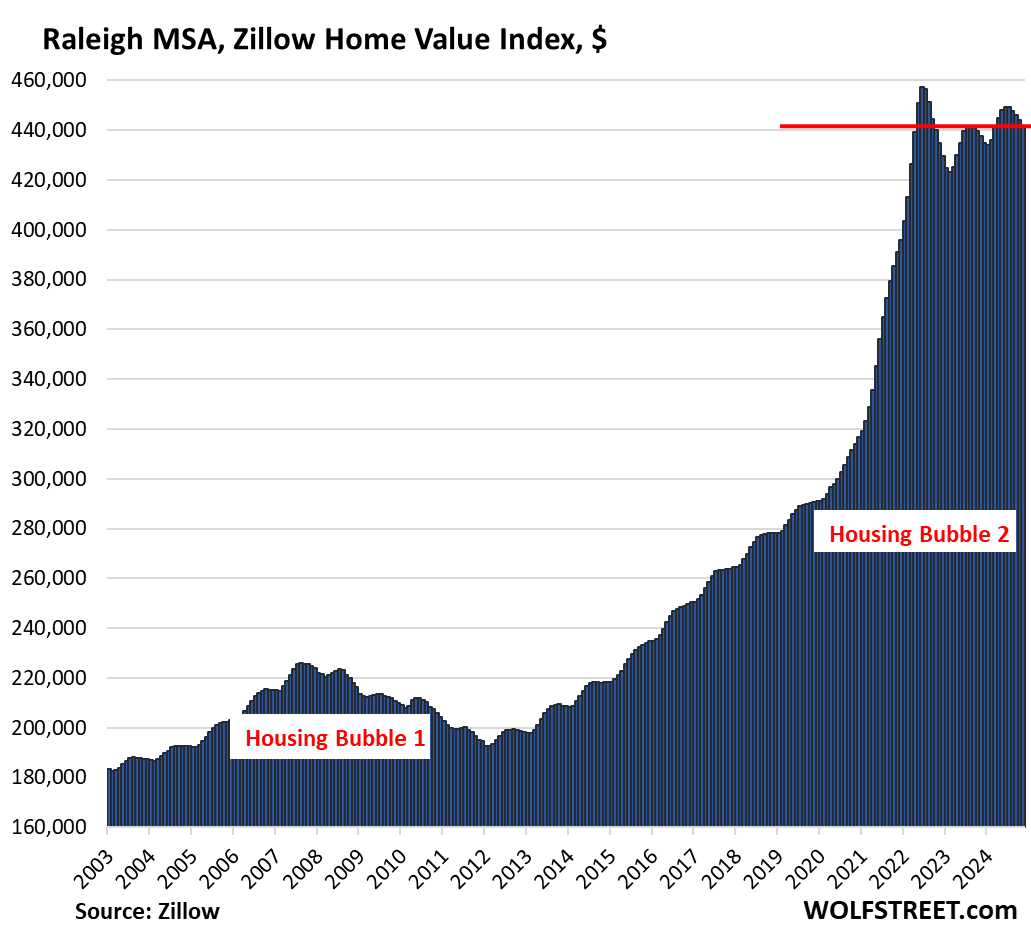
- Raleigh, NC: -0.5%
- Denver, CO: -0.5%
- Columbus, OH: -0.5%
- Phoenix, AZ: -0.5%
- Boston, MA: -0.4%
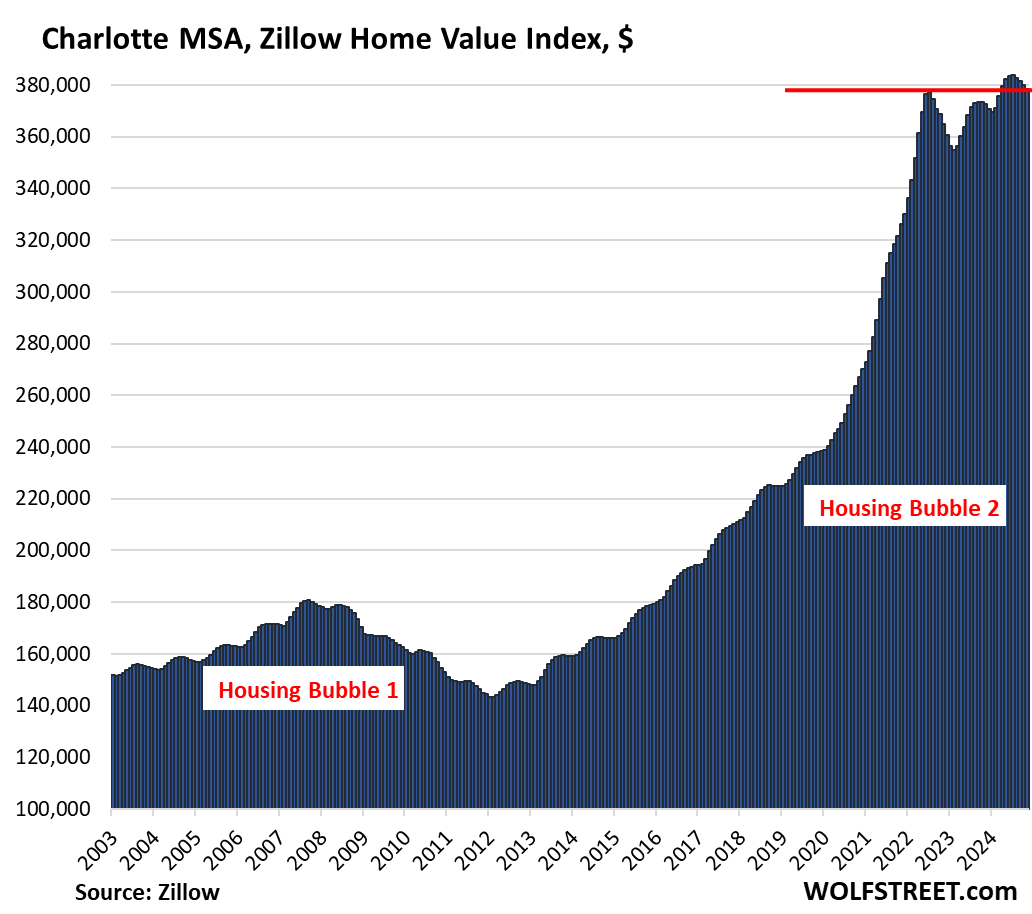
- Charlotte, NC: -0.4%
- Urban Honolulu, HI: -0.4
- San Francisco, CA: -0.3%
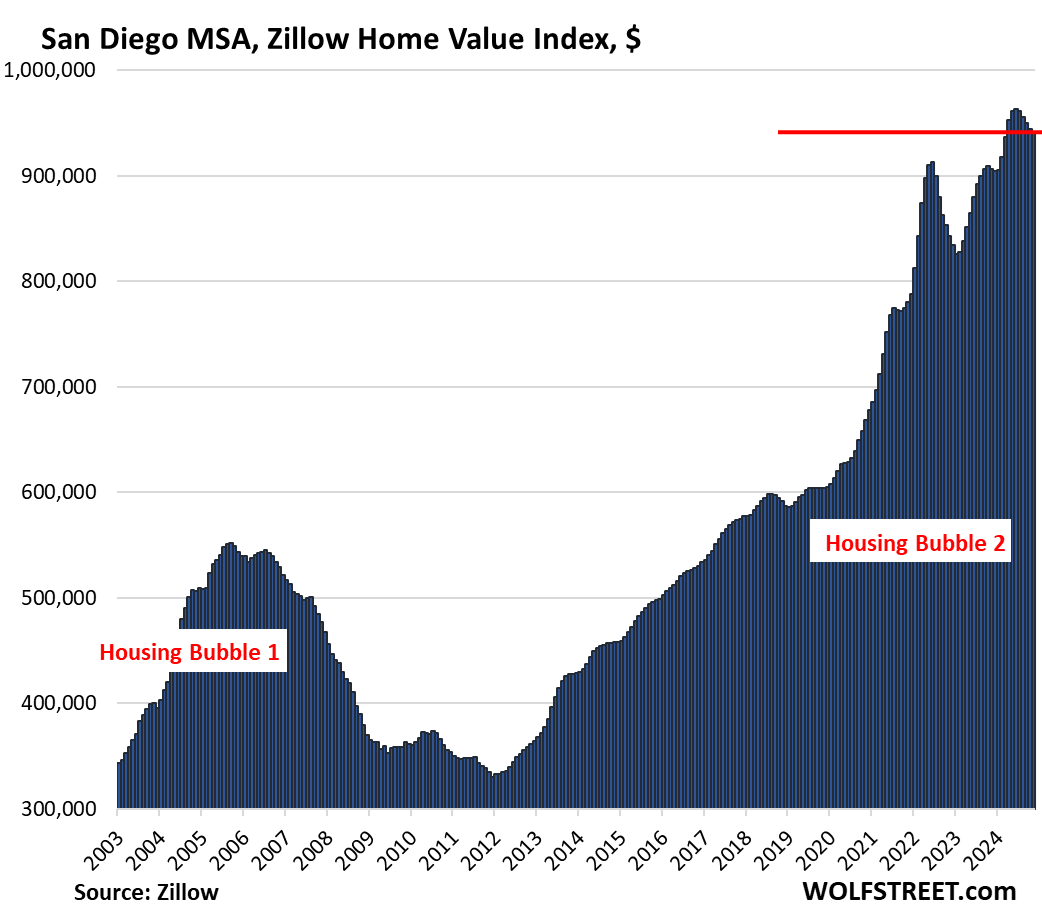
- San Diego, CA: -0.3%
- Sacramento, CA: -0.3%
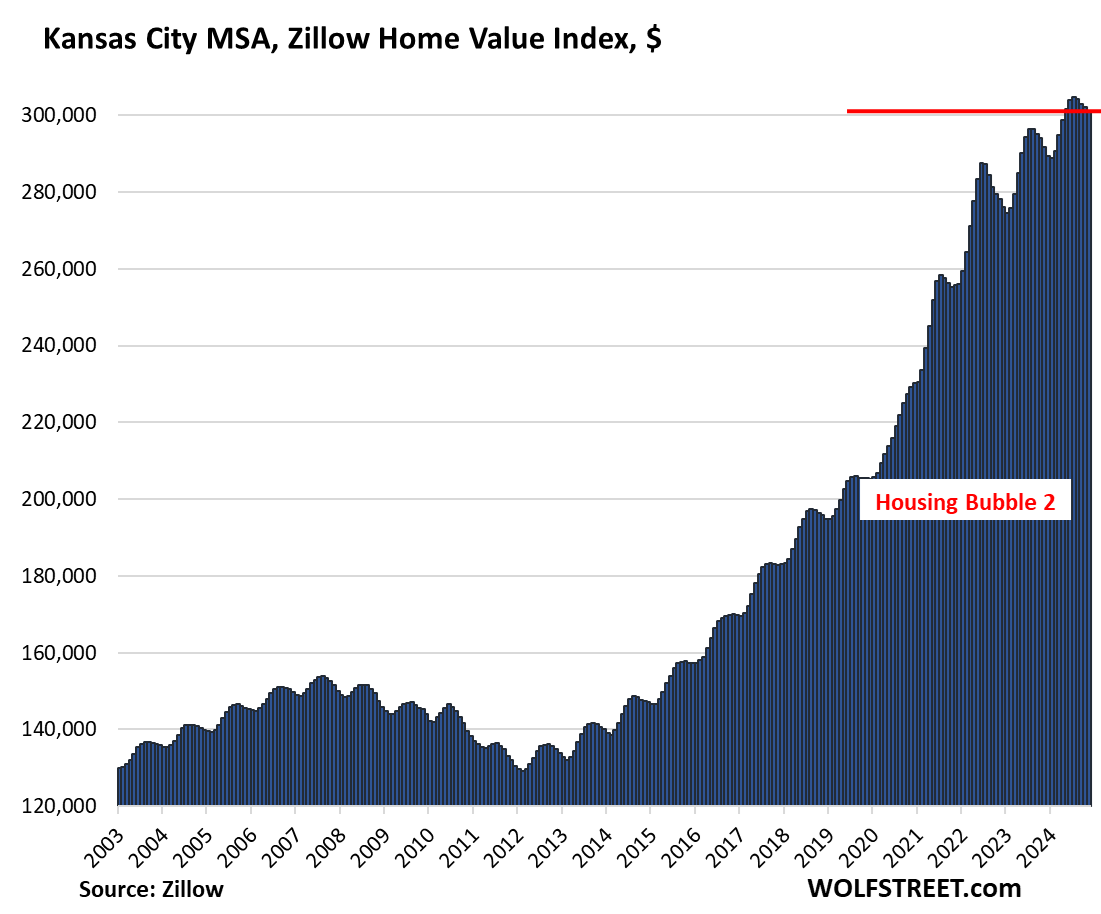
- Kansas City, MO: -0.3%
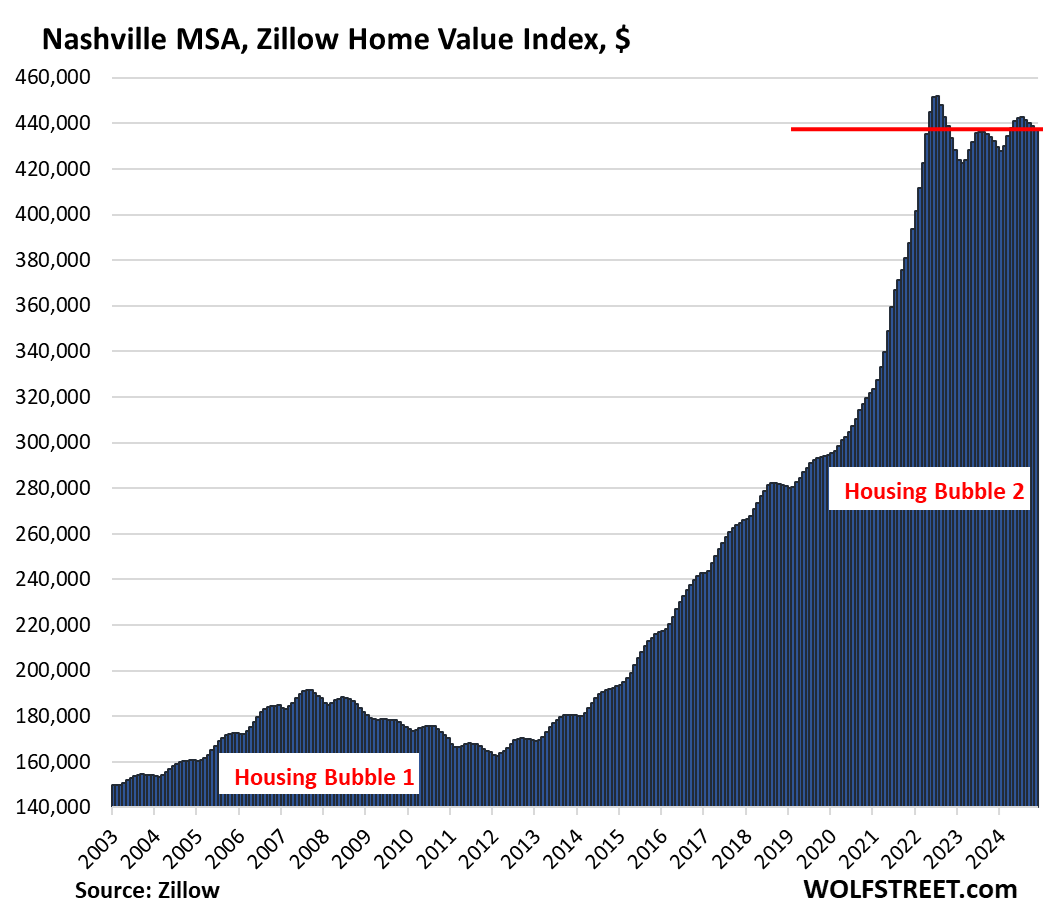
- Nashville, TN: -0.3%
- Chicago, IL: -0.3%
- Minneapolis, MN: -0.3%
- Seattle, WA: -0.3%
Down from their 2022 peaks:
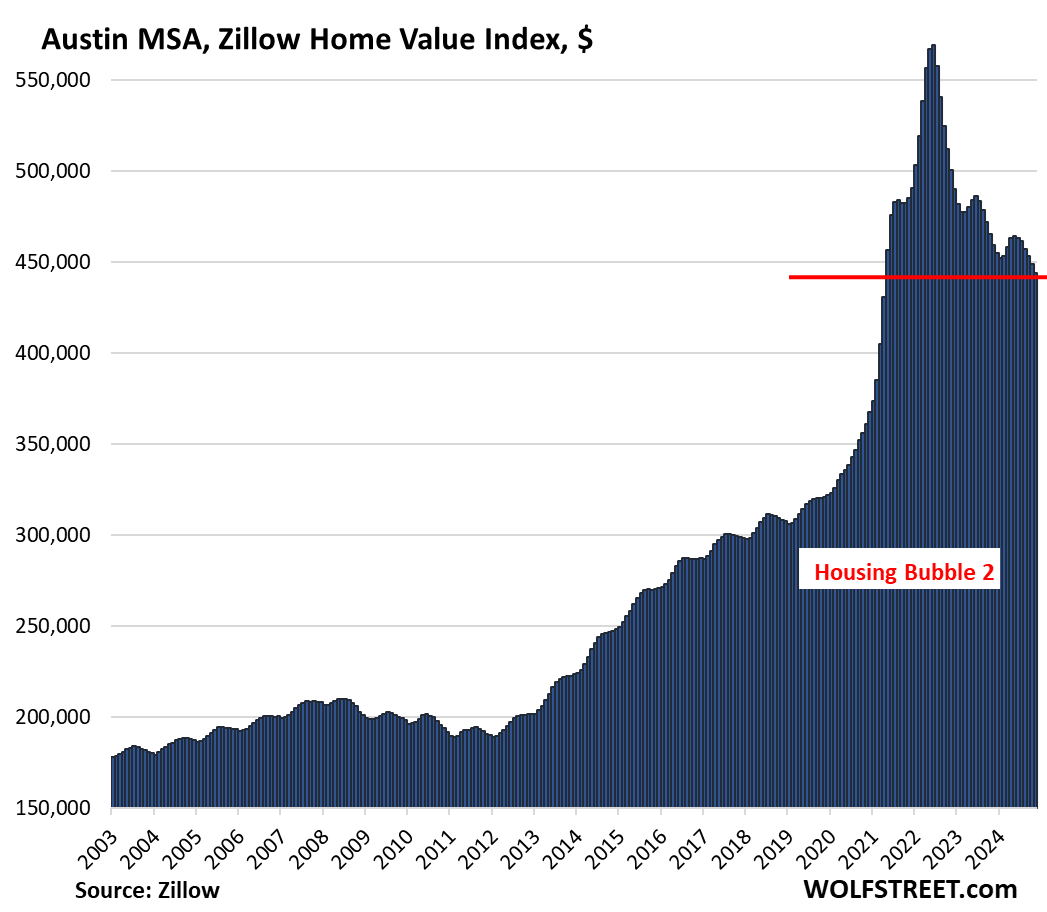
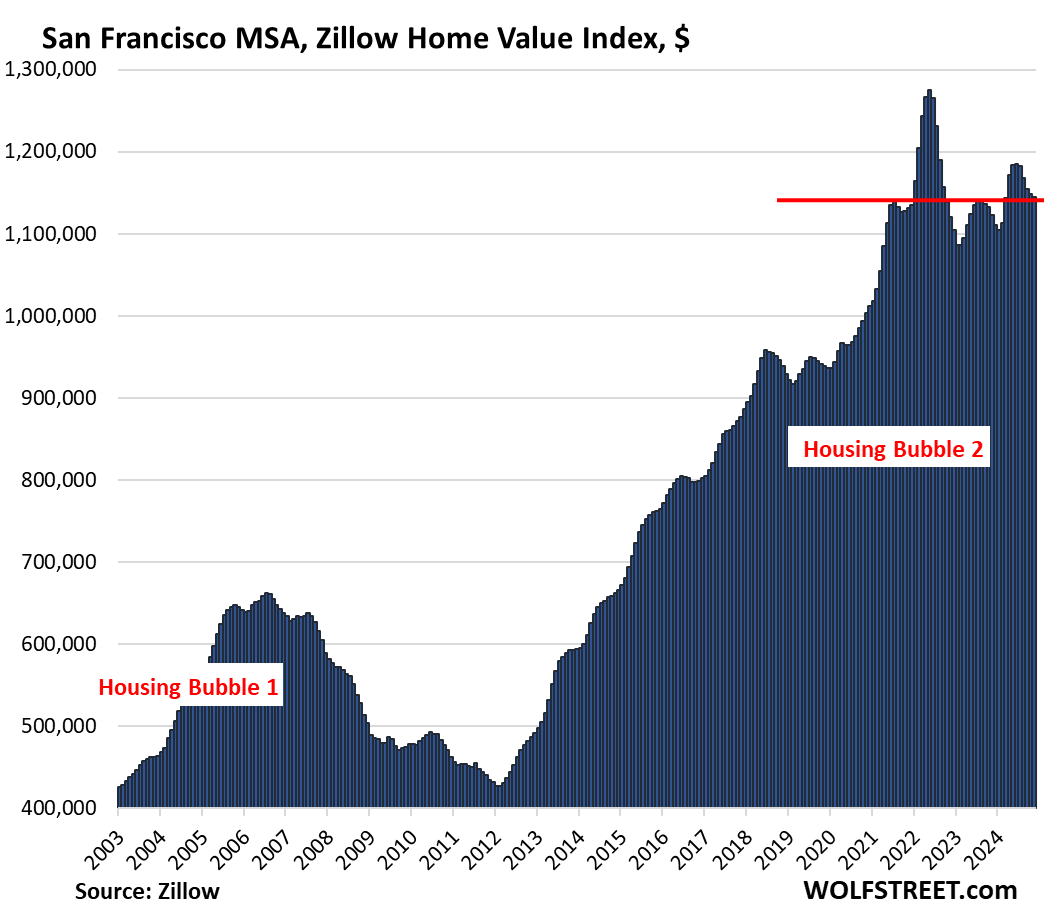
Home prices in 19 of the 33 MSAs here were down from their respective peaks in mid-2022, so about two-and-a-half years ago, two of them by the double digits: Austin and San Francisco:
- Austin: -22.0%
- San Francisco: -10.2%
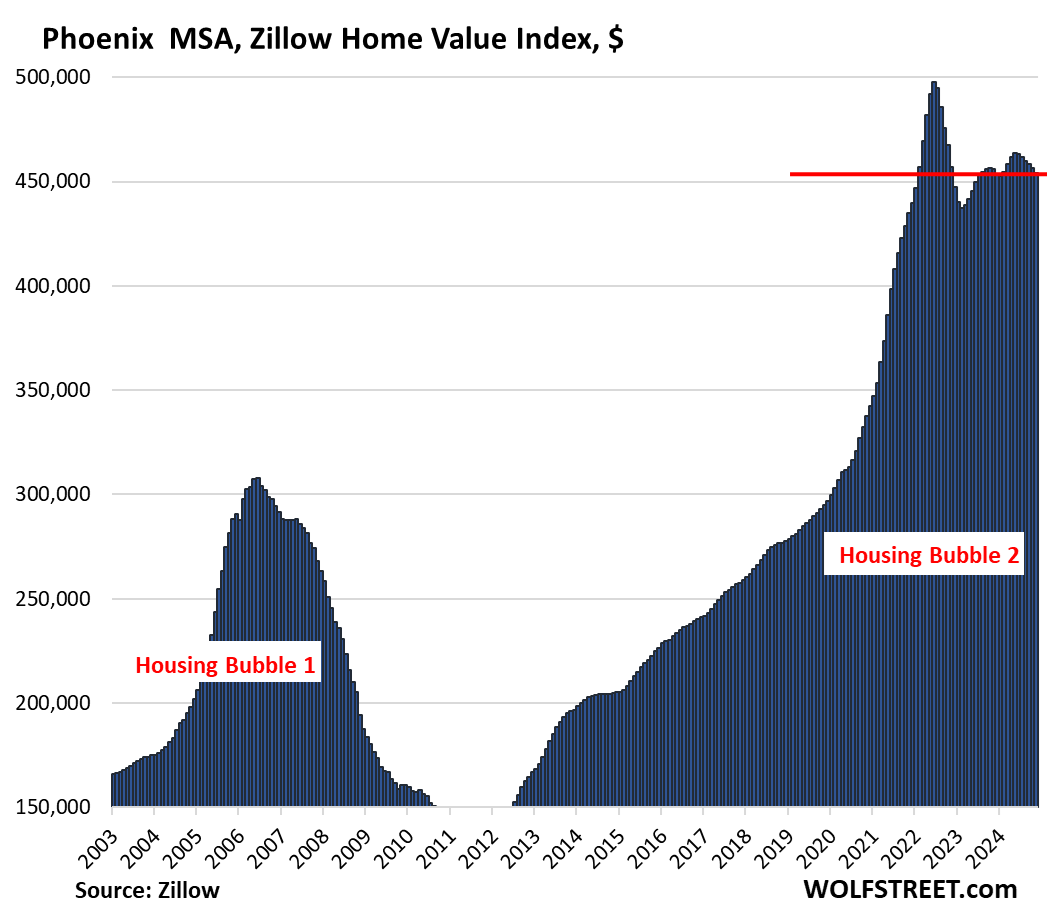
- Phoenix: -8.8%
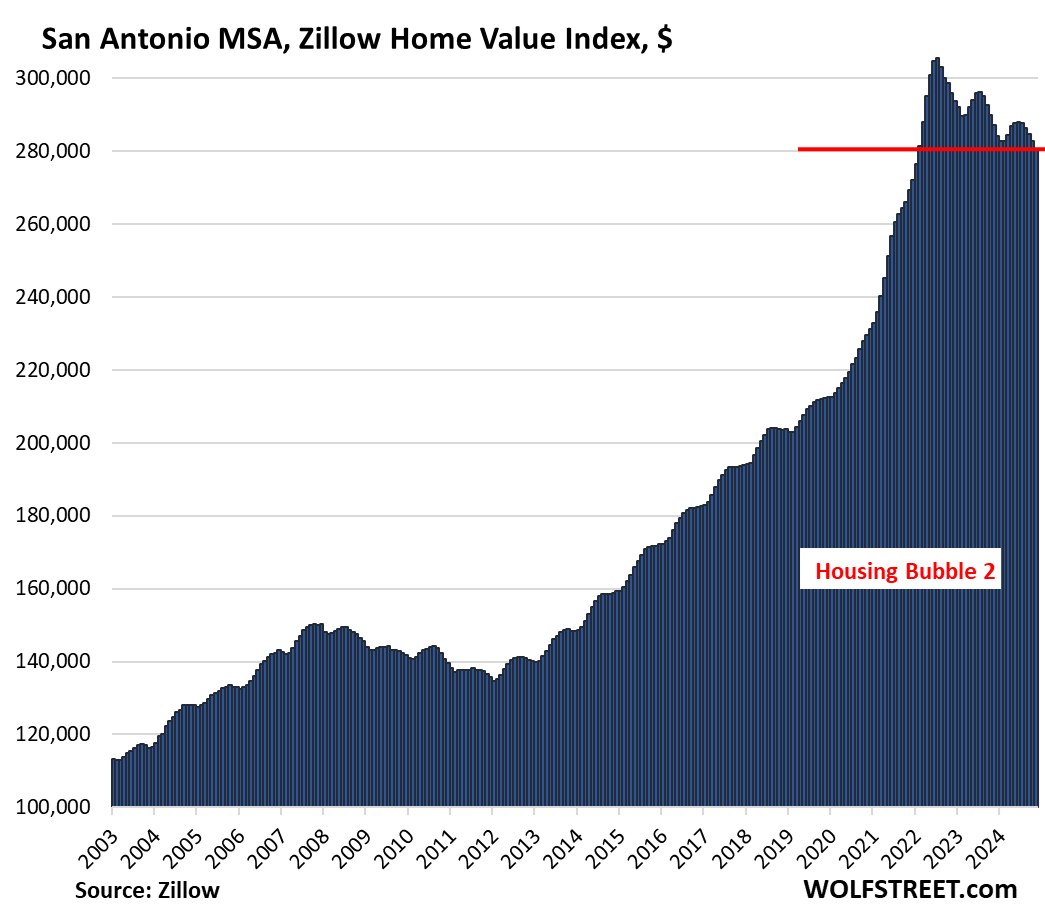
- San Antonio: -8.3%
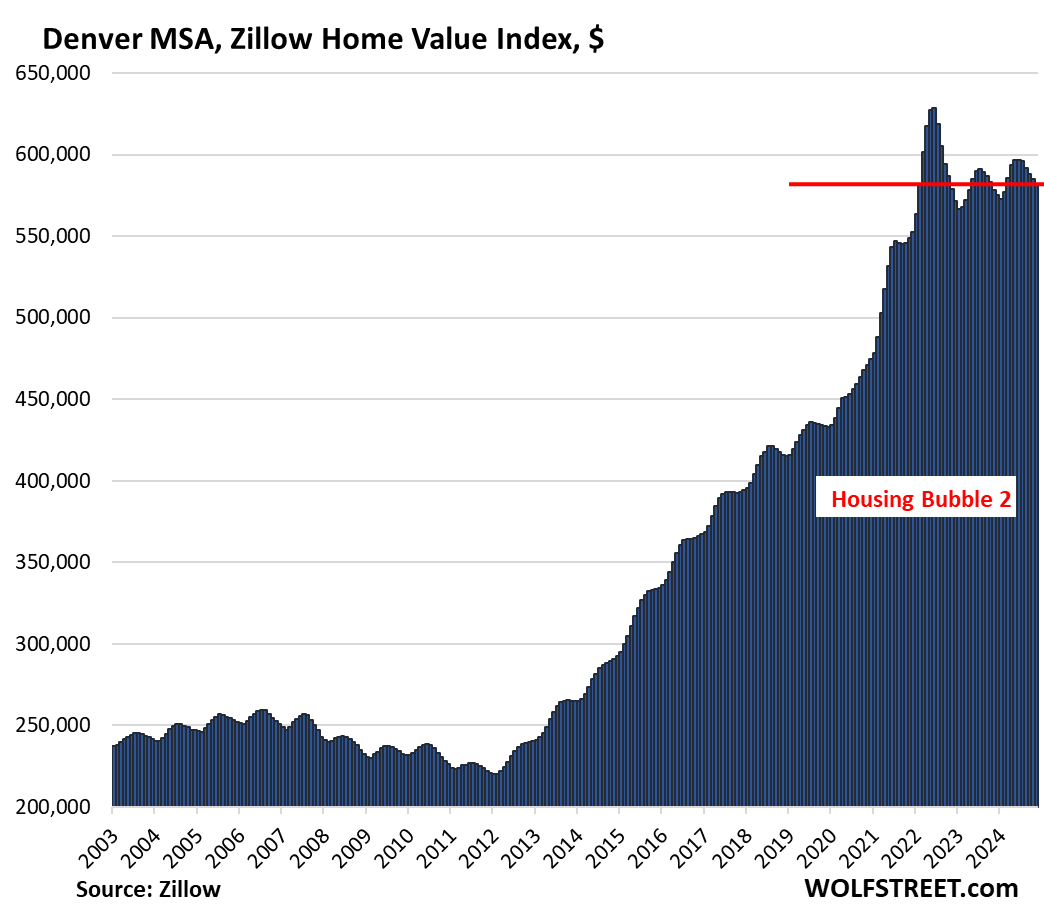
- Denver: -7.4%
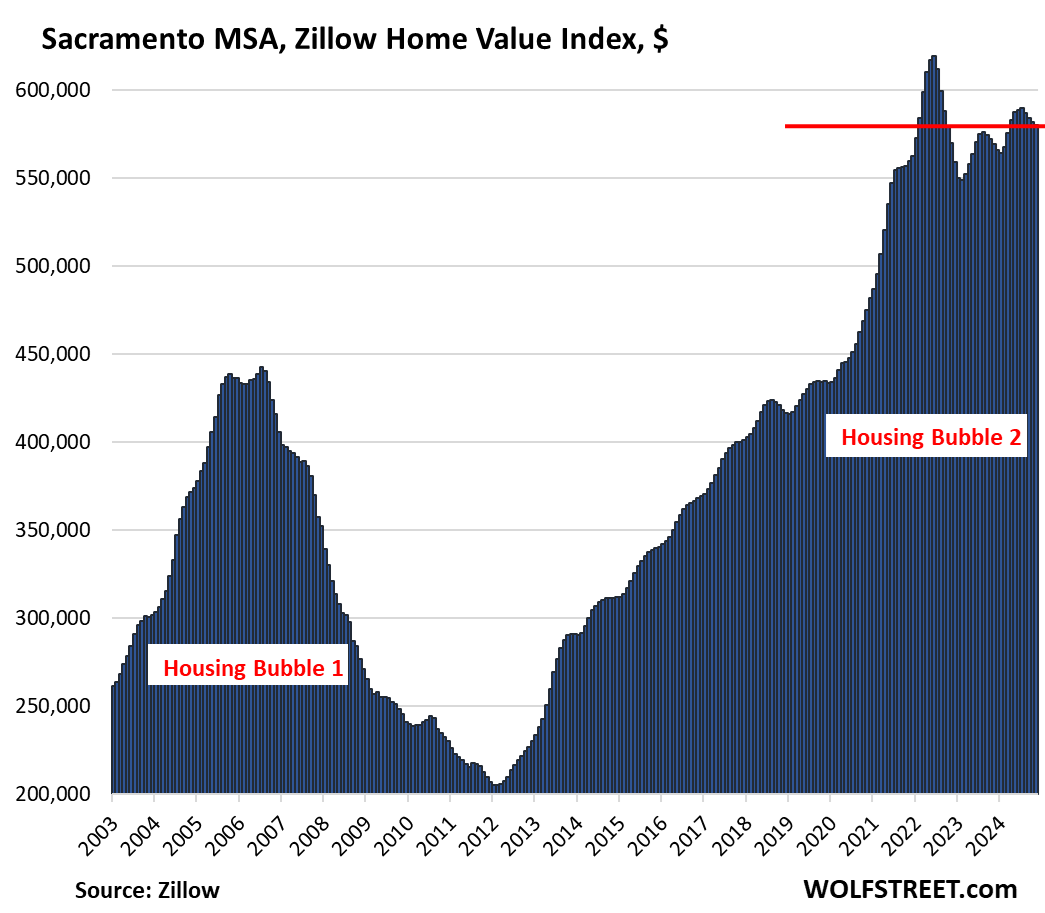
- Sacramento: -6.3%
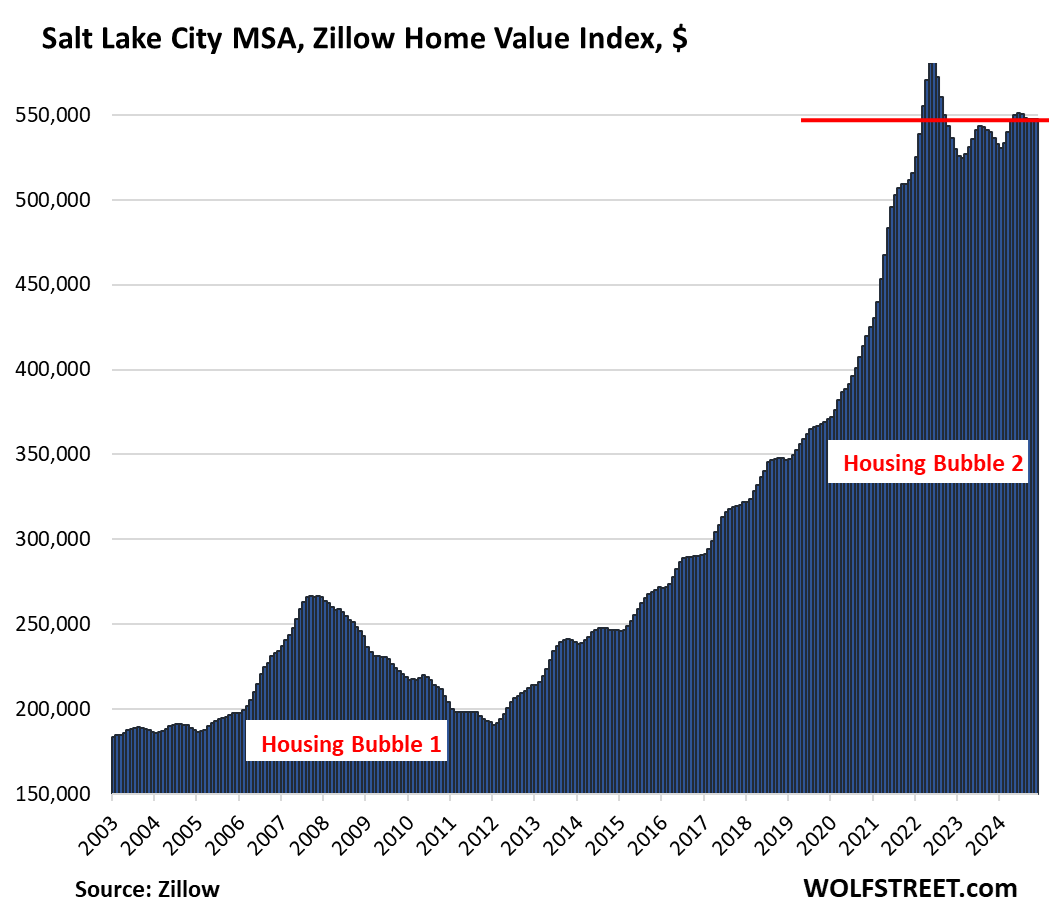
- Salt Lake City: -5.8%
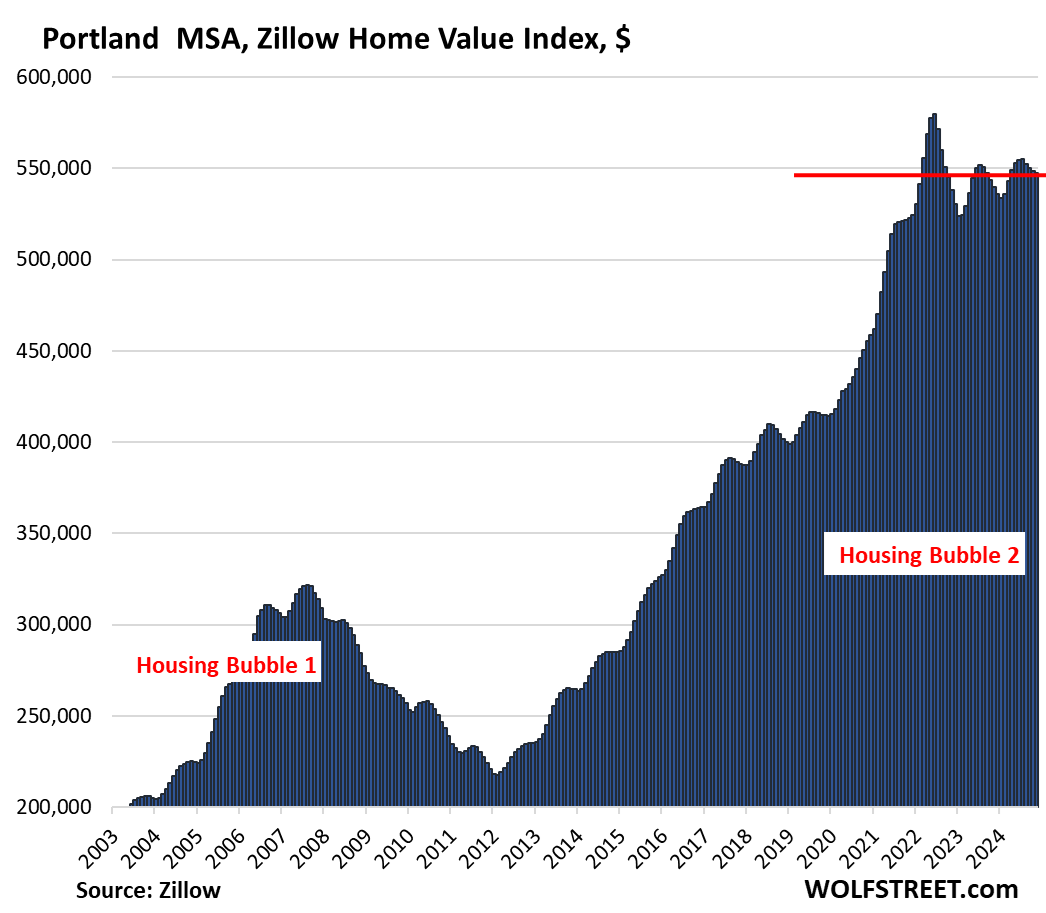
- Portland: -5.6%
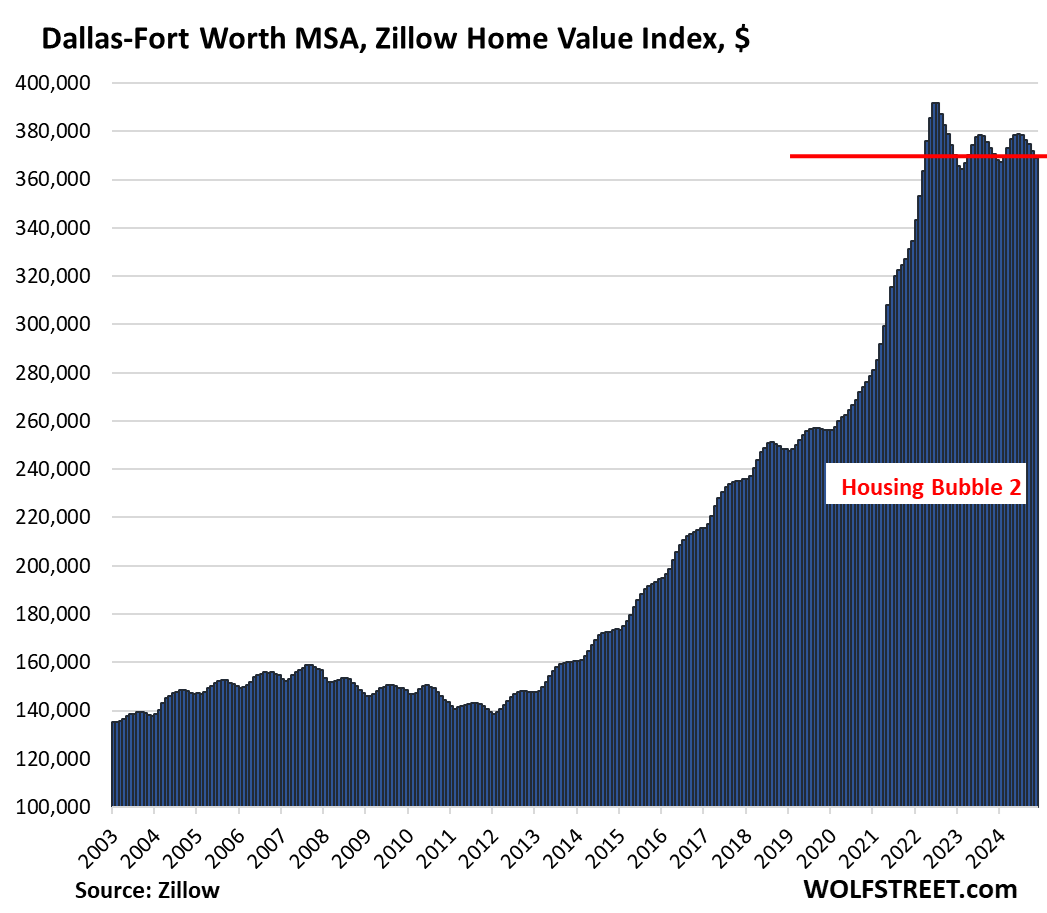
- Dallas: -5.8%
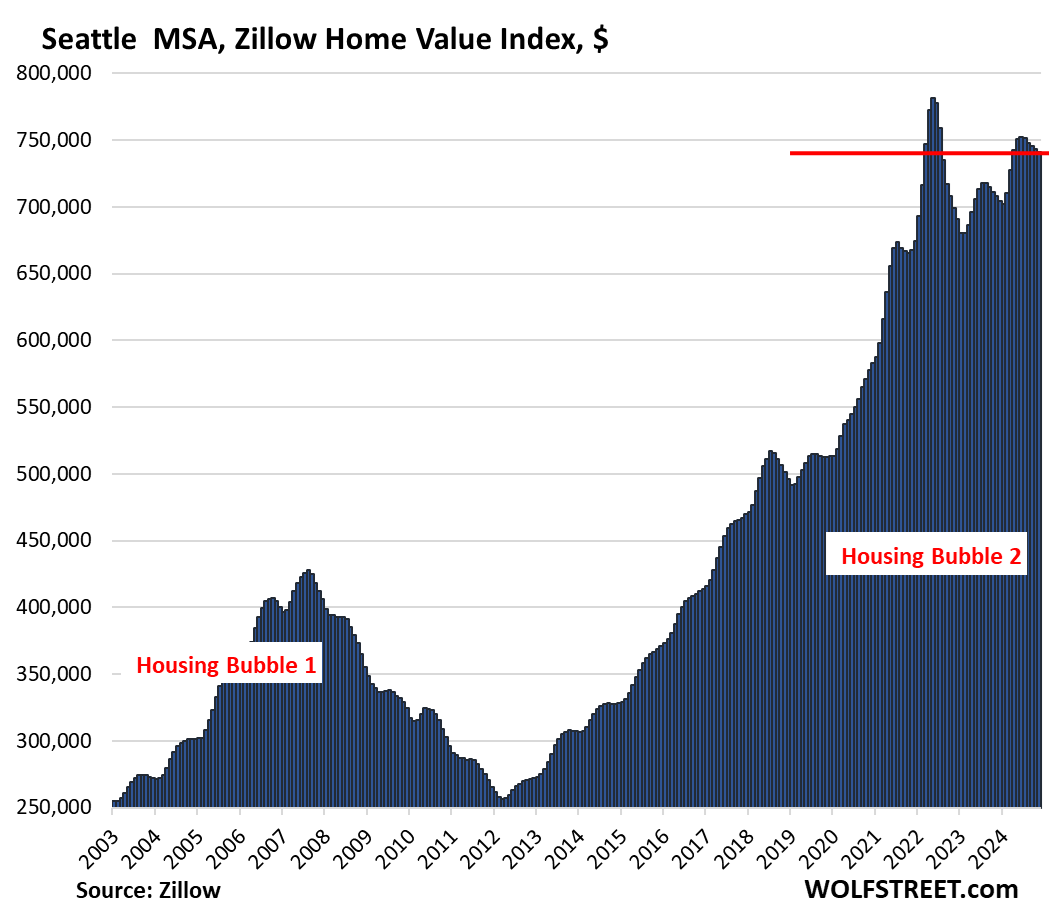
- Seattle: -5.2%
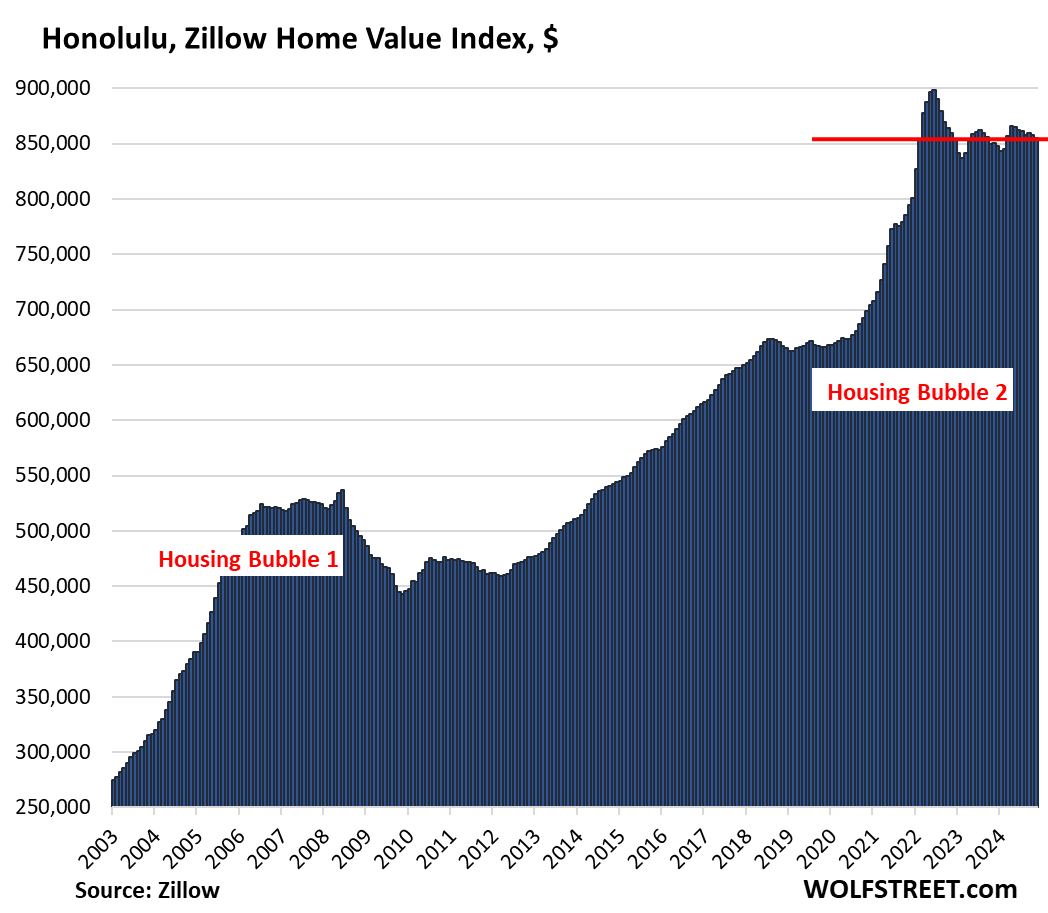
- Honolulu: -4.8%
- Tampa: -3.7%
- Raleigh: -3.4%
- Jacksonville: -3.3
- Nashville: -3.2%
- Houston: -3.1%
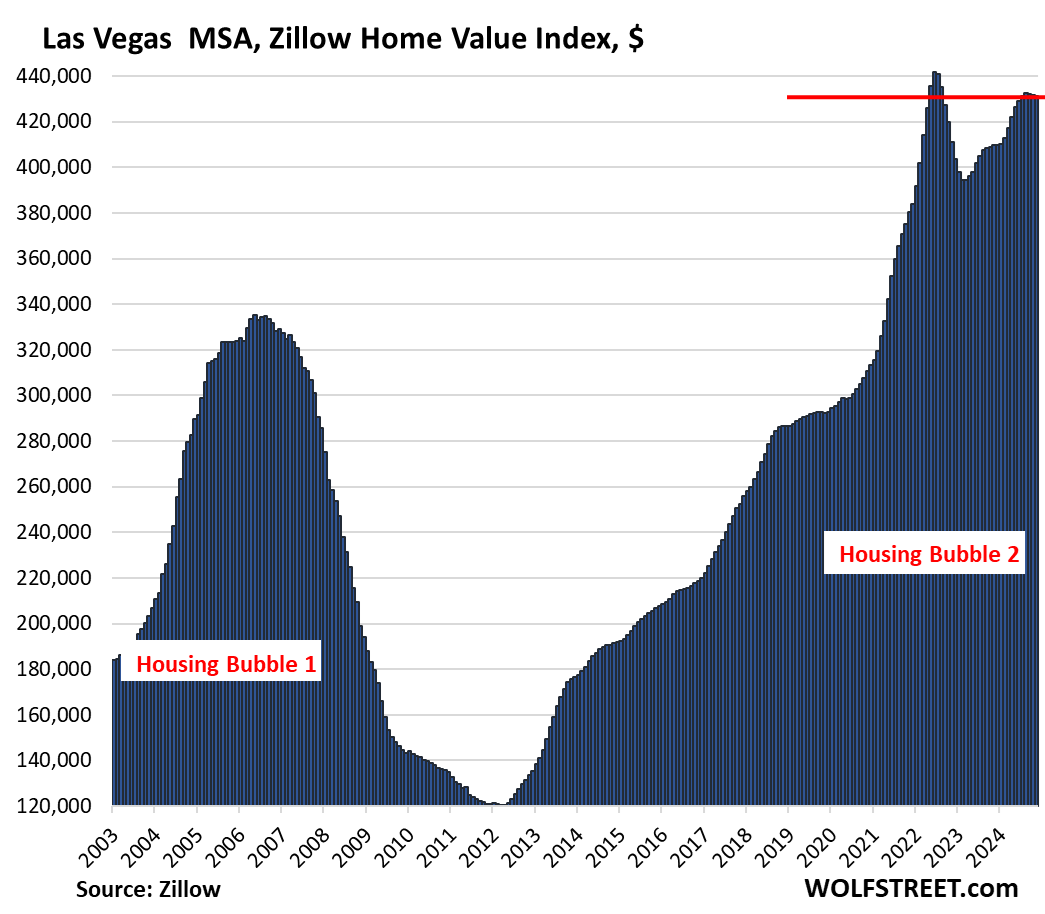
- Las Vegas: -2.4%
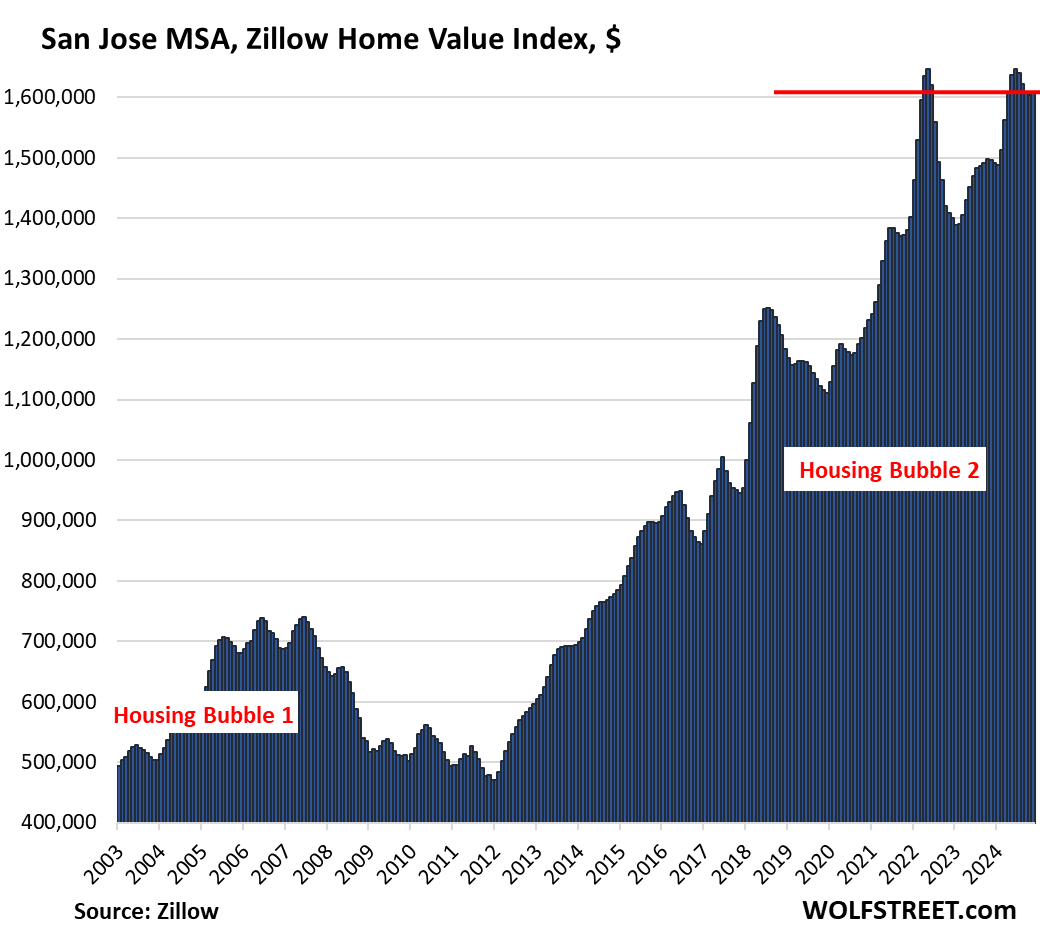
- San Jose: -2.3%
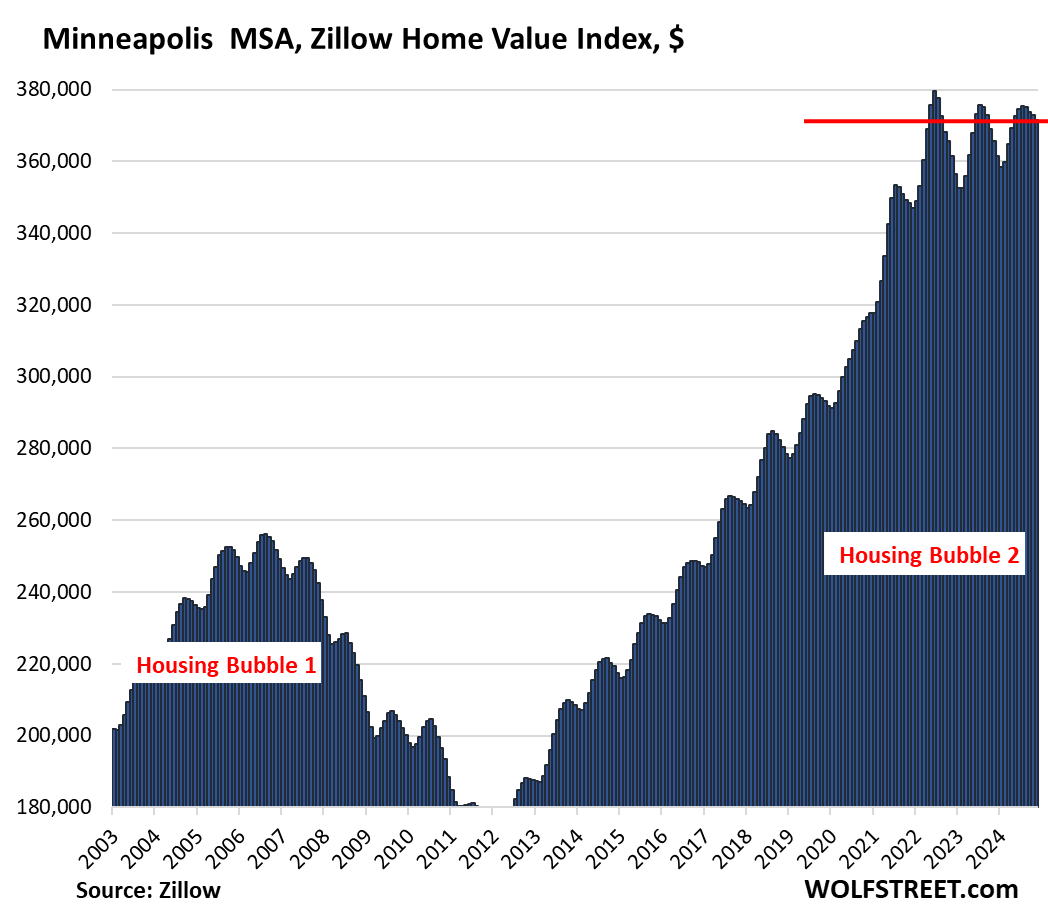
- Minneapolis: -2.1%
No New highs in November:
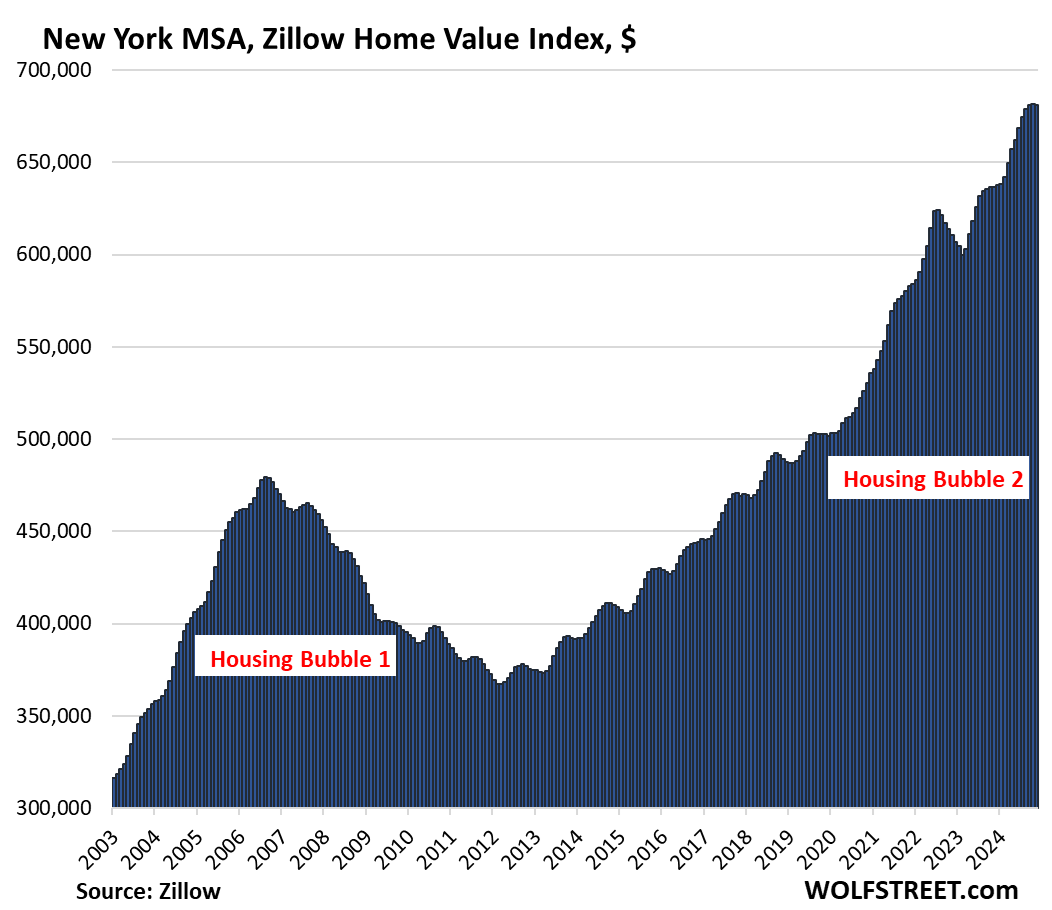
No MSA here of the 33 MSAs made a new high in November. Even prices in the New York City metro dipped for the first time, after the huge run-up. That was the last man standing.
The 30 Most Splendid Housing Bubbles in America.
All data here is from the “raw” mid-tier Zillow Home Value Index (ZHVI), released today. The ZHVI is based on millions of data points in Zillow’s “Database of All Homes,” including from public records (tax data), MLS, brokerages, local Realtor Associations, real-estate agents, and households across the US. It includes pricing data for off-market deals and for-sale-by-owner deals. Zillow’s Database of All Homes also has sales-pairs data.
We started The Most Splendid Housing Bubbles in America series in 2017 to document visually metro-by-metro the surge in home prices fueled by the Fed’s years of interest rate repression and QE. But since 2022, the Fed changed course, mortgage rates have risen, and the Fed has shed $2.1 trillion in assets under its QT program. And so metro-by-metro, and little by little, and sometimes by not so little, housing markets are changing direction.
To qualify for this list, it must be one of the largest MSAs by population, and must have had a ZHVI of over $300,000 at the peak. The metros of New Orleans, Oklahoma City, Tulsa, Cincinnati, Pittsburgh, etc. don’t qualify for this list because their ZHVI has never reached $300,000, despite massive runups of home prices in recent years.
The charts look absurd because the housing market has become absurd.
| Austin MSA, Home Prices | |||
| From Jun 2022 peak | MoM | YoY | Since 2000 |
| -22.0% | -1.1% | -3.4% | 158% |
Prices in Austin have dropped to the lowest level since April 2021.
| San Francisco MSA, Home Prices | |||
| From May 2022 peak | MoM | YoY | Since 2000 |
| -10.2% | -0.3% | 2.0% | 291% |
| Phoenix MSA, Home Prices | |||
| From Jun 2022 peak | MoM | YoY | Since 2000 |
| -8.8% | -0.5% | -0.4% | 221% |
| San Antonio MSA, Home Prices | |||
| From Jul 2022 peak | MoM | YoY | Since 2000 |
| -8.3% | -0.8% | -2.4% | 148.6% |
Prices in San Antonio have dropped to the lowest level since February 2022
| Denver MSA, Home Prices | |||
| From Jun 2022 peak | MoM | YoY | Since 2000 |
| -7.4% | -0.5% | 0.7% | 212% |
| Sacramento MSA, Home Prices | |||
| From July 2022 peak | MoM | YoY | Since 2000 |
| -6.3% | -0.3% | 1.9% | 246.3% |
| Salt Lake City MSA, Home Prices | |||
| From July 2022 peak | MoM | YoY | Since 2000 |
| -5.8% | 0.0% | 2.1% | 214% |
| Portland MSA, Home Prices | |||
| From May 2022 peak | MoM | YoY | Since 2000 |
| -5.6% | -0.2% | 1.4% | 218% |
| Dallas-Fort Worth MSA, Home Prices | |||
| From Jun 2022 peak | MoM | YoY | Since 2000 |
| -5.8% | -0.8% | -0.5% | 193% |
| Seattle MSA, Home Prices | |||
| From May 2022 peak | MoM | YoY | Since 2000 |
| -5.2% | -0.3% | 4.7% | 238% |
| Honolulu, Home Prices | |||
| From Jun 2022 peak | MoM | YoY | Since 2000 |
| -4.8% | -0.4% | 0.6% | 280% |
| Raleigh MSA, Home Prices | |||
| From July 2022 peak | MoM | YoY | Since 2000 |
| -3.4% | -0.5% | 0.9% | 158% |
| Tampa MSA, Home Prices | |||
| From Jul 2022 peak | MoM | YoY | Since 2000 |
| -3.3% | -0.6% | -0.7% | 212% |
| Nashville MSA, Home Prices | |||
| From July 2022 peak | MoM | YoY | Since 2000 |
| -3.2% | -0.3% | 1.3% | 217% |
| Houston MSA, Home Prices | |||
| From Jul 2022 peak | MoM | YoY | Since 2000 |
| -3.1% | -0.6% | 0.4% | 151% |

| San Jose MSA, Home Prices | |||
| From May 2022 peak | MoM | YoY | Since 2000 |
| -2.3% | 0.3% | 7.5% | 337% |
| Las Vegas MSA, Home Prices | |||
| From June 2022 peak | MoM | YoY | Since 2000 |
| -2.4% | -0.1% | 5.2% | 179% |
| Minneapolis MSA, Home Prices | |||
| From May 2022 peak | MoM | YoY | Since 2000 |
| -2.1% | -0.3% | 1.7% | 157% |
| Charlotte MSA, Home Prices | |||
| MoM | YoY | Since 2000 | |
| -0.4% | 1.5% | 170% | |
| San Diego MSA, Home Prices | ||
| MoM | YoY | Since 2000 |
| -0.3% | 3.9% | 334% |
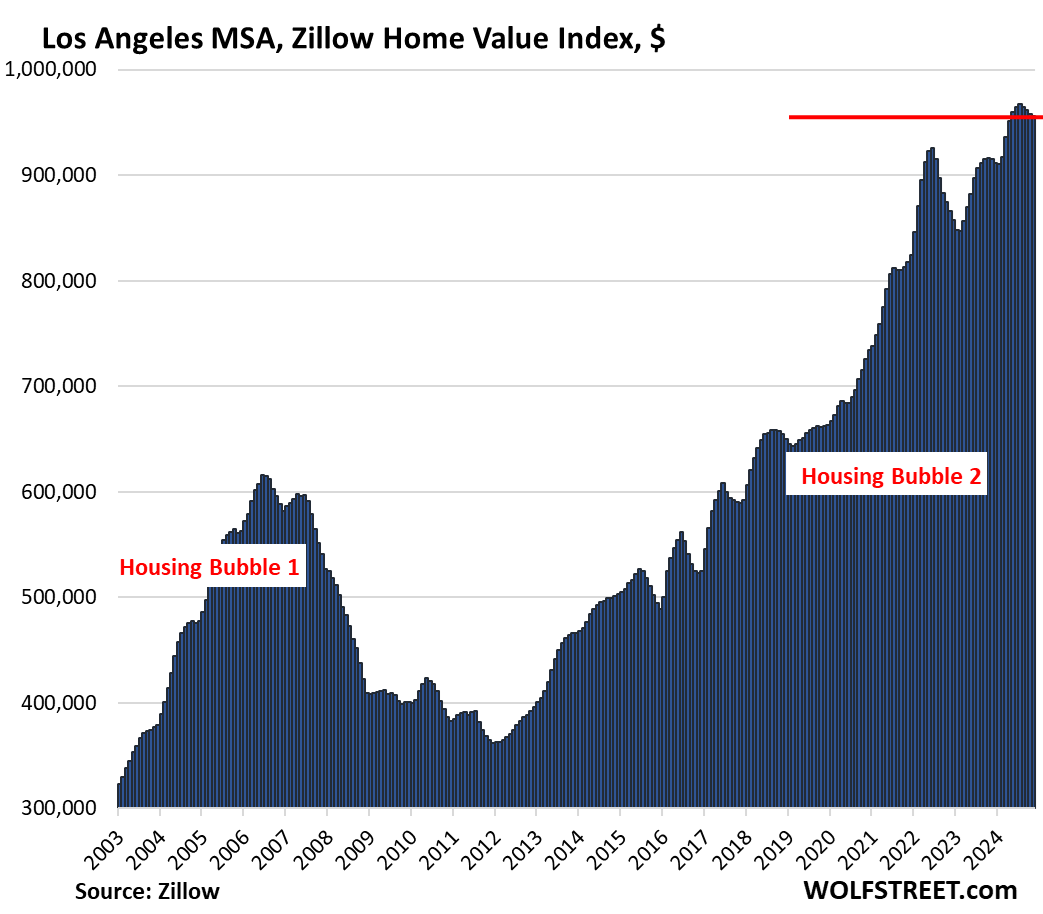
| Los Angeles MSA, Home Prices | ||
| MoM | YoY | Since 2000 |
| -0.2% | 4.5% | 330% |
| Orlando MSA, Home Prices | ||
| MoM | YoY | Since 2000 |
| -0.6% | 0.0% | 236.5% |
| Milwaukee MSA, Home Prices | ||
| MoM | YoY | Since 2000 |
| -0.7% | 4.8% | 143.9% |
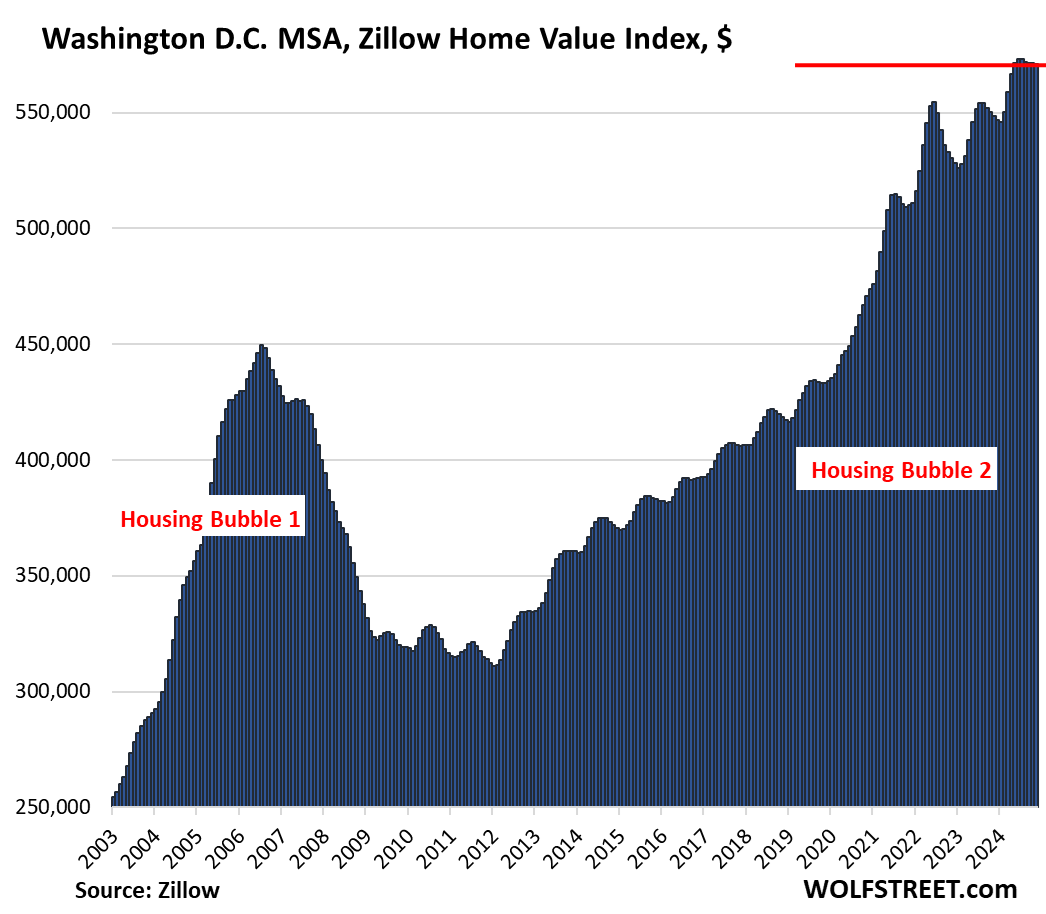
| Washington D.C. MSA, Home Prices | |||
| MoM | YoY | Since 2000 | |
| -0.1% | 4.1% | 215% | |
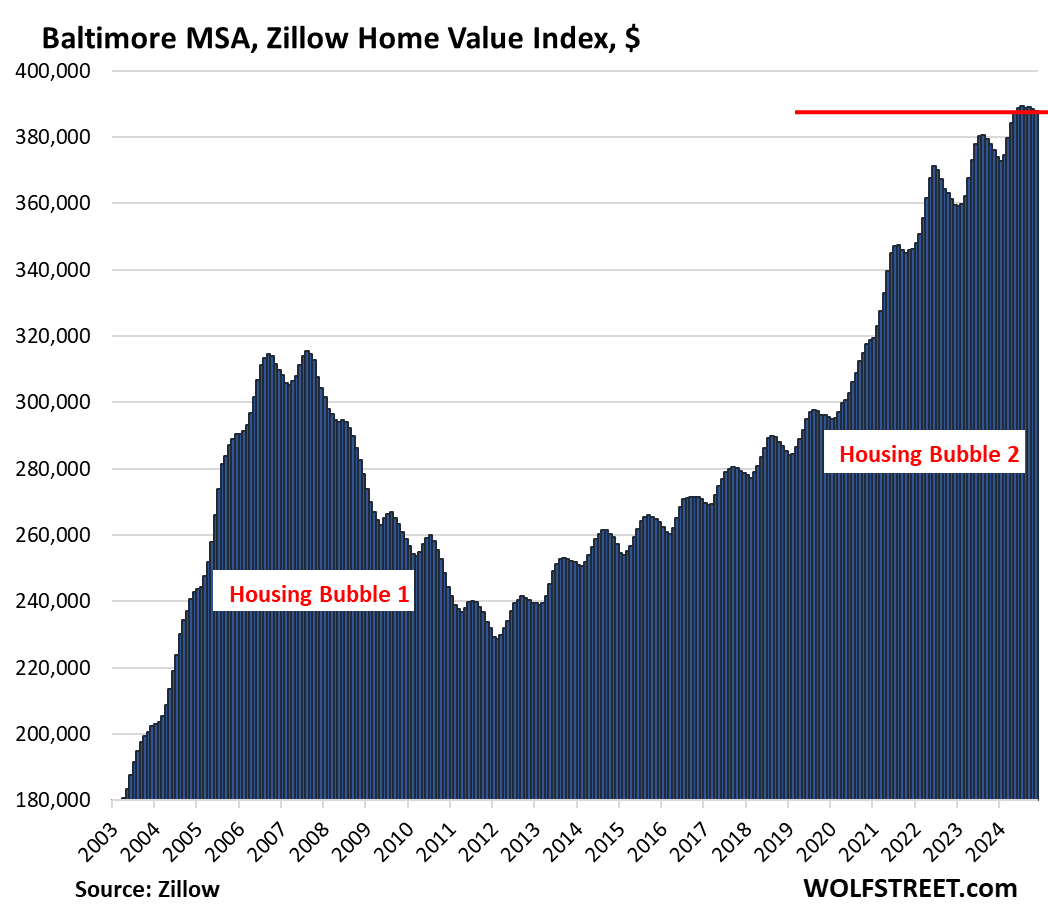
| Baltimore MSA, Home Prices | |||
| MoM | YoY | Since 2000 | |
| -0.2% | 3.1% | 174% | |
| Miami MSA, Home Prices | ||
| MoM | YoY | Since 2000 |
| -0.6% | 1.4% | 331.0% |
| Atlanta MSA, Home Prices | ||
| MoM | YoY | Since 2000 |
| -0.7% | 0.6% | 162% |
| Kansas City MSA, Home Prices | ||
| MoM | YoY | Since 2000 |
| -0.3% | 3.2% | 176% |
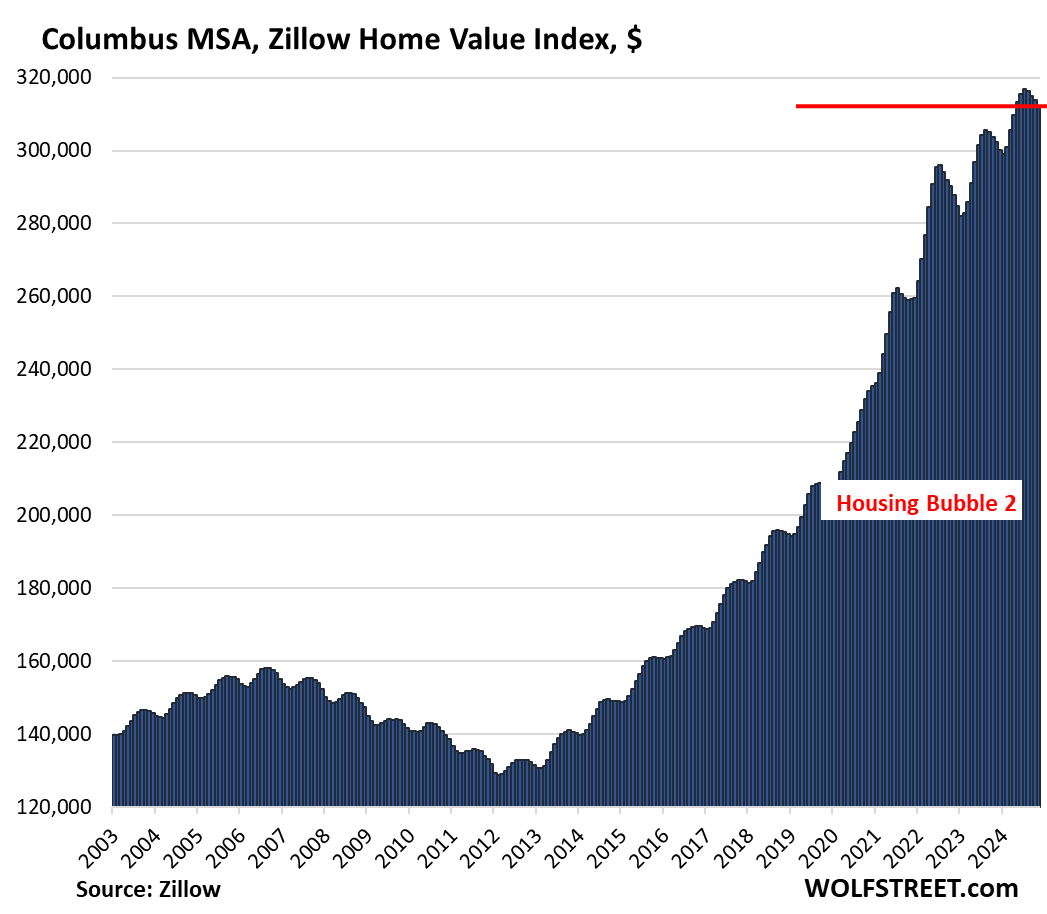
| Columbus MSA, Home Prices | ||
| MoM | YoY | Since 2000 |
| -0.5% | 3.3% | 153% |
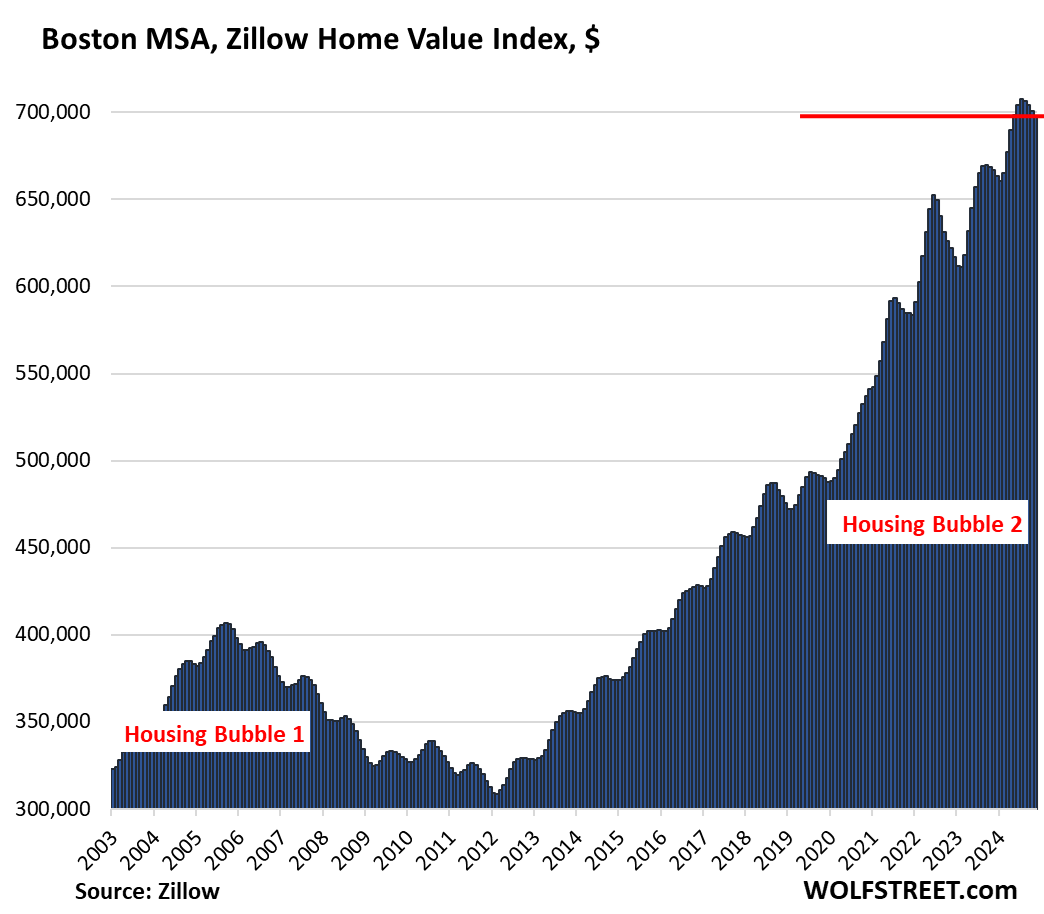
| Boston MSA, Home Prices | ||
| MoM | YoY | Since 2000 |
| -0.4% | 4.6% | 225% |
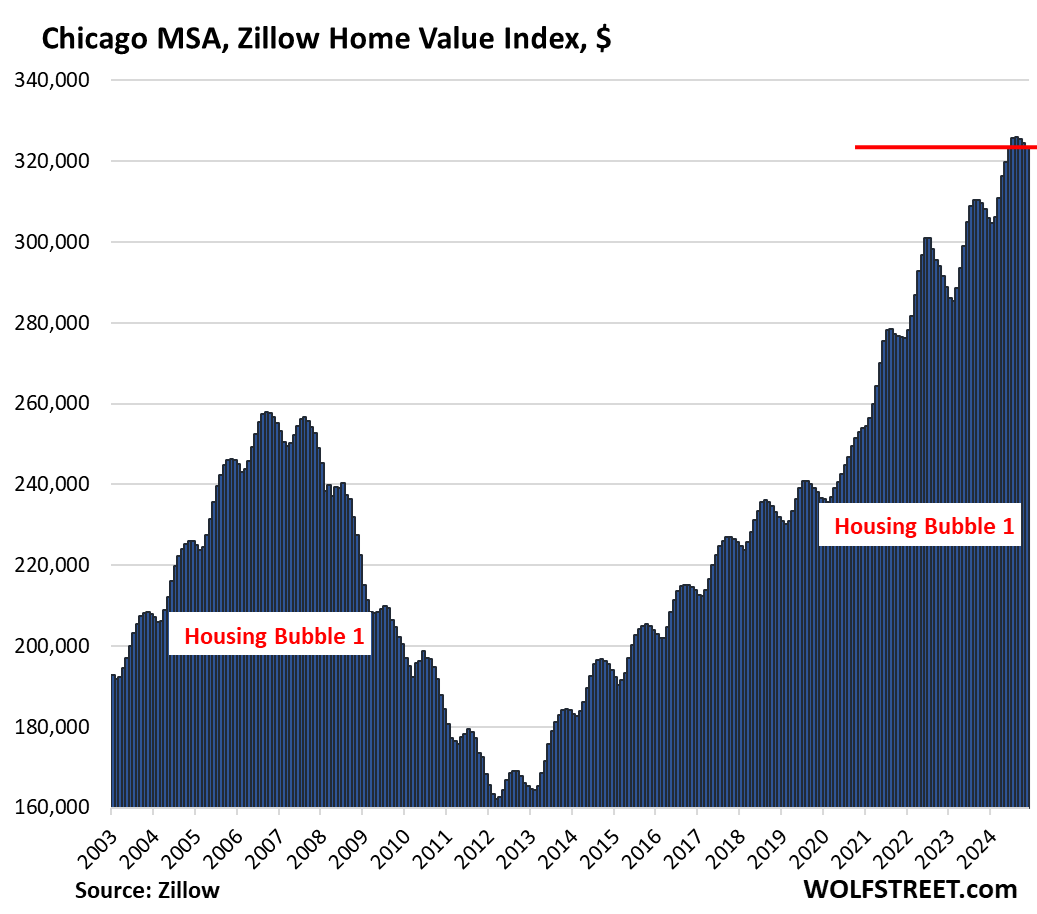
| Chicago MSA, Home Prices | ||
| MoM | YoY | Since 2000 |
| -0.3% | 5.0% | 112% |
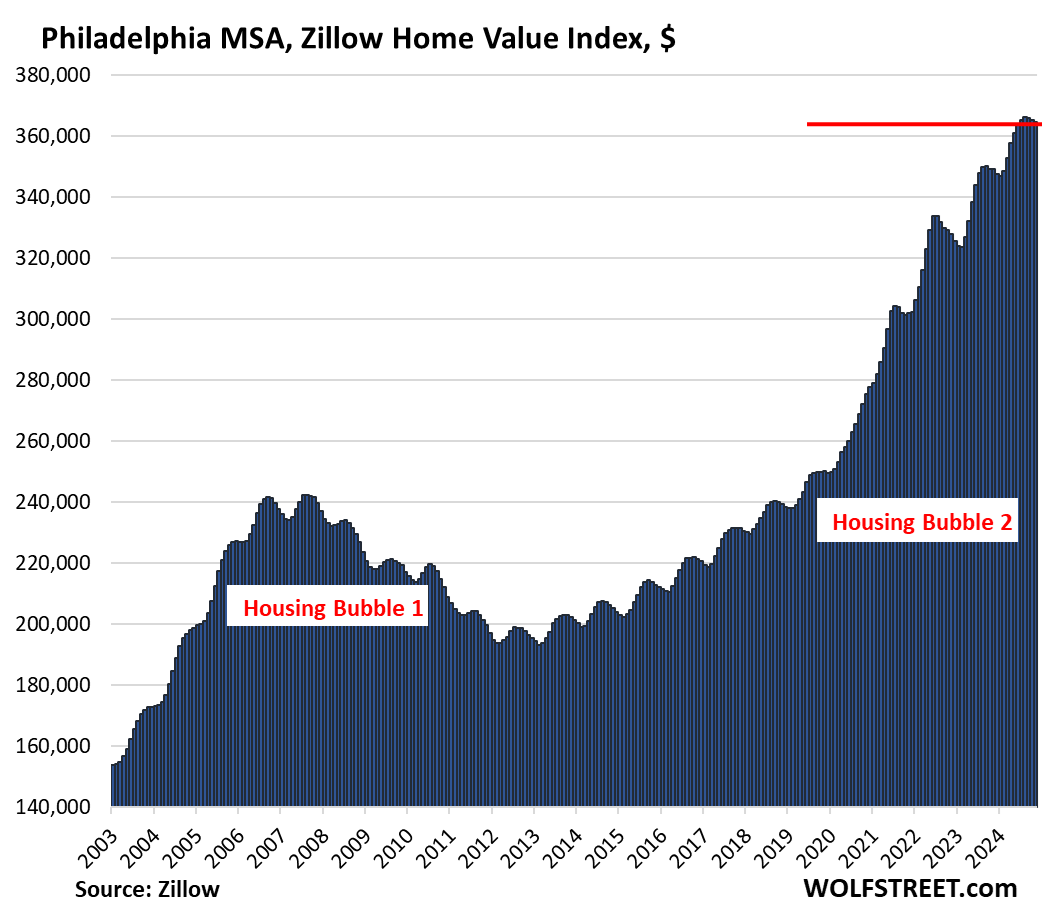
| Philadelphia MSA, Home Prices | ||
| MoM | YoY | Since 2000 |
| -0.2% | 4.5% | 201% |
| New York MSA, Home Prices | ||
| MoM | YoY | Since 2000 |
| -0.1% | 7.0% | 212% |
We give you energy news and help invest in energy projects too, click here to learn more
Crude Oil, LNG, Jet Fuel price quote
ENB Top News
ENB
Energy Dashboard
ENB Podcast
ENB Substack