ENB Pub Note: This article was first run on RHG Phoenix Petroleum’s Blog. We will be interviewing them on the podcast soon.
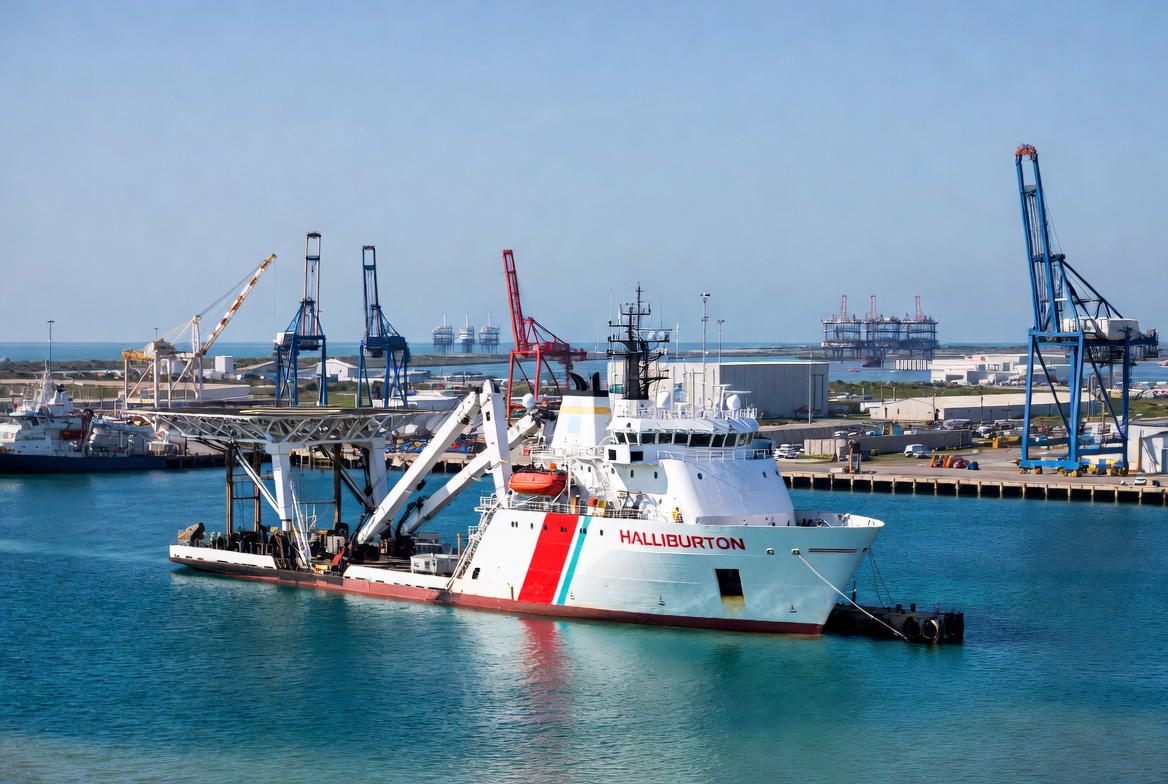
Halliburton executives signaled a positive outlook for North American oilfield activity in 2026 during the company’s second-quarter 2026 earnings release and conference call on July 21, 2026. The Houston-based oilfield services giant highlighted recent gains in U.S. drilling and completions activity, supported by higher oil prices and increased rig counts, as a key driver for expected improvement ahead.
This outlook comes amid broader strength in the U.S. shale sector, where production has reached record levels thanks to the shale revolution, LNG export growth, and better capture of associated (flared) gas.
U.S. Crude Oil Production Surge Over Two Decades
U.S. crude oil production has transformed dramatically over the past 20 years. Prior to the shale boom, output hovered around 5 million barrels per day (mbpd). Horizontal drilling and hydraulic fracturing unlocked vast shale resources, driving a sharp rise starting in the late 2000s.U.S. Crude Oil Production (Average Annual, million barrels per day, 2005–2025)
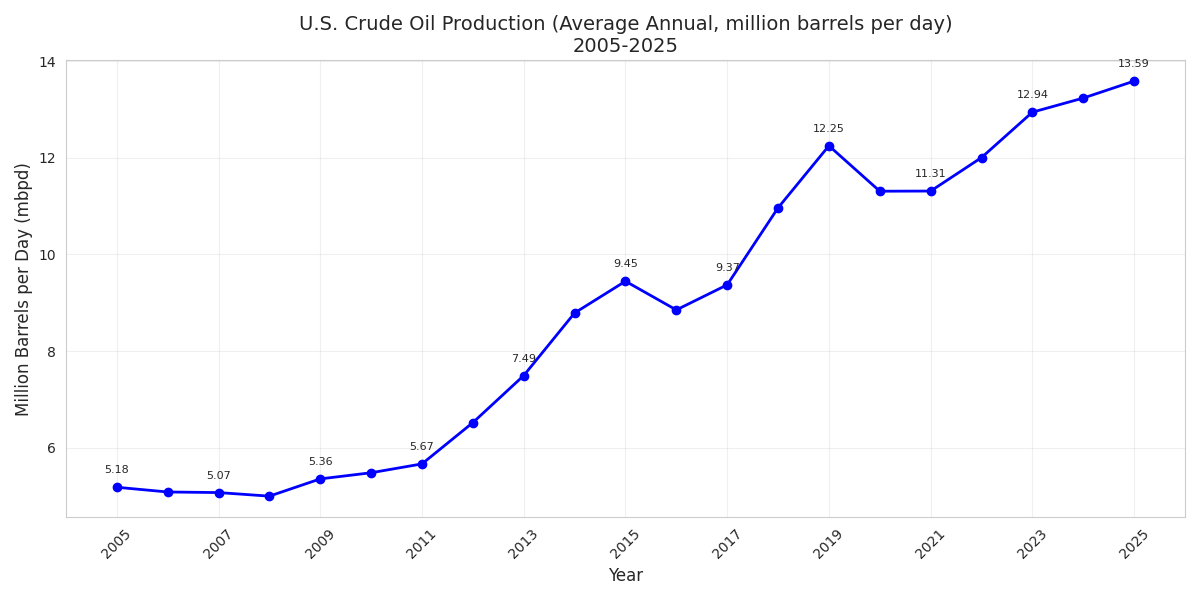
Key milestones (EIA data):
2005: 5.184 mbpd
2008: 5.000 mbpd (pre-shale peak)
2015: 9.446 mbpd
2019: 12.248 mbpd (pre-COVID high)
2020: 11.308 mbpd (COVID dip)
2024: 13.235 mbpd
2025: ~13.586 mbpd (new record annual average)
Production has consistently climbed to new highs in recent years, with monthly peaks exceeding 13.8 mbpd in late 2025. This surge underpins strong demand for Halliburton’s drilling, completion, and production services in key basins like the Permian, Bakken, and Eagle Ford.
Natural Gas Production and the Flared Gas Story
U.S. marketed natural gas production has also grown steadily, reaching record levels. In 2025, marketed production hit approximately 43.2 trillion cubic feet (Tcf) annually.
A major contributor has been the capture of associated gas from oil wells—particularly in the Permian Basin. In earlier shale years, significant volumes were flared due to limited takeaway capacity. Flaring peaked around 2019 at over 539 billion cubic feet (Bcf) before declining sharply as pipelines, processing plants, and infrastructure expanded.
This reduction in flaring not only improved environmental performance but also added substantial volumes to marketed gas supply, supporting the overall production boom.LNG Exports: Turning the U.S. into a Net Exporter
The growth of U.S. liquefied natural gas (LNG) exports has been transformative. The U.S. went from a net natural gas importer for decades to a net exporter starting in 2017. It became a net total energy exporter in 2019.
LNG export capacity ramped up rapidly after the first cargoes left Sabine Pass in 2016. The U.S. is now the world’s largest LNG exporter.
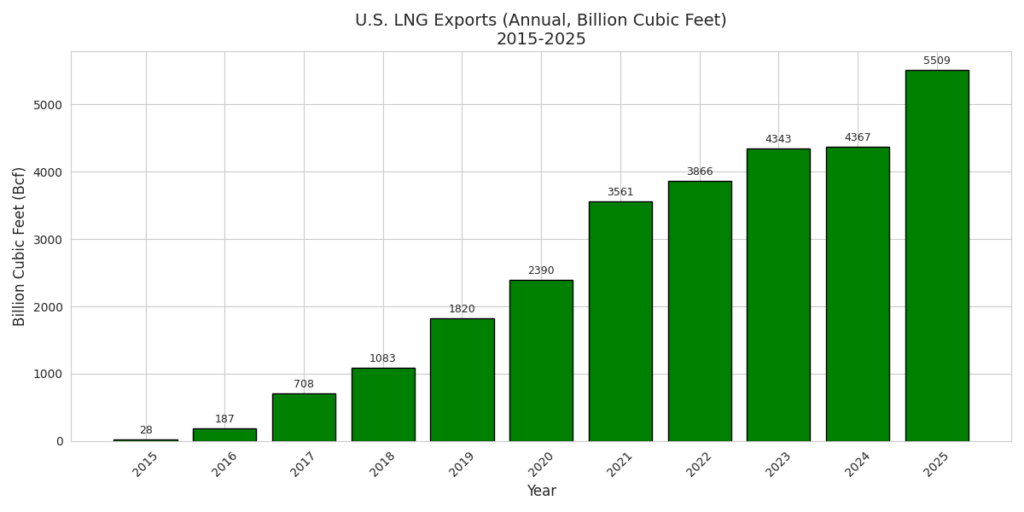
LNG export volumes (million cubic feet):2015: ~28 million cf
2019: ~1.82 billion cf
2020: ~2.39 billion cf
2025: ~5.51 billion cf (record, ~26% of global LNG exports)
In 2025, U.S. LNG exports reached about 15.1 Bcf/d, with strong demand from Europe and Asia. EIA projects further growth to ~17.4 Bcf/d in 2026.
Capturing previously flared associated gas has directly fed this export boom by increasing available supply for liquefaction.
Implications for Halliburton and the Sector
Halliburton’s positive view on North American activity in 2026 aligns with these fundamentals. Recent U.S. rig count gains (roughly +46 oil-directed rigs from December lows) and higher oil prices have encouraged producers—especially private operators—to increase drilling and completions.
While international operations face some near-term pressures (e.g., Middle East disruptions), North American land activity is showing clear signs of improvement. Halliburton and peers benefit from sustained high utilization of fracturing fleets, drilling rigs, and related services in the shale plays.
The combination of record U.S. oil and gas production, reduced flaring, and world-leading LNG exports has solidified America’s position as a global energy superpower. This provides a stable, growing market for oilfield services companies like Halliburton heading into 2026 and beyond.
Appendix: Sources and Links
- Bloomberg article (paywalled): https://www.bloomberg.com/news/articles/2026-07-21/halliburton-sees-improvement-in-north-american-activity-in-2026?srnd=phx-industries
- EnergyNow.com summary on Halliburton and sector earnings (July 21, 2026): https://energynow.com/2026/07/oil-service-companies-set-to-reveal-wars-impact-on-earnings/
- U.S. EIA Crude Oil Production data: https://www.eia.gov/dnav/pet/pet_crd_crpdn_adc_mbbl_a.htm and historical series https://www.eia.gov/dnav/pet/hist/LeafHandler.ashx?n=PET&s=MCRFPUS2&f=A
- U.S. EIA Natural Gas Marketed Production: https://www.eia.gov/dnav/ng/ng_prod_sum_a_EPG0_VGM_mmcf_a.htm
- U.S. EIA LNG Exports: https://www.eia.gov/dnav/ng/ng_sum_lsum_a_epg0_eng_mmcf_a.htm
- U.S. EIA Vented and Flared Natural Gas: https://www.eia.gov/dnav/ng/hist/n9040us2a.htm
- EIA on U.S. net energy exporter status: https://www.eia.gov/energyexplained/us-energy-facts/imports-and-exports.php
- Additional context from EIA Short-Term Energy Outlook and Natural Gas Monthly reports (various 2026 releases)
All data and charts are based on publicly available EIA statistics and reputable energy news sources as of July 2026. Production figures for 2025 are annual averages or estimates based on EIA reporting.
If you have questions on investments with tax advantages, check out our Why RHG Phoenix Page.