A person fishes with offshore oil and gas platform Esther in the distance on January 5, 2025 in Seal Beach, California. Photo by Mario Tama-Getty Images
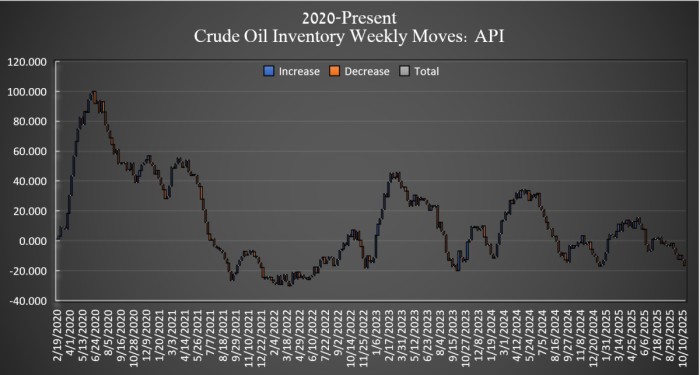
In a surprising turn for energy markets, the latest Weekly Petroleum Status Report from the U.S. Energy Information Administration (EIA) reveals a drawdown in U.S. commercial crude oil inventories, challenging the prevailing narrative of an oil glut that has weighed on prices in recent months. For the week ending October 17, 2025, crude stocks fell by 1 million barrels to 422.8 million barrels, positioning them about 4% below the five-year average for this period.
This decline comes amid ongoing discussions about oversupply driven by non-OPEC production growth and softer global demand signals, yet the data suggests tightening fundamentals that could support a rebound in benchmark prices like WTI and Brent.
The report, released on October 22, 2025, with the next update scheduled for October 29, 2025, provides a snapshot of not just crude but also refined products. Here’s a breakdown of the major categories:
Category
Current Level (million barrels)
Change from Previous Week (million barrels)
Comparison to Five-Year Average
Crude Oil (excl. SPR)
422.8
-1.0
4% below
Total Motor Gasoline
216.7
-2.1
Slightly below
Distillate Fuel
115.6
-1.5
7% below
Propane/Propylene
Not specified
+0.8
12% above
Refinery operations also showed some softening, with crude oil inputs averaging 15.7 million barrels per day—a drop of 601,000 barrels per day from the prior week.
Utilization rates dipped to 88.6%, down from a four-week average of 89.5%, potentially reflecting seasonal maintenance or demand adjustments.
On the production side, gasoline output rose to 9.6 million barrels per day, while distillate production edged up to 4.6 million barrels per day.
Imports provided a mixed picture: Crude imports climbed to 5.9 million barrels per day, up 393,000 from the previous week, but overall net imports for crude over four weeks stood at 1.917 million barrels per day.
Meanwhile, total commercial petroleum inventories shed 4.2 million barrels, landing at 1,693.2 million barrels.
Product supplied—a proxy for demand—averaged 20.5 million barrels per day over the past four weeks, essentially flat year-over-year, with gasoline demand down 3.6% but distillates up slightly by 0.2%.
This inventory draw counters the glut narrative that has dominated headlines, fueled by record U.S. production and OPEC+ decisions to maintain output. Analysts had anticipated a build in some forecasts, but the actual decline could signal stronger-than-expected refining demand or export activity, bolstering arguments for a more balanced market heading into winter.
Natural Gas Storage: Building Ahead of Heating Season
Shifting to natural gas, the EIA’s Weekly Natural Gas Storage Report for the same week ending October 17, 2025, showed continued injections as operators prepare for peak winter demand. Total working gas in underground storage across the Lower 48 states reached 3,808 billion cubic feet (Bcf), marking a net increase of 87 Bcf from the prior week.
This build exceeded the five-year average injection of 77 Bcf and last year’s 79 Bcf, pushing stocks 5% above the five-year norm at 164 Bcf over the 3,644 Bcf average.
Compared to the same week in 2024, storage is up by 34 Bcf.
Regional variations highlight the South Central region’s strong build of +34 Bcf, while the Midwest added 29 Bcf.
These levels provide a comfortable cushion against potential cold snaps, though milder weather forecasts could cap price upside in the near term.
Market Implications and Outlook
The draw in crude inventories arrives at a pivotal moment, with WTI futures hovering around recent lows amid geopolitical tensions in the Middle East and economic uncertainties in China. If sustained, these tighter stocks could undermine bearish sentiment and encourage speculative buying. However, with U.S. production remaining robust and global growth concerns lingering, the glut narrative isn’t entirely dispelled—yet this week’s data offers a compelling counterpoint.
For natural gas, the healthy storage build reinforces a stable supply picture, likely keeping Henry Hub prices range-bound unless demand surprises emerge. Traders should monitor upcoming reports for any shifts, as heating degree days ramp up.
Stay tuned to Energy News Beat for real-time updates on energy markets, where data drives the discussion.
August 17, 2022 Data source: U.S. Energy Information Administration, Short-Term Energy Outlook (STEO) Changes to both production and consumption of global liquid fuels have changed our forecast for balances between the two for the rest […]
<img src=”” title=”Product Highlight: EIA’s Hourly Electric Grid Monitor” /> December 6, 2022 Data source: U.S. Energy Information Administration, Hourly Electric Grid Monitor Our Hourly Electric Grid Monitor provides up-to-the-hour information on electricity demand across the […]
U.S. ethane production, consumption, and exports established new record highs in 2023, according to data from our Petroleum Supply Monthly. Continued growth in ethane consumption in the global petrochemical sector and rising ethane recovery associated with […]
We use cookies to ensure that we give you the best experience on our website. If you continue to use this site we will assume that you are happy with it.