The U.S. oil and gas rig count continues its decline, with Baker Hughes reporting a drop of 7 rigs to 547 for the week ending June 27, 2025, the lowest since October 2021. Oil rigs fell by 6 to 432, and gas rigs dropped by 2 to 109, with 5 miscellaneous rigs unchanged. Globally, rig activity reflects varied market dynamics. Despite the downturn, robust production and tightening inventories suggest the oil and gas sector remains resilient. This article breaks down rig counts by U.S. basin and key countries, splits them by oil and gas, and explores what these trends mean for investors in the context of weekly oil and gas inventories.
U.S. Rig Count: Basin-by-Basin Breakdown
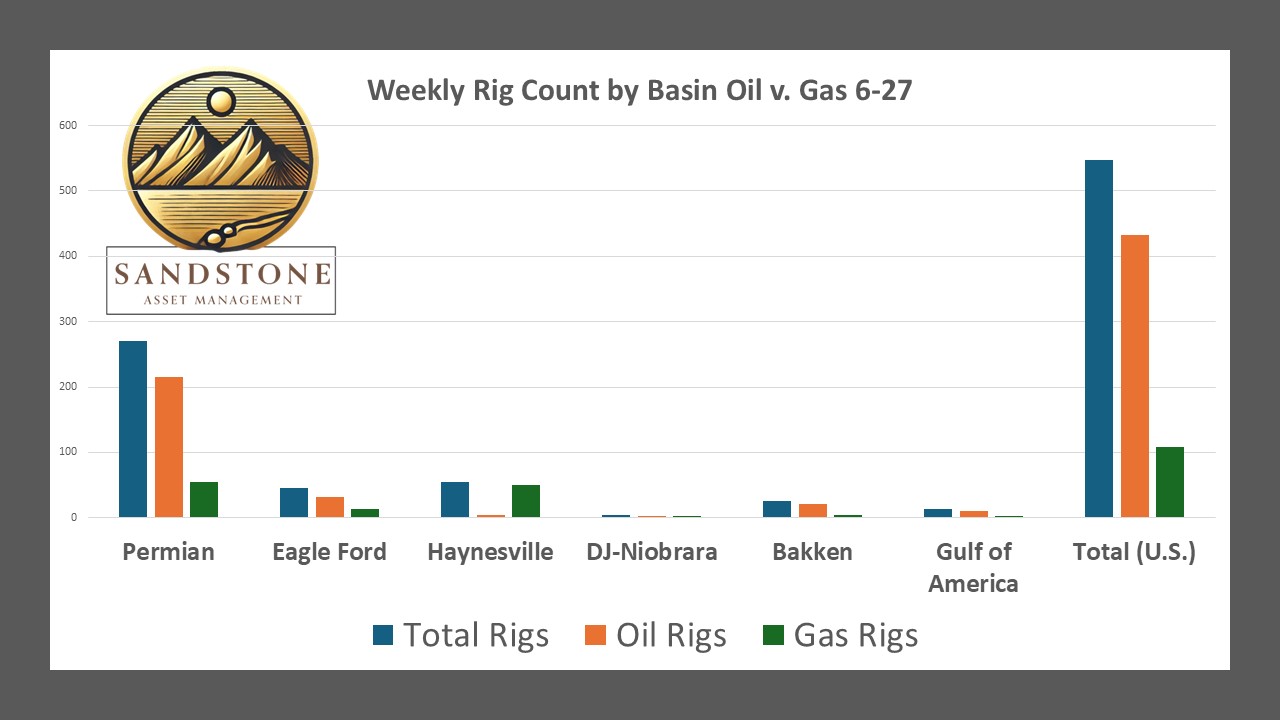
The decline in U.S. rigs is uneven across major basins, driven by weak oil prices and a strategic shift toward shareholder returns over production growth. Below is an estimated breakdown based on Baker Hughes data and recent trends, as specific basin-level counts for June 27, 2025, are not fully detailed in available sources. Oil and gas splits are approximated using historical basin profiles.
-
Permian Basin (West Texas, Eastern New Mexico): The nation’s top oil-producing basin saw rigs drop to 278 in May 2025, the lowest since November 2021. Recent X posts suggest further declines, possibly to 270 by June 27. Oil rigs dominate (80%), with gas rigs at ~20%, reflecting the basin’s oil-heavy focus and sensitivity to WTI prices below breakeven for some operators.
-
Eagle Ford (South Texas): Rigs were ~50 in April 2025, with ~70% oil and ~30% gas. Declining gas prices likely reduced this to ~45 rigs, maintaining a similar oil-gas split, as operators scale back gas-focused drilling.
-
Haynesville (Arkansas, Louisiana, Texas): This gas-rich basin had 62 rigs in May 2023, but low gas prices likely cut this to 55 by June 2025. Gas rigs dominate (90%), with oil rigs minimal (~10%).
-
Denver-Julesburg (DJ)-Niobrara (Colorado, Wyoming): Rigs fell to 5 in May 2025, the lowest since January 2021, with ~60% oil and ~40% gas. No significant recovery is expected, holding at ~5 rigs.
-
Bakken (North Dakota, Montana): Rigs were 30 in April 2025, primarily oil-focused (85% oil, ~15% gas). Declines likely reduced this to ~25 rigs, aligning with broader trends.
-
Gulf of Mexico (Offshore): Offshore rigs rose to 14 in June 2025, up 4 from prior weeks, with ~80% oil and ~20% gas, showing resilience despite high costs.
U.S. Rig Count Summary (Estimated for June 27, 2025):
|
Basin
|
Total Rigs
|
Oil Rigs
|
Gas Rigs
|
% Oil
|
% Gas
|
|---|---|---|---|---|---|
|
Permian
|
270
|
216
|
54
|
80%
|
20%
|
|
Eagle Ford
|
45
|
32
|
13
|
70%
|
30%
|
|
Haynesville
|
55
|
5
|
50
|
10%
|
90%
|
|
DJ-Niobrara
|
5
|
3
|
2
|
60%
|
40%
|
|
Bakken
|
25
|
21
|
4
|
85%
|
15%
|
|
Gulf of Mexico
|
14
|
11
|
3
|
80%
|
20%
|
|
Total (U.S.)
|
547
|
432
|
109
|
79%
|
20%
|
Global Rig Count: Country-by-Country Breakdown
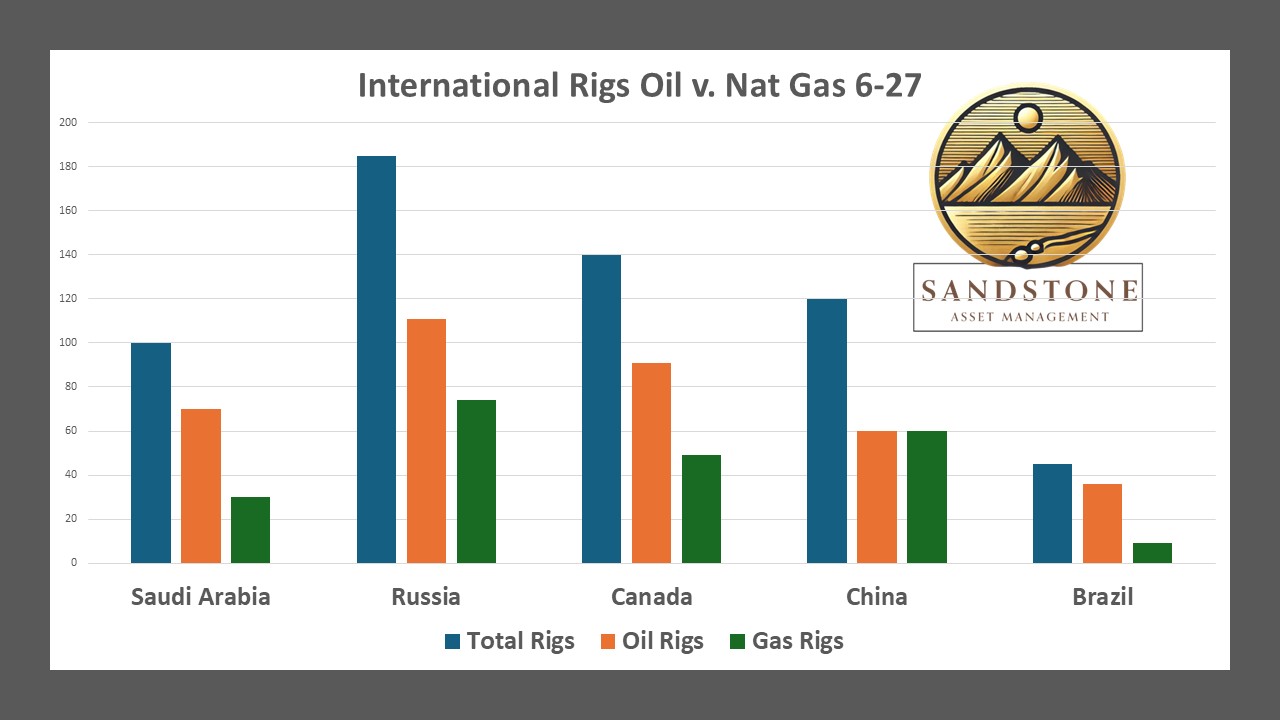
Global rig counts are reported monthly by Baker Hughes, with June 2025 data unavailable as of June 27. Below is an estimated breakdown based on 2024 trends and early 2025 data, focusing on key countries. Oil and gas splits reflect each country’s production profile.
-
Saudi Arabia: ~100 rigs in 2024, with ~70% oil and ~30% gas. Stable activity is expected, supported by OPEC+ production goals.
-
Russia: ~200 rigs in 2024, with ~60% oil and ~40% gas. Sanctions may have reduced this to ~185 rigs, with a similar split.
-
Canada: ~150 rigs in May 2025, with ~65% oil and ~35% gas. Seasonal declines likely cut this to ~140 rigs.
-
China: ~120 rigs, with ~50% oil and ~50% gas. Energy security priorities maintain steady counts.
-
Brazil: ~45 rigs, primarily offshore, with ~80% oil and ~20% gas, driven by deepwater projects.
Global Rig Count Summary (Estimated for June 2025):
|
Country
|
Total Rigs
|
Oil Rigs
|
Gas Rigs
|
% Oil
|
% Gas
|
|---|---|---|---|---|---|
|
Saudi Arabia
|
100
|
70
|
30
|
70%
|
30%
|
|
Russia
|
185
|
111
|
74
|
60%
|
40%
|
|
Canada
|
140
|
91
|
49
|
65%
|
35%
|
|
China
|
120
|
60
|
60
|
50%
|
50%
|
|
Brazil
|
45
|
36
|
9
|
80%
|
20%
|
Inventory Trends and Investor Implications
Weekly inventory data and production forecasts provide critical context for investors navigating the rig count decline.
-
Oil Inventories and Production: The EIA reported a 5.8 million barrel drop in U.S. crude oil stockpiles for the week ending June 20, 2025, signaling tighter supplies. U.S. crude production edged up to 13.431 million bpd, a 3,000 bpd increase, despite fewer rigs, reflecting improved well efficiency. The EIA projects 2025 output at 13.6 million bpd, up from 13.2 million bpd in 2024. For investors, this suggests resilience in major producers (e.g., Permian operators), but smaller firms face risks from low WTI prices, with companies like Diamondback and Coterra cutting rigs. Bullish signals include tightening inventories and projected demand growth, but volatility from tariffs and OPEC+ decisions warrants caution.
-
Natural Gas Inventories and Production: Net injections into gas storage were 96 Bcf for the week ending June 20, 2025, above the five-year average of 79 Bcf, with stocks at 2,898 Bcf, 7% above the five-year average. Henry Hub spot prices fell to $3.26/MMBtu, down 22 cents, reflecting oversupply pressures. However, the EIA projects a 95% spot price increase in 2025, boosting drilling. Gas output is forecast to rise to 105.3 bcfd from 103.2 bcfd in 2024. Investors should note potential upside in gas producers if prices rebound, particularly in the Haynesville, but near-term oversupply and low prices favor larger, diversified firms over smaller gas-focused operators.
Investor Takeaways:
-
Bullish Signals: Tightening oil inventories and projected production growth support investment in efficient, large-scale producers, especially in the Permian.
-
Risks: Low oil and gas prices pressure smaller operators, with rig cuts signaling caution. Geopolitical risks and tariffs add uncertainty.
-
Opportunities: Anticipated gas price increases in 2025 could revive drilling, benefiting gas-heavy portfolios if storage levels normalize.
Conclusion
The U.S. rig count’s decline to 547 reflects a cautious industry prioritizing financial discipline, yet strong production and inventory trends show oil and gas are far from out. Investors should focus on resilient operators, monitor inventory levels, and watch for signs of gas price recovery. For detailed rig count data, access Baker Hughes’ weekly and monthly reports, and ENB’s evaluation of the trends.
Crude Oil, LNG, Jet Fuel price quote
ENB Top News
ENB
Energy Dashboard
ENB Podcast
ENB Substack