In the ever-volatile world of energy markets, U.S. oil and gas producers are demonstrating remarkable staying power amid oil prices hovering around $60 per barrel—a level that’s uncomfortably close to breakeven for many operations. Yet, as recent developments show, this resilience isn’t uniform across the board. It’s all about location: basins with lower costs, higher productivity, and proximity to demand centers are thriving, while others face headwinds from inflation, regulatory hurdles, and market dynamics. Drawing on industry insights, including updates from major players like ExxonMobil and ConocoPhillips, as well as federal data on production trends and costs, this article explores how U.S. drilling programs are holding firm—but only in the right spots.
Shale’s Defiance in the Face of Low Prices
U.S. shale operators are pushing forward with production plans despite crude prices that might have triggered cutbacks in years past. In the Permian Basin, the epicenter of American oil growth, companies are achieving small but steady output increases, setting the stage for a record supply glut in 2026.
For instance, Exxon Mobil recently boosted its 2025 production guidance by 100,000 barrels of oil equivalent per day, reinforcing its dominance in the region where it operates as the largest player.
Other firms like Diamondback Energy, Coterra Energy, and Ovintiv have similarly announced modest raises in output for this year or next, betting on efficiency gains to weather the storm.
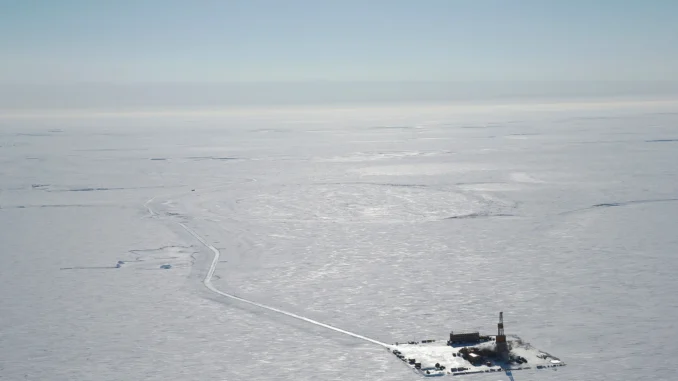
This persistence stems from technological advancements and operational tweaks that have lowered breakeven thresholds in prime areas. However, not all projects are sailing smoothly. In Alaska’s North Slope, ConocoPhillips has hiked the cost estimate for its Willow oil and gas project to as much as $9 billion, up from an initial $7 billion to $7.5 billion, blaming inflation and rising expenses.
Despite the overrun, the company is pressing on, with oil production slated to kick off in early 2029.
Willow highlights the challenges in remote or high-cost locations, where inflation bites harder and timelines stretch longer, contrasting sharply with the nimble shale plays in the Lower 48.
Production Trends: A Tale of Basins Over the Years
To understand this location-driven resilience, let’s examine U.S. oil and gas production over the last several years, broken down by key basins. Data from the U.S. Energy Information Administration (EIA) reveals explosive growth in the Permian, while other regions have plateaued or grown more modestly. Total U.S. crude oil production dipped to about 11.3 million barrels per day (bpd) in 2020 amid the pandemic but rebounded to a record 13.6 million bpd by July 2025, with forecasts pointing to 13.7 million bpd on average in 2025.
The Permian Basin has been the star performer, accounting for nearly all recent U.S. oil growth. Ten counties in the Permian drove 93% of the nation’s oil production increase since 2020, averaging 4.8 million bpd in 2024—or 37% of the U.S. total.
Production there is expected to climb from around 6.3 million bpd in 2024 to 6.6 million bpd in 2025.
In contrast, the Bakken and Eagle Ford basins have held steady, with outputs around 1.3 million bpd and 1.1 million bpd, respectively, in mid-2024, showing little net growth since 2020.
Here’s a snapshot of annual average crude oil production by major basin (in thousand bpd):
|
Basin/Region
|
2020
|
2021
|
2022
|
2023
|
2024 (est.)
|
2025 (forecast)
|
|---|---|---|---|---|---|---|
|
Permian
|
4,300
|
4,800
|
5,300
|
5,800
|
6,300
|
6,600
|
|
Bakken
|
1,100
|
1,100
|
1,200
|
1,200
|
1,300
|
1,300
|
|
Eagle Ford
|
1,100
|
1,100
|
1,100
|
1,100
|
1,100
|
1,100
|
|
Anadarko
|
400
|
400
|
400
|
400
|
400
|
400
|
|
Niobrara
|
600
|
600
|
700
|
700
|
700
|
700
|
|
Total U.S.
|
11,300
|
11,200
|
11,900
|
12,900
|
13,300
|
13,700
|
(Data approximated from EIA reports and forecasts; actuals may vary slightly based on final revisions.)
Natural gas tells a similar story, with U.S. dry production hitting 109.1 billion cubic feet per day (Bcf/d) in August 2025, up 5.9% year-over-year.
The Appalachia Basin leads at around 36 Bcf/d, followed by the Permian at 25 Bcf/d in 2024, projected to reach 25.5 Bcf/d in 2025.
The East region (dominated by Appalachia) has surged from 33.9 Bcf/d in 2025 to a forecasted 53.8 Bcf/d by 2050, while the Permian contributes associated gas from oil wells.
Costs and Breakevens: Why Location Dictates Strategy
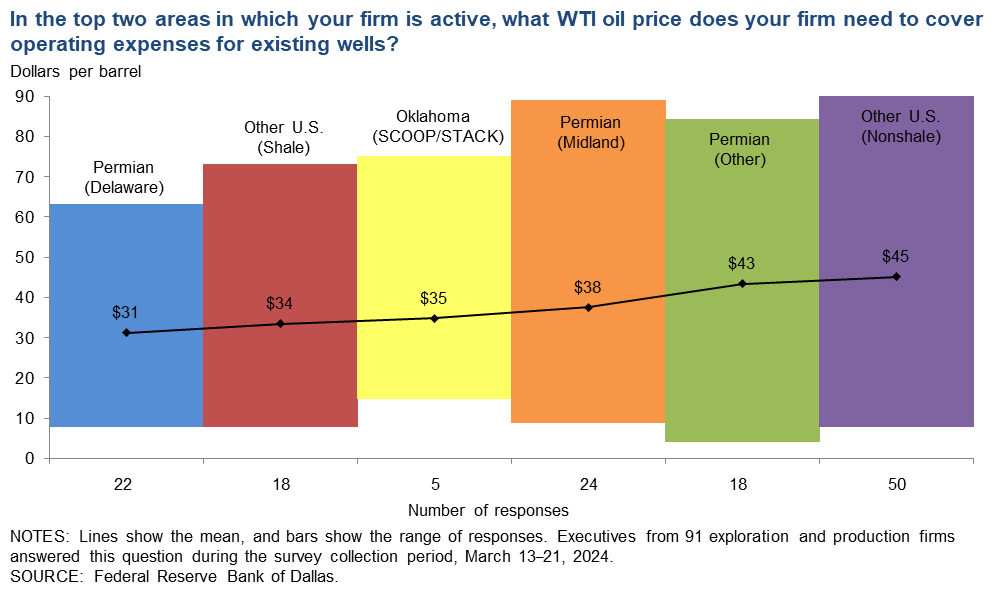
The Dallas Federal Reserve’s Energy Survey underscores how costs vary dramatically by location, influencing where companies deploy capital. In the latest September 2025 survey, breakeven prices for new wells in the Permian Basin averaged $61 per barrel in the Midland sub-basin and $63 in the Delaware, while other Permian areas hit $70.

Outside the Permian, costs climb higher, with other U.S. shale plays averaging $66-70 per barrel.
Overall, breakevens ranged from $61 to $70 across surveyed firms, with regulatory changes since January 2025 slightly reducing costs in some areas.
These variances explain why oil companies are zeroing in on sweet spots like the Permian to maximize returns to investors. With shareholder pressure for dividends and buybacks at an all-time high, operators are prioritizing high-return locations over sheer volume growth. In higher-cost basins like Alaska’s Willow or even parts of the Bakken, projects must clear steeper hurdles, often leading to delays or scaled-back ambitions.
Natural Gas Demand: A Lifeline for Drilling Crews
Amid oil’s challenges, surging natural gas demand offers a buffer, particularly in gas-rich basins. U.S. natural gas consumption is poised to hit a record 91.4 Bcf/d in 2025, up 1% from prior years, driven by electricity generation, LNG exports, and emerging needs from data centers and AI infrastructure.
Global LNG demand is forecasted to rise 60% by 2040, much of it fueled by Asian growth, keeping U.S. export facilities humming.
This could sustain drilling activity in areas like the Haynesville and Appalachia, where gas is the primary target, even if oil prices lag.In the Permian, associated gas from oil wells adds to the supply, but dedicated gas drilling may ramp up in response to demand. Overall, natural gas production is up 4.4% year-to-date in 2025, hitting 107.3 Bcf/d, with new records in key basins.
This trend ensures that drilling crews in favorable locations stay busy, bolstering the industry’s resilience.
Location, Location, Location: The Path Forward
U.S. drilling programs are proving tougher than expected, defying $60 oil through innovation and focus. But success hinges on geography—low-cost, high-productivity basins like the Permian are the clear winners, delivering investor returns while higher-cost or remote areas like Alaska grapple with inflation and delays. With natural gas demand providing an extra boost, the industry is poised for continued output growth, albeit selectively. As operators chase the best returns, the mantra remains: location, location, location.
At Sandstone Asset Capital Management, we look at each drilling opportunity as one part of the entire portfolio. The advantage of investing as close to the well head as possible allows for greater returns and greater risk. As always, ask your CPA if oil and gas is right for your portfolio. If you need a tax deduction with cash flow, it is a good idea to look before the end of the year.


Be the first to comment