

In the midst of escalating tensions in the Middle East, with U.S. and Israeli strikes on Iran and retaliatory actions disrupting global energy flows, the question looms large: Are we truly in the throes of an oil crisis? As of March 15, 2026, the Strait of Hormuz—a vital chokepoint carrying roughly 20% of the world\’s seaborne oil—remains partially operational for select shipments, particularly Iranian crude headed to Asia. Kharg Island, Iran\’s primary oil export hub handling up to 90% of its shipments, was targeted by U.S. forces but with oil infrastructure deliberately spared, allowing exports to continue at near-normal levels.
Yet, tanker rates have skyrocketed, refined product prices are climbing, and markets are jittery. For the Energy News Beat audience, let\’s break this down: the U.S. is minimally exposed, global disruptions are real but uneven, and the divide between \”paper\” oil trading and physical deliveries tells a nuanced story.
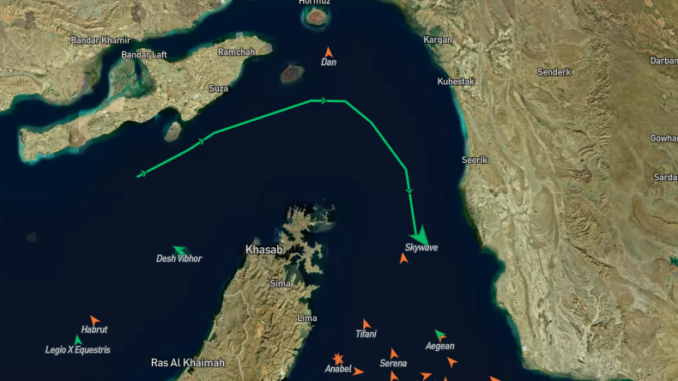
An Indian owned VLCC, OFAC-sanctioned, sailed through Hormuz on 11 March with 2m barrels of Iranian crude and her AIS on… She wanted to be noticed. 👋🏻
She loaded her cargo at Kharg Island on 4 March. The vessel is SKYWAVE (IMO # 9328716, formerly “Blue Gulf”, built in 2005). pic.twitter.com/F9KarQlm2L
— Ed Finley–Richardson (@ed_fin) March 15, 2026
The Strait of Hormuz
The Regime is losing the capability to threaten the Strait every hour. pic.twitter.com/UsuJod2Lwq
— Michael P Pregent (@MPPregent) March 15, 2026
U.S. Exposure: A Mere 2% at Risk, Mostly Headed to California
The United States has significantly reduced its reliance on Persian Gulf oil over the past decade, thanks to booming domestic production from shale plays like the Permian Basin. In 2025, imports from the region accounted for just about 8% of total U.S. crude imports, or roughly 490,000 barrels per day (bpd)—far below historical highs.
Even narrower, only around 2% of U.S. oil imports pass through the Strait of Hormuz, with much of that volume destined for California refineries that favor heavier Middle Eastern crudes.This low dependency means the U.S. isn\’t facing immediate shortages from the strait\’s restrictions, which have slashed throughput from 20 million bpd to a trickle for most vessels, allowing only Iranian-linked and select Asian ships to pass.
President Trump\’s calls for allies like China, Japan, and South Korea to deploy warships underscore that the burden falls heavier on import-dependent nations in Asia and Europe.
For America, strategic petroleum reserves and increased output from non-OPEC sources provide a buffer, keeping pump prices elevated but not in freefall—up about 19% since the conflict began.
Global Flows: Tankers Still Loading, But Not for Everyone
Despite Iran\’s threats and the strait\’s \”restricted\” status since March 1, 2026, oil is still moving—selectively. Iranian exports via Kharg Island continue at 1.1-1.5 million bpd, similar to last year\’s averages, with tankers loading non-stop and shipments heading to buyers like China, India, and Turkey.
Satellite imagery confirms activity at the island, even after U.S. strikes obliterated military targets but preserved export facilities.
Meanwhile, Saudi Arabia is pivoting hard to its Red Sea ports, ramping up exports via the Yanbu terminal to a record 2.5-5 million bpd using the east-west Petroline pipeline.
This bypasses the strait entirely, though at a cost: Saudi production has dipped to 8 million bpd after shutting offshore fields, trimming heavier blends.
Overall, the effective loss isn\’t the full 20% of global oil; it\’s closer to 10-15 million bpd disrupted, with Gulf producers slashing output by 10 million bpd as storage fills and alternatives prove limited.
Oil to India, China, and other non-Western buyers keeps flowing, softening the blow for those economies.
Refined Products Feel the Pinch: Gas, Diesel, and Jet Fuel Under Pressure
While crude itself isn\’t in total lockdown, the ripple effects on refined products are more pronounced. Supply chain disruptions—fewer tankers willing to risk the strait, port congestion, and halted flows—have quadrupled charter rates to $800,000 per day.
War-risk insurance cancellations and surging premiums add to the chaos, pushing very large crude carrier (VLCC) rates to record highs of $424,000 per day for Middle East-to-China routes.
This hits gas, diesel, and jet fuel hardest. European natural gas futures jumped 40%, and U.S. gasoline prices have risen amid fears of prolonged chokepoints.
Jet fuel cracks (the premium over crude) are widening due to vulnerabilities in Persian Gulf supplies, with aviation facing higher costs from rerouting and shortages.
Diesel surcharges in the UK have spiked 8-15%, reflecting broader transport inflation.
These aren\’t full-blown shortages yet, but they\’re inflating costs across supply lines, from farms to factories.
Paper vs. Physical: Futures Volatility vs. Real-World Deliveries
Here\’s where the market\’s schizophrenia shines: \”Paper\” oil (futures contracts) often diverges from physical deliveries. Futures are speculative bets on future prices, trading volumes 28 times daily global consumption, reacting wildly to headlines—like Brent surging to $120 amid strait fears.
They incorporate risk premiums, expectations, and financial flows, sometimes inflating prices beyond current realities.
Physical markets, by contrast, focus on actual barrels: supply, demand, logistics, and contracts. Spot prices reflect immediate availability, quality, and regional factors, often lagging futures due to storage or delivery delays.
Right now, physical crude is tighter in some spots (e.g., Asia\’s demand for Middle East sour grades) but not universally scarce, as Iranian flows persist and Saudis redirect. Tanker delivery prices, however, are soaring due to real-world risks—rerouting via the Cape of Good Hope adds time and cost, widening the gap.
Futures might scream \”crisis,\” but physical trades suggest a managed disruption—for now.
To make the contrast clearer, here\’s a side-by-side comparison:
|
Aspect
|
Paper Oil (Futures/Derivatives)
|
Physical Oil (Spot/Deliveries)
|
|---|---|---|
|
Primary Focus
|
Financial speculation and hedging
|
Actual production, transport, and consumption
|
|
Trading Volume
|
Extremely high (e.g., billions of barrels equivalent traded daily)
|
Matches global demand (~100 million bpd)
|
|
Price Drivers
|
News, sentiment, economic indicators, algorithmic trading
|
Supply disruptions, inventory levels, freight costs, regional imbalances
|
|
Settlement
|
Mostly cash; rarely physical delivery (less than 1% of futures go to delivery)
|
Actual barrels exchanged via tankers, pipelines, or storage
|
|
Volatility
|
High; can spike or crash on rumors
|
Moderate; changes based on tangible events like outages
|
|
Participants
|
Investors, speculators, banks
|
Producers, refiners, traders, governments
|
|
Impact on Consumers
|
Indirect; influences benchmark prices that filter down to retail
|
Direct; affects gasoline, diesel, and jet fuel prices at the source
|
|
Example
|
Buying WTI futures on NYMEX expecting a price rise from Middle East tensions
|
A refinery in India chartering a tanker to load Iranian crude from Kharg Island
|
How They Interact and Why They Diverge
Paper and physical markets aren\’t isolated—they feed into each other. Futures prices set benchmarks (e.g., Brent as a global reference), which physical deals often reference with premiums or discounts. Hedging is a big link: Airlines might buy paper futures to lock in jet fuel costs against physical price hikes.
Divergences happen because:Contango vs. Backwardation: In contango (common in oversupply), future prices are higher than spot, encouraging storage. Backwardation (tight supply) flips this, drawing down inventories.
Speculative Bubbles: Paper markets can overreact—e.g., negative WTI prices in 2020 due to storage fears, while physical oil still had value.
Geopolitical vs. Operational Realities: As in recent Strait of Hormuz tensions, paper prices surge on \”what if\” scenarios, but if tankers keep loading (as they have for select routes), physical disruptions are limited, keeping effective losses below the headline 20% of global flows.
In essence, paper oil is about predicting and profiting from the future, while physical oil is about delivering the present. For energy professionals like podcast hosts discussing market dynamics, recognizing this split helps explain why a \”crisis\” in futures doesn\’t always mean empty gas stations. If tensions escalate further, watch how physical constraints (like tanker rates hitting $400k+ per day) could pull paper prices into alignment—or widen the gap.
Are We in a Crisis? Not Yet, But Teetering on the Edge
With the Strait shipping selective oil, Kharg Island pumping, and alternatives like Saudi Red Sea exports kicking in, we\’re not in a 1970s-style embargo. The effective market loss is smaller than the headline 20%, and U.S. insulation keeps domestic impacts contained. But escalating strikes, potential infrastructure hits, and sustained tanker premiums could tip us over. Gas and diesel prices are already biting consumers, and jet fuel hikes threaten airlines and logistics.
For energy stakeholders, monitor Kharg\’s status, strait transits, and Saudi pipeline flows closely. If Iran escalates or allies waver, paper panic could become physical pain. Until then, this is a crisis in slow motion—disruptive, yes, but not apocalyptic. Stay tuned to Energy News Beat for updates as the situation evolves.
Sources: iata.org, oilprice.com, iata.org, houstonpublicmedia.org, nytimes.com, hormuzstraitmonitor.com
Get your CEO on the #1 Energy Podcast in the United States: https://sandstoneassetmgmt.com/media/
Is oil and gas right for your portfolio? http://energynewsbeat.co/invest/