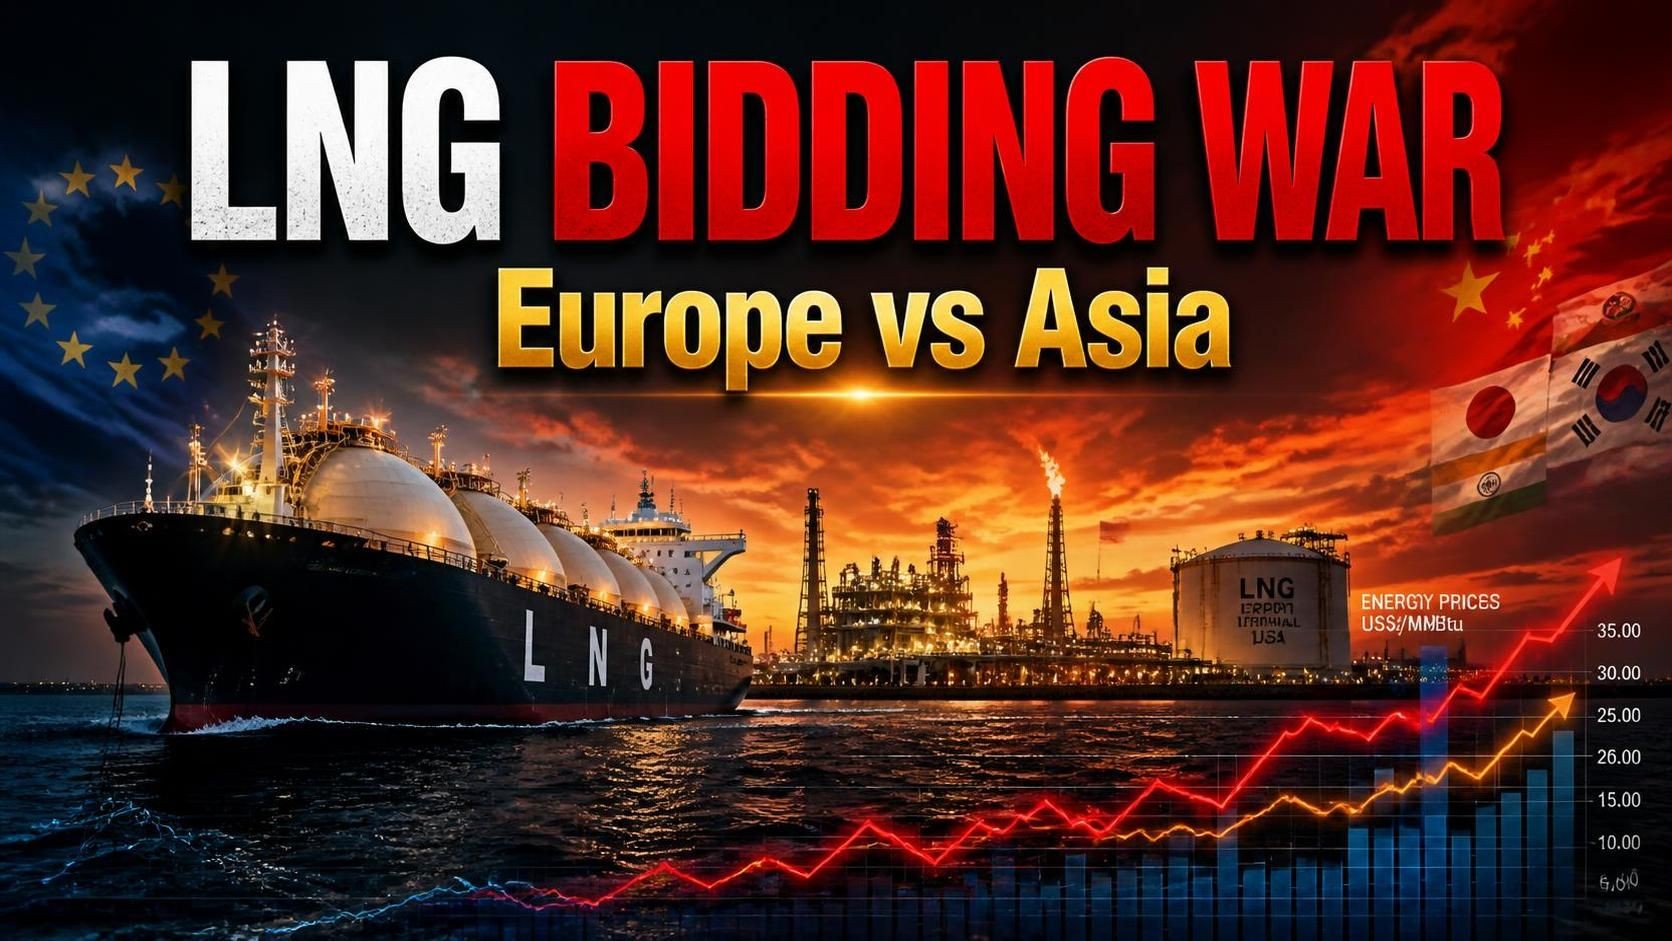
The global liquefied natural gas (LNG) market is locked in an intensifying bidding contest between Asia and Europe, driven by severe disruptions to Qatari supplies through the Strait of Hormuz amid the US-Iran conflict that began in late February 2026. Spot prices have more than doubled—surging roughly 150% from pre-conflict levels near $10.40 per million British thermal units (mmBtu) to highs around $26–30+ per mmBtu by mid-to-late October 2026, with recent tanker strikes pushing Asian benchmarks even higher. This is elevating wholesale and consumer energy costs on both continents while the United States ramps up LNG export capacity to help fill the gap.
The Asia-Europe Bidding War
Qatar, which previously supplied nearly 20% of global LNG (vying with Australia as the second-largest exporter behind the US), has seen exports crater due to the conflict and restricted shipping in the Strait of Hormuz. Shipments dropped dramatically from an average of about 6.51 million tons in the months before the war to minimal volumes in some periods (e.g., as low as one cargo in August in some tracking data). This has tightened the market and driven spot prices for North Asia deliveries (Platts JKM benchmark) to multi-year highs—around $26/mmBtu in mid-September, climbing toward or past $30/mmBtu by late October amid renewed shipping risks, including attacks on LNG carriers near Yemen and the Red Sea/Hormuz area. These are the highest levels since December 2022.WorldenergynewsBloomberg
Asia, the largest LNG importing region, has responded with demand destruction in price-sensitive markets. Kpler data showed September 2026 Asian imports at an estimated 20.09 million tons—the lowest for the month in eight years (since 2018)—down from 22.27 million tons a year earlier and 22.25 million in August. China cut arrivals sharply (to about 4.32 million tons in September), and India and other South Asian buyers showed restraint. This has freed cargoes for Europe.ReutersOilprice
Europe, facing winter with critically low storage, has stepped up purchases. EU underground gas storage stood at roughly 72–75% full in early-to-mid October 2026 (around 74 bcm or lower in some readings), the lowest for the date since records began in 2011 and well below the prior year (~82–83%) and five-year average (~89%). Germany was notably light at around 60%. Kpler estimated European LNG imports rising to 7.98 million tons in September (highest since May) and further to 10.53–10.62 million tons in October–November. Europe is effectively outbidding or matching Asia in a tight market, paying significant premiums, while some Asian buyers (including in India, Pakistan, and Bangladesh) continue selective spot purchases at $25+/mmBtu—a shift from their behavior in the 2022 crisis.FTNew.intellinewsWorldports
Analysts describe competition as “inevitable.” Asian spot prices have at times carried a premium that can divert flexible Atlantic cargoes eastward, but Europe’s storage imperative and willingness to pay keep the contest alive. Russian LNG has also played a role in Europe (with elevated volumes earlier in 2026 ahead of further restrictions), while flexible US and other non-Gulf supplies are the swing volumes.FT
Impacts on Asian Energy Markets
High prices are suppressing demand and forcing fuel switching. Analysts project Asian LNG demand to fall 3–10% in 2026 from 2025 levels for a second consecutive year, with China seeing substantial declines. Price-sensitive buyers in China and South Asia are reducing spot purchases, delaying stocking, and turning to cheaper alternatives. Coal is roughly 80% cheaper than LNG on an energy-equivalent basis in some assessments, supporting a rise in global coal demand as Asian importers (and some in Europe) switch for power generation. Emerging Asia’s planned gas-for-power projects are at risk from high prices, renewables growth, and supply chain issues.ReutersOilpriceReuters
The costs are flowing through to consumers. Japan’s average power prices jumped more than 25% week-to-week in mid-October amid soaring LNG and coal costs, reaching levels where gas-fired generation is the most expensive in years. The country and others have increased coal burn. IEA data showed average spot electricity prices in Japan (and the EU) rose over 30% year-on-year in Q2 2026. Broader inflation pressures from energy import bills are evident across Asia, affecting household costs, industry, and even food-related items in some markets. South Korea and others have signaled greater reliance on coal and nuclear for winter.OilpriceX
Impacts on European Energy Markets
Europe has little choice but to compete for expensive LNG to replenish low inventories ahead of winter, with limited coal options due to decarbonization policies. Dutch TTF prices have traded in the high €70s to near €90/MWh range recently (roughly equivalent to high $20s/mmBtu), elevated well above pre-conflict levels and contributing to higher wholesale electricity prices. Gas often sets the marginal power price in many markets, transmitting LNG cost spikes into electricity.Capital
Consumer impacts include rising bills and inflation. Wholesale electricity price increases linked to the LNG shock are estimated to potentially add up to €80–120 annually to household electricity bills in exposed countries (higher where gas dominates price formation, such as Italy, Ireland, and the UK). Residential gas and electricity prices have already risen in many capital cities since early 2026, with further pass-through expected as contracts renew. Energy is a key driver of headline inflation. Low starting storage raises risks of sharper winter draws, potential demand cuts (IEEFA has warned of scenarios requiring ~7% lower winter gas demand or costly extra imports), and a difficult refill next summer that could keep prices elevated into 2027. ENTSOG and EU authorities note the system retains flexibility via higher LNG imports and interconnectivity, but margins are thinner than in prior years, and a severe cold snap or further disruptions could create shortfalls.WorldportsIeefaEnergy.europa
US LNG Export Expansion Filling the Gap
The United States, already the world’s largest LNG exporter, is expanding capacity rapidly and benefiting from the tight global market. US LNG exports averaged 17.4 Bcf/d in the first half of 2026, up 23% from the same period in 2025—the fastest growth since large-scale exports began in 2016. This was driven by new and ramping capacity, with high global prices incentivizing near-maximum utilization. Shipments to Asia roughly doubled in H1 as buyers sought alternatives to Gulf supplies. EIA forecasts continued strength into 2027.Eia
Key capacity additions include:
- Plaquemines LNG (Venture Global) exporting at full capacity.
- Corpus Christi Stage 3 (Cheniere) ramping, with most trains online; combined with Plaquemines, these add about 4.0 Bcf/d nominal when complete.
- Golden Pass LNG (ExxonMobil/QatarEnergy) began exports in April 2026 from Train 1, with further trains expected through late 2026, adding roughly 0.7 Bcf/d initially.
Additional projects under construction or recently FID’d include CP2 (Phases), Louisiana LNG, Rio Grande LNG (multiple trains), Port Arthur, Commonwealth LNG, Delfin FLNG, and others. IEA tracking shows more than 330 bcm/yr of new global LNG export capacity expected online 2025–2030 from projects under construction as of 2025, with a large share from the US. North American exporters are on track to roughly double capacity by the late 2020s (from earlier baselines toward ~28+ Bcf/d regionally). Operational US capacity already exceeds 20 Bcf/d, with over 38 Bcf/d in various stages of operation and construction. Recent FIDs in 2026 (e.g., CP2 Phase 2, Commonwealth, Delfin) continue the wave. Europe is sourcing a growing majority of its LNG from the US, deepening dependence even as prices remain elevated.IeaWorldenergynews
This US supply response is critical for rebalancing the market, though new volumes take time to fully come online, and feedgas supply and infrastructure must keep pace. High prices support continued investment, but a future supply glut remains possible once the current shock eases and the broader capacity wave arrives later this decade.
Outlook
The bidding war is a direct consequence of the Hormuz supply shock coinciding with Europe’s low storage heading into winter and Asia’s residual demand (even if curtailed). Prices could climb further (analysts have flagged risks toward $35/mmBtu or higher under prolonged disruption or cold weather) before new US and other supply, demand destruction, and potential Hormuz normalization ease pressure. Consumer energy costs—electricity and gas bills—are rising or set to rise further in both regions via pass-through, contributing to inflation and affordability pressures, while accelerating coal use in Asia and renewables/efficiency measures where feasible. The US export expansion is the primary near-term offset, reinforcing its role as the flexible swing supplier in a volatile global market.
Check out the World’s Greatest Podcast Show Notes at EnergyNewsBeat.co or EnergyNewsBeat.com. And subscribe to: The Energy News Beat Substack.
Appendix: Sources and Links
- Reuters / World Energy News (Clyde Russell commentary, Sept. 17, 2026): LNG spot price surge deters Asian buyers but saves Europe. https://www.reuters.com/commentary/reuters-open-interest/lng-spot-price-surge-deters-asian-buyers-saves-europe-2026-09-17/ (and related World Energy News coverage)
- Financial Times (Sept. 26, 2026): Europe braces for LNG tug of war with Asia. https://www.ft.com/content/474ced6c-b6ba-4d03-af41-bab5fbb6d7e9
- OilPrice.com (Irina Slav, Sept. 19, 2026): Europe Outbids Asia for LNG as Prices Surge 150%. https://oilprice.com/Energy/Natural-Gas/Europe-Outbids-Asia-for-LNG-as-Prices-Surge-150.html
- Bloomberg / related (Oct. 19–20, 2026): Asian LNG Prices Jump to Highest Since 2022 on Tanker Strikes. (Referenced via OilPrice and market reports; JKM ~$30+/mmBtu)
- U.S. Energy Information Administration (Sept. 1, 2026): U.S. LNG exports rose 23% in the first half of 2026 because of higher capacity. https://www.eia.gov/todayinenergy/detail.php?id=68064
- International Energy Agency: Global LNG Capacity Tracker (updated Oct. 2026) and Gas Market Report references. https://www.iea.org/data-and-statistics/data-tools/global-lng-capacity-tracker
- Gas Infrastructure Europe / AGSI data and related analyses (Oct. 2026): EU storage levels ~72–75%, lowest for date in years. Multiple trackers (e.g., StorageCurve, GasRadar, ENTSOG Winter Outlook).
- Reuters (Sept. 17, 2026): Asian LNG demand set to fall for second year as war shrinks supply. https://www.reuters.com/business/energy/asian-lng-demand-set-fall-second-year-war-shrinks-supply-2026-09-17/
- OilPrice.com and related (Oct. 2026): Coverage of coal demand rise amid LNG shortage; Japan electricity prices surge.
- IEEFA reports (2026): Europe storage shortfall risks, electricity bill impacts, US LNG reliance. https://ieefa.org/ (various trackers and analyses)
- Additional: World Energy News, Oxford Institute for Energy Studies Quarterly Gas Review, Kpler shipping/import data cited across reports, FERC/DOE LNG status updates, and market assessments from Spark Commodities, S&P Global, etc.
All figures are drawn from the cited reporting and data aggregators (Kpler, GIE/AGSI, EIA, IEA) as of mid-to-late October 2026. Markets remain highly sensitive to Hormuz shipping developments, weather, and project timelines.