That is the argument Javier Blas is making in his September 23 Bloomberg Opinion column, China Isn’t Buying More Oil, It’s Buying From Different Markets (also framed as “Don’t Believe the Hype About China’s Oil Buying”). The global market treated China’s pre-war appetite as a floor. In 2026 it became a valve.
The Blas thesis: restraint, not a new super-cycle
Blas has spent the Iran-war year arguing that five buffers kept oil from blowing through $100 in a lasting way: SPR releases, Gulf bypass pipelines, commercial stocks, clandestine Hormuz runs, and lower Chinese buying. The last one was the surprise. Other Asian importers replaced lost Strait of Hormuz barrels. China largely did not. It resold West African and Latin American cargoes it had already booked, cut runs, and let inventories do the work.
The market is now reading every uptick in Chinese fixtures as proof that the “missing” 4–5 million b/d is coming back. Blas’s counter: volume is not recovering to the 2025 run-rate in a clean way. Origins are changing. Freight is the new tax.
That distinction matters more than the headline “China is buying again.”Ten years of buying: the stockpile machine
China’s crude imports rose from about 7.6 million b/d in 2016 to a record 11.6 million b/d in 2025. The path was not a straight demand story. After the 2020–22 plateau, 2023–25 was stockpiling on cheap barrels. Rystad estimated China put 430,000 b/d into storage in 2025 — most of that year’s import increase. Onshore stocks were cited around 1.2 billion barrels heading into 2026, more than 100 days of net imports.
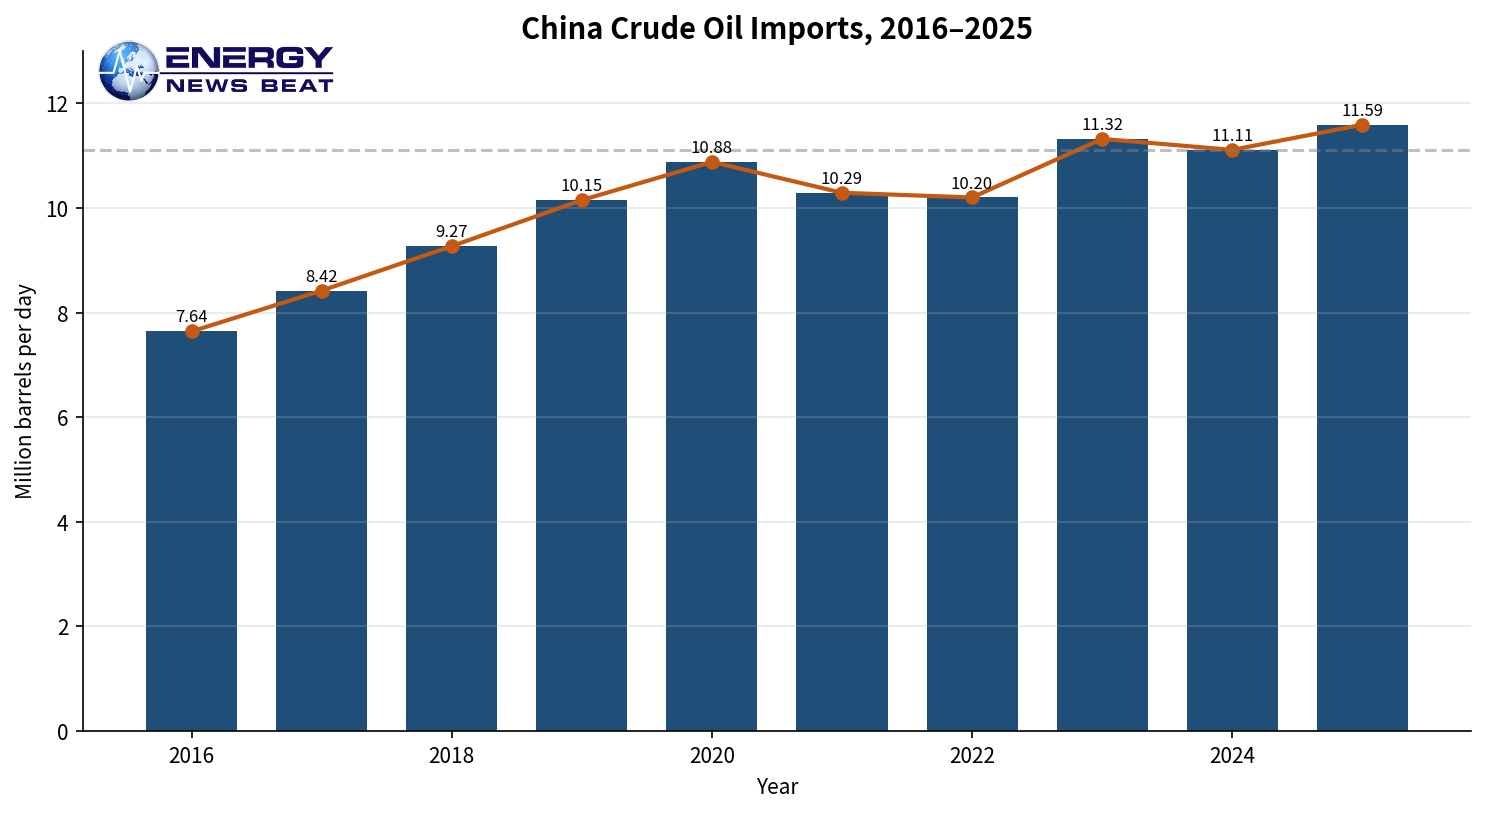
Customs tonnes (converted at ~20,000 b/d per million tonnes/year) tell the same story: 381 Mt in 2016, 542 Mt in 2020, 564 Mt in 2023, 553 Mt in 2024, 578 Mt in 2025. Domestic production stayed near 4.2–4.3 million b/d. Import dependence stayed above 70%. The surplus over refinery needs went into tanks.
That surplus is why China could cut seaborne arrivals by roughly 30–40% in Q2 2026 without an economic collapse. Q2 net imports fell about 3.5 million b/d year-on-year. More than half of the drop was the swing from stock-building to stock-drawing. Refinery throughput fell about 1.6 million b/d. Product-export curbs took another slice. May arrivals were cited as low as ~6.6 million b/d on tanker-tracker data — a decade-type low. June official-style figures sat near 7.8 million b/d. July recovered 22% month-on-month and was still 24% below July 2025.
Products: the export valve was slammed, then reopened
China flipped from product importer to structural exporter in the mid-2010s. Gasoline and diesel shipments then peaked and faded as EVs ate gasoline and Beijing tightened quotas.
Approximate customs exports:Gasoline: 9.7 Mt (2016) → peak ~16.4 Mt (2019) → 8.0 Mt (2025)
Diesel: 15.4 Mt (2016) → peak ~21.4 Mt (2019) → 6.7 Mt (2025)
Jet became the growth export as aviation recovered and refiners raised jet yields.
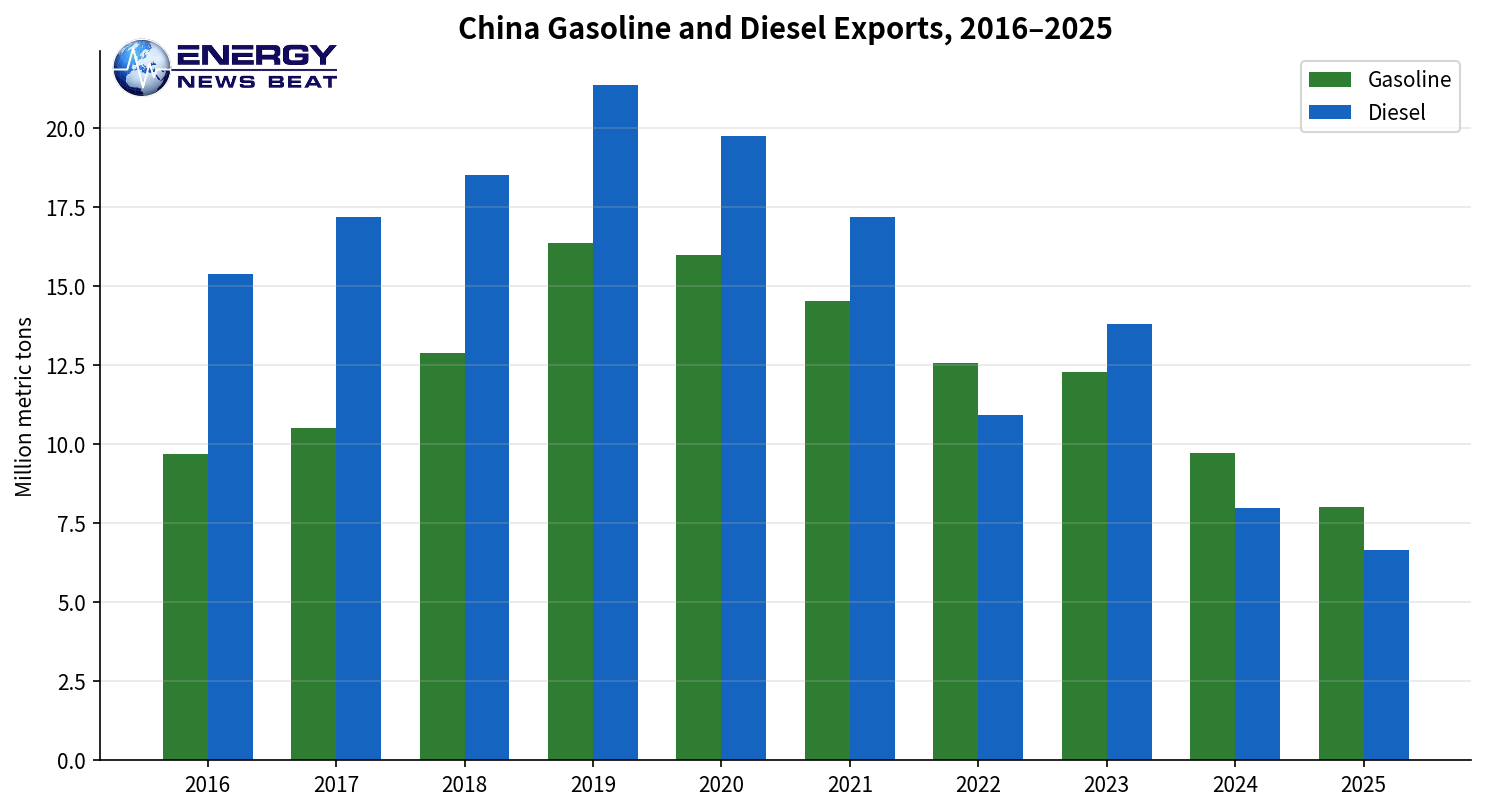
In March 2026, Beijing restricted clean-product exports to protect the domestic market. Q2 gasoline/diesel/jet exports fell on the order of 400–550 kb/d versus a year earlier. Quotas were later topped up (second-batch clean-product quotas brought 2026 allocations to ~32 Mt). By August, total refined-product exports hit 6.01 Mt, +12.7% year-on-year, with jet at a monthly record 2.55 Mt and diesel 1.33 Mt (highest since March 2024). January–August products were still −9.6% year-on-year. Gasoline YTD remained crushed (−57%). The pattern is policy-managed surplus, not an unconstrained export boom.
Refinery utilization: teapots broke first
- Pre-war overall utilization sat in the high 60s to low 80s depending on the sample (state majors much higher than Shandong independents). In the shock:April throughput ~13.3 million b/d, utilization cited near 64%
- May average utilization 66.3%, processed volumes −9.1% year-on-year
- Shandong teapots: 50.5% in June — lowest since 2017, worse than parts of 2020
- Goldman/Kpler-style tracking: utilization from ~70–72% pre-war to ~59% in late June/early July, back near 69% by early September, with runs still ~300 kb/d below pre-war
Teapots are the swing buyers of discounted Iranian, Russian, and Venezuelan barrels. When freight exploded and export windows closed, they cut first. State majors have more pipeline Russian crude, more working capital, and more quota politics. A full return to 2023-style runs needs both cheap landed crude and a product outlet. High freight plus weak gasoline demand (EV penetration now a structural fact) argues against that.
Tanker rates are the binding constraint
This is the piece the “China is restocking” narrative keeps underweighting.
VLCC MEG–China time-charter equivalent has printed around $1.2 million per day — versus a 2025 average in the tens of thousands and a long-run mean nearer $30,000. West Africa–China and US Gulf–China have also gone vertical, just less so. Freight that used to be $2/bbl is $15–22+/bbl on some Hormuz-linked routes. War-risk and longer waiting times make it worse. Some brokers put landed Middle East crude in China in the mid-$140s when you add freight and cover, even when paper Brent is closer to $100.
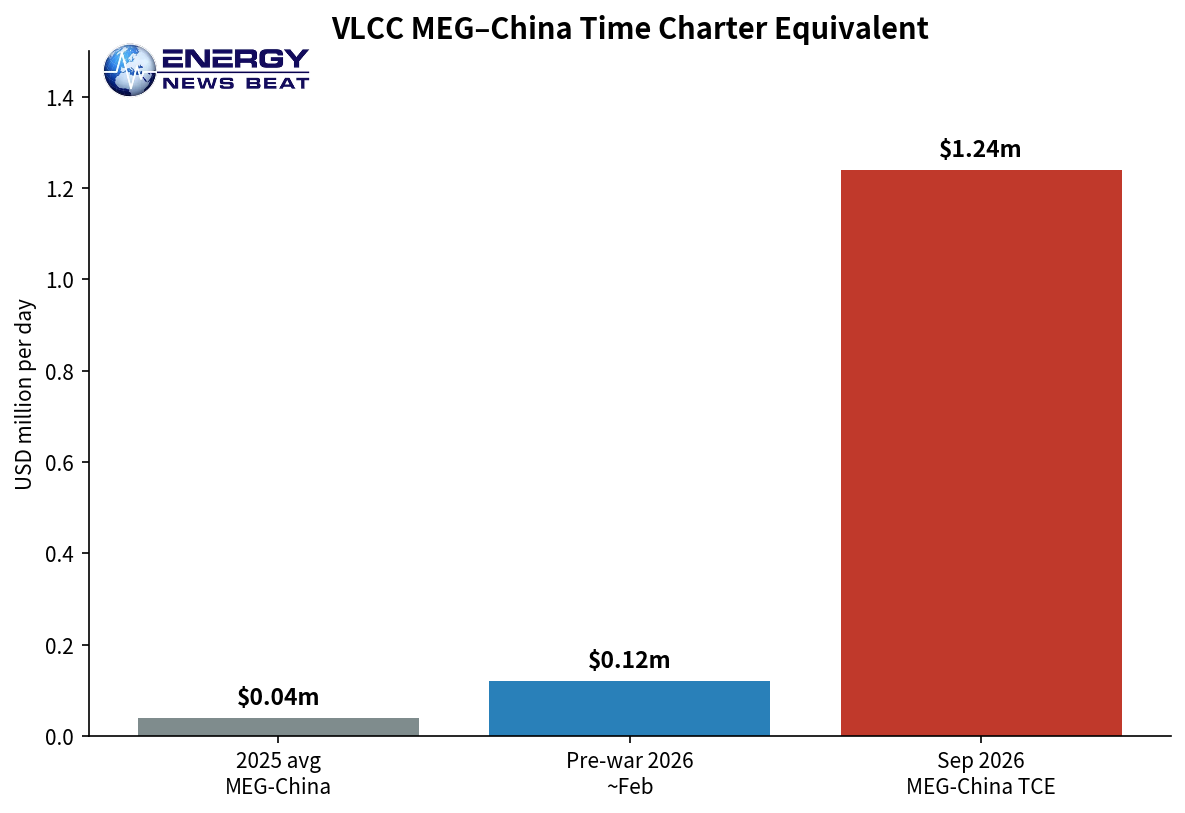
At those rates, restocking 800 kb/d–1 million b/d of strategic barrels is a different trade than it was in 2025. China will still lift discounted sanctioned crude and short-haul Russian barrels. It will not mindlessly recreate the 2025 “buy everything below $70 and fill every tank” cycle while a VLCC costs more per day than many tankers earned in a month two years ago.
That is why Blas emphasizes different markets: Atlantic Basin, Brazil, West Africa, Russian Pacific (ESPO/Sokol from Nakhodka and De Kastri), and whatever can avoid the worst Hormuz premium. Longer-haul MEG barrels have to clear a freight hurdle that did not exist in the last buying cycle.
Who China actually buys from
Official customs and tanker tracking have diverged for years. Iran and Venezuela barely exist on the GACC print. They show up as Malaysia, Indonesia, and “unknown.”2025 snapshot (official top five plus tracking estimates):Russia: still the anchor, ~2.1–2.2 million b/d in 2024, slightly lower in 2025 on paper, then the swing supplier again in summer 2026 (August Russian volumes were reported up 41% year-on-year as Saudi dropped)
- Saudi Arabia: faded from peak share as discounts elsewhere won
- Malaysia: ~1.3–1.4 million b/d — far above Malaysian output
- Iraq, Brazil (Brazil +28% in 2025)
- Iran via tracking: ~1.38 million b/d in 2025; sharply lower through Hormuz in mid-2026
- Venezuela via tracking: ~0.4 million b/d
- Sanctioned barrel estimate for 2025: at least 2.6 million b/d, >22% of imports
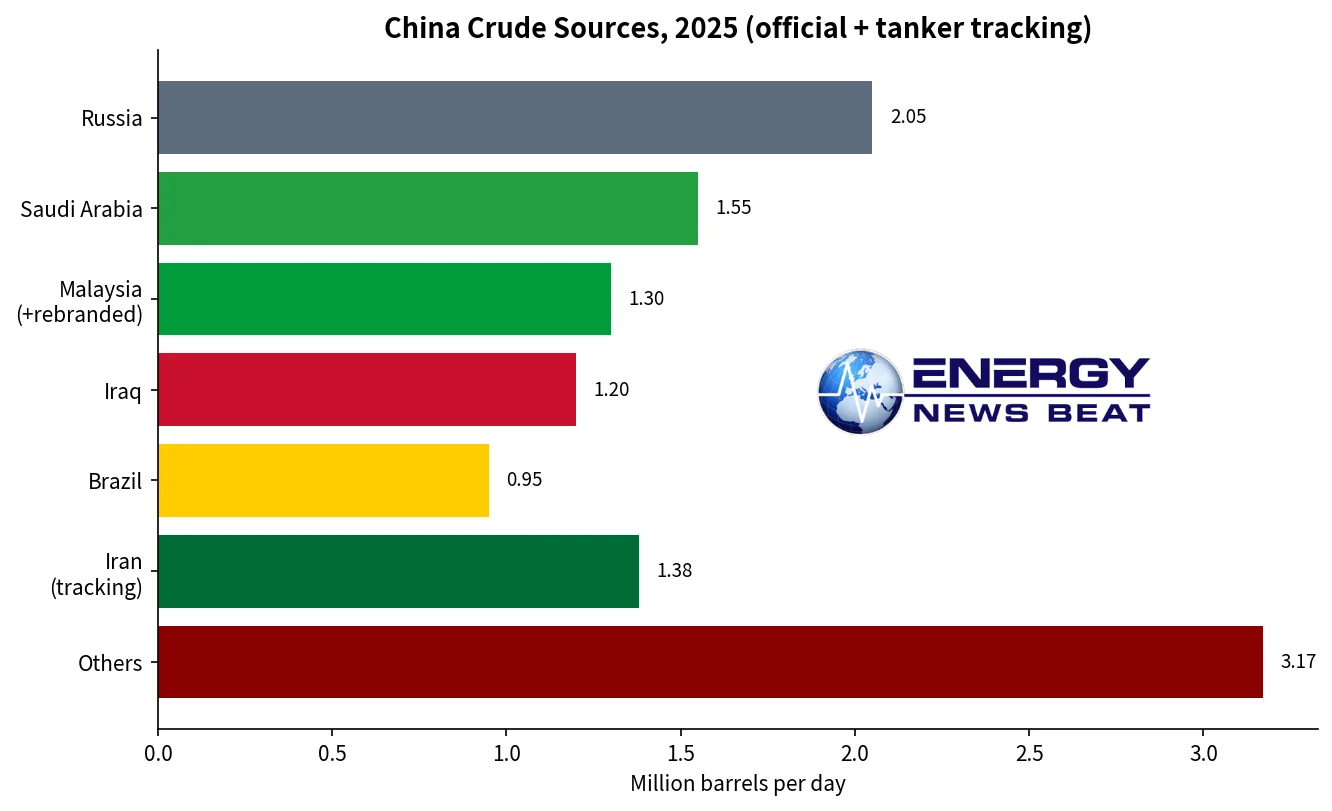
August 2026 customs-style tallies showed Russia as the only major supplier that grew, with Saudi almost halved month-on-month. Indonesia stayed elevated as another rebrand corridor. The slate is pivoting toward barrels that do not need a $1 million/day VLCC through a war zone.
What tighter Russian oil sanctions would do — and why the dark fleet keeps going
Russia is already under a price cap, tanker designations, and successive EU/UK/US packages. The shadow/dark/grey fleet still moves the majority of seaborne Russian crude in many months (often 50%+ on sanctioned or non-G7 ships). China and India remain the two sinks. Chinese and Russian managers are deep in the ownership/ISM web. ESPO pipeline crude to China never needed a VLCC. Pacific seaborne Russian grades are a shorter hop than Basrah.
Tighter sanctions on remaining Russian oil would:
- Widen the discount and push more volume onto older, poorly insured ships
- Increase STS transfers, AIS gaps, and flag hopping (Cameroon, Panama, Russia flag share has already jumped)
- Hurt teapot economics if Chinese banks get more secondary-sanctions fear — as seen when some NOCs stepped back from designated Russian majors
- Not stop the trade. The fleet that learned Iran and Venezuela will absorb another increment of Russia. Estimates of the global shadow universe run from several hundred designated hulls to
- 1,000–3,000 vessels depending on definition. It is already a parallel logistics system. More designations raise the cost of insurance and ports; they do not recreate 2021 compliance.
The dark fleet does not “keep going” costlessly. It keeps going because the buyer (China/India) and the seller (Russia/Iran/Venezuela) both want the discount more than they want access to London insurance and dollar clearing.
Did they quit the petrodollar?No. They built a bypass.
Russia–China energy trade is already mostly yuan and rubles (officials have claimed 90%+ of bilateral trade outside the dollar). Iranian barrels have been moving on yuan, barter, and CIPS for years. After February 2026, CIPS daily volumes jumped; some tallies put March activity well above $200 billion. Reports that Hormuz transit or “friendly” liftings would be settled in yuan or stablecoins are part of the same architecture. The yuan’s share of global trade finance has risen into the mid-single digits — second place at times, still a fraction of the dollar.
This is not the death of the petrodollar. It is a sanctioned-oil petroyuan corridor sitting beside the still-dominant dollar system that prices Brent, clears most Gulf official sales, and funds the tanker market’s “white” fleet. China has not stopped using dollars where they are convenient. It has stopped using them where they are a weapon.
How the market should trade this
Bullish oil if China restocks at 2025 rates while Hormuz stays impaired. That path is now freight-constrained. Every extra VLCC China fixes tightens rates further and raises the landed price of the next cargo.
Bearish crude / supportive products if China keeps runs modest, exports jet and diesel into a tight Atlantic/Asia product market, and only replaces barrels from Russia and the Atlantic. That is closer to the 2026 evidence: product exports recovered before crude imports fully did.
The tell is not a single monthly customs print.
- It is: MEG-China TCE staying above a few hundred thousand dollars a day
- Teapot utilization failing to recapture 70%+
- Official “Malaysia/Indonesia” barrels versus Kpler/Vortexa Iran estimates
- Whether inventory rebuild is 200 kb/d or 800 kb/d
China demonstrated it can drop 4–5 million b/d of imports and keep the lights on because it spent a decade filling tanks and electrifying the passenger fleet. That optionality is now a structural feature of the oil market. The hype is that the old buyer is back. The real story is a price-sensitive, freight-sensitive, sanctions-fluent buyer that will take cheap Russian and disguised Iranian barrels all day — and will not pay $20/bbl in freight to refill strategic tanks at the top of a war premium.
Making Appendices Great Again
Check out the World’s Greatest Podcast Show Notes at EnergyNewsBeat.co or EnergyNewsBeat.com.
Appendix: Sources and links
- China Isn’t Buying More Oil, It’s Buying From Different Markets / Don’t Believe the Hype About China’s Oil Buying, Sept. 23, 2026: https://www.bloomberg.com/opinion/articles/2026-09-23/china-isn-t-buying-more-oil-it-s-buying-from-different-markets
- Related Blas columns and X threads on May–July 2026 import collapse and Asia-ex-China recovery (Vortexa-based)
China imports, stocks, sources
- Columbia SIPA CGEP, “Where China Gets Its Oil” (2025 sources, sanctioned volumes, stockpiling): https://www.energypolicy.columbia.edu/where-china-gets-its-oil-crude-imports-in-2025-reveal-stockpiling-and-changing-fortunes-of-certain-suppliers-including-those-sanctioned/
- Columbia SIPA CGEP, “How China Is Managing Lower Oil Imports” (Q2 2026 drawdown math): https://www.energypolicy.columbia.edu/how-china-is-managing-lower-oil-imports/
- EIA, China 2024 imports and supplier mix: https://www.eia.gov/todayinenergy/detail.php?id=64544
- CNPC Economics & Technology Research Institute energy data handbook (customs tonnes 2000–2025)
- CEIC / OPEC annual China crude import series (~11.07 mb/d 2024; ~11.61 mb/d 2025)
Products and utilization
- Reuters, China’s August refined fuel exports, Sept. 18, 2026: https://www.reuters.com/business/energy/chinas-august-refined-fuel-exports-exceed-pre-iran-war-levels-jet-fuel-exports-2026-09-18/
- S&P Global, export quota and Jan–May 2026 product curbs
- OilPrice / Bloomberg / JLC reporting on Shandong teapot runs (~50.5% June 2026)
- CNPC handbook gasoline and diesel export tables (2016–2025)
Tankers
- Lloyd’s List, VLCC rates near records, Sept. 22–23, 2026
- Kpler, MEG–Asia freight and $1.2m/day TCE context
- Baltic Exchange TD3C / related route assessments as reported by trade press
Sanctions, shadow fleet, settlement
- KSE Institute Russian shadow fleet trackers (2026 monthly)
- CREA monthly Russian fossil-fuel export notes
- PISM, China and Iranian/Russian shadow fleets
- WSJ / Atlantic Council CIPS volume reporting; SWIFT trade-finance currency shares
- FDD and tanker-tracker work on Iran-to-China via Malaysia/Indonesia
Charts use China Customs / CNPC handbook tonnes converted at ~20,000 b/d per million tonnes per year; 2025 source bars combine official rankings with Kpler/CGEP tracking estimates for Iran. 2026 monthly figures remain subject to revision between GACC, Vortexa, and Kpler.