
Stu Turley, Energy News Beat Podcast Host, recently highlighted a long-standing debate over ethanol-blended gasoline. After filling up with 89-octane fuel containing up to 10% ethanol (E10) and driving 349 miles, the vehicle averaged 17.4 miles per gallon—well below its typical 22–24 mpg. Switching to ethanol-free gasoline restored performance to 22.3 mpg almost immediately. The roughly 4.9 mpg difference raises a broader question: What would the national impact be if the United States eliminated ethanol mandates and returned to pure gasoline?
Established data show a more modest efficiency penalty than this single trip. Ethanol contains about one-third less energy per gallon than gasoline (roughly 76,000 BTU/gal versus 114,000–116,000 BTU/gal for pure gasoline). The U.S. Energy Information Administration states that E10 typically reduces fuel economy by about 3% relative to ethanol-free gasoline. Independent tests and analyses commonly report a 2–4% reduction for E10.
Personal experiences can vary with driving conditions, vehicle calibration, load, temperature, or measurement methods, and the observed drop here exceeds the typical energy-density effect. Still, even a 3% improvement in efficiency, applied nationwide, compounds into meaningful savings when multiplied across America’s vast driving fleet.
Scale of American driving and potential fuel savings
Americans drive an enormous distance each year. Federal Highway Administration data show total vehicle-miles traveled (VMT) reached approximately 3.294 trillion in 2024 and continued rising into 2025 (around 3.32–3.34 trillion on a 12-month basis).
Finished motor gasoline consumption has hovered near 136–138 billion gallons annually in recent years (about 8.9 million barrels per day in 2025). Nearly all of it is E10 or similar, with roughly 14 billion gallons of fuel ethanol blended each year.
A consistent 3% efficiency gain from pure gasoline would reduce gallons needed for the same miles by about 3%. On 137 billion gallons, that equates to roughly 4.1 billion fewer gallons consumed annually. At a national average retail price around $3 per gallon, the direct “at the pump” fuel-volume savings would be on the order of $12 billion per year. Using the driver’s larger observed difference produces proportionally higher figures, but the energy-content physics and fleet data support the more conservative 3% range as the realistic baseline.
These savings assume pure gasoline is available at comparable prices and that vehicles are calibrated for it. In practice, ethanol also supplies octane, which refiners would otherwise produce at higher cost. Some analyses credit ethanol with lowering wholesale gasoline costs by tens of cents per gallon through cheap octane and added volume; others conclude the Renewable Fuel Standard (RFS) raises net costs via compliance mechanisms.
Energy used to produce ethanol
Producing a gallon of corn ethanol requires substantial energy inputs across farming, transport, milling, fermentation, distillation, and co-product drying. Lifecycle analyses (primarily fossil energy) typically show 0.4–0.5 gallons of gasoline-equivalent energy input per gallon of ethanol output, or roughly 30,000–50,000 BTU of fossil energy for ethanol’s ~76,000 BTU content. Modern plants and higher corn yields have improved the energy return on investment to roughly 2:1 or better on a fossil-energy basis according to USDA and related studies, though older or more critical analyses found near-break-even or negative balances depending on system boundaries and co-product credits.
Nationwide, with ~14–16 billion gallons of ethanol produced annually, the fossil energy invested runs into the hundreds of trillions of BTU each year—energy that would not be required (or would be redirected) in a pure-petroleum system.
Payments to corn farmers and related supports
Ethanol absorbs a large share of the U.S. corn crop—roughly 5.5 billion bushels in recent years (about one-third to 40% of production). In 2024, biorefineries purchased corn valued at approximately $23 billion.
The RFS creates guaranteed demand rather than a direct per-gallon payment to farmers, but it supports corn prices and farm income. Broader farm-bill programs (Price Loss Coverage, Agriculture Risk Coverage, crop insurance) deliver additional billions annually in corn-related support; corn has historically received a large share of commodity and insurance subsidies. Cumulative RFS-related transfers and price supports have run into the tens of billions over the life of the program.
Additional blending, distribution, and refinery costs
Ethanol must be produced (mostly in the Midwest), transported (often by rail or truck because it cannot easily move in petroleum pipelines), and splash-blended at terminals. Distribution costs range from about 11 cents per gallon in the Midwest to 20–30 cents or more on the coasts. Refineries also adjust for ethanol’s effects on vapor pressure and must manage the octane and volume contributions.
RFS compliance occurs through Renewable Identification Numbers (RINs). Analyses of RIN costs passed through to consumers estimate annual burdens in the range of $15–50+ billion in recent high-price periods (or cumulative hundreds of billions since the program’s expansion), though pass-through rates and net effects on pump prices remain debated. Some industry studies argue ethanol’s low cost and octane value more than offset these, saving drivers tens of billions yearly; others conclude the mandate raises net fuel expenditures.
Vehicle wear, repairs, and related costs
Ethanol is hygroscopic (attracts water) and can contribute to corrosion, elastomer degradation, and other issues in fuel systems, particularly in older vehicles, small engines (lawn equipment, boats, generators), and certain components not designed for it. Modern light-duty vehicles are generally compatible with E10, and large-scale durability studies have not shown systemic catastrophic failures at the 10% level for the current fleet. Higher blends (E15 and above) raise more compatibility questions for some older engines. Quantified national “extra repair bills” specifically attributable to E10 are not cleanly isolated in public data; impacts appear more pronounced for non-automotive equipment than for the average passenger car.
Any incremental maintenance costs exist alongside the efficiency penalty and should be weighed in a full accounting, but they are secondary to the volume and compliance effects for light-duty vehicles.
Aggregate savings potentialCombining a 3% efficiency gain (~$12 billion in reduced gallons), avoided RFS compliance and related costs (estimates vary widely from low tens of billions to higher figures depending on the study and RIN prices), and secondary factors such as distribution and any excess wear produces a plausible national range of tens of billions of dollars per year in lower effective fuel and related expenditures—if pure gasoline could be supplied at similar or only modestly higher per-gallon prices and without major octane or volume disruptions. Pro-ethanol analyses reverse the sign and claim large net savings from continued blending. The true net figure depends heavily on assumptions about replacement octane costs, market price responses, and how much ethanol would still be used voluntarily.
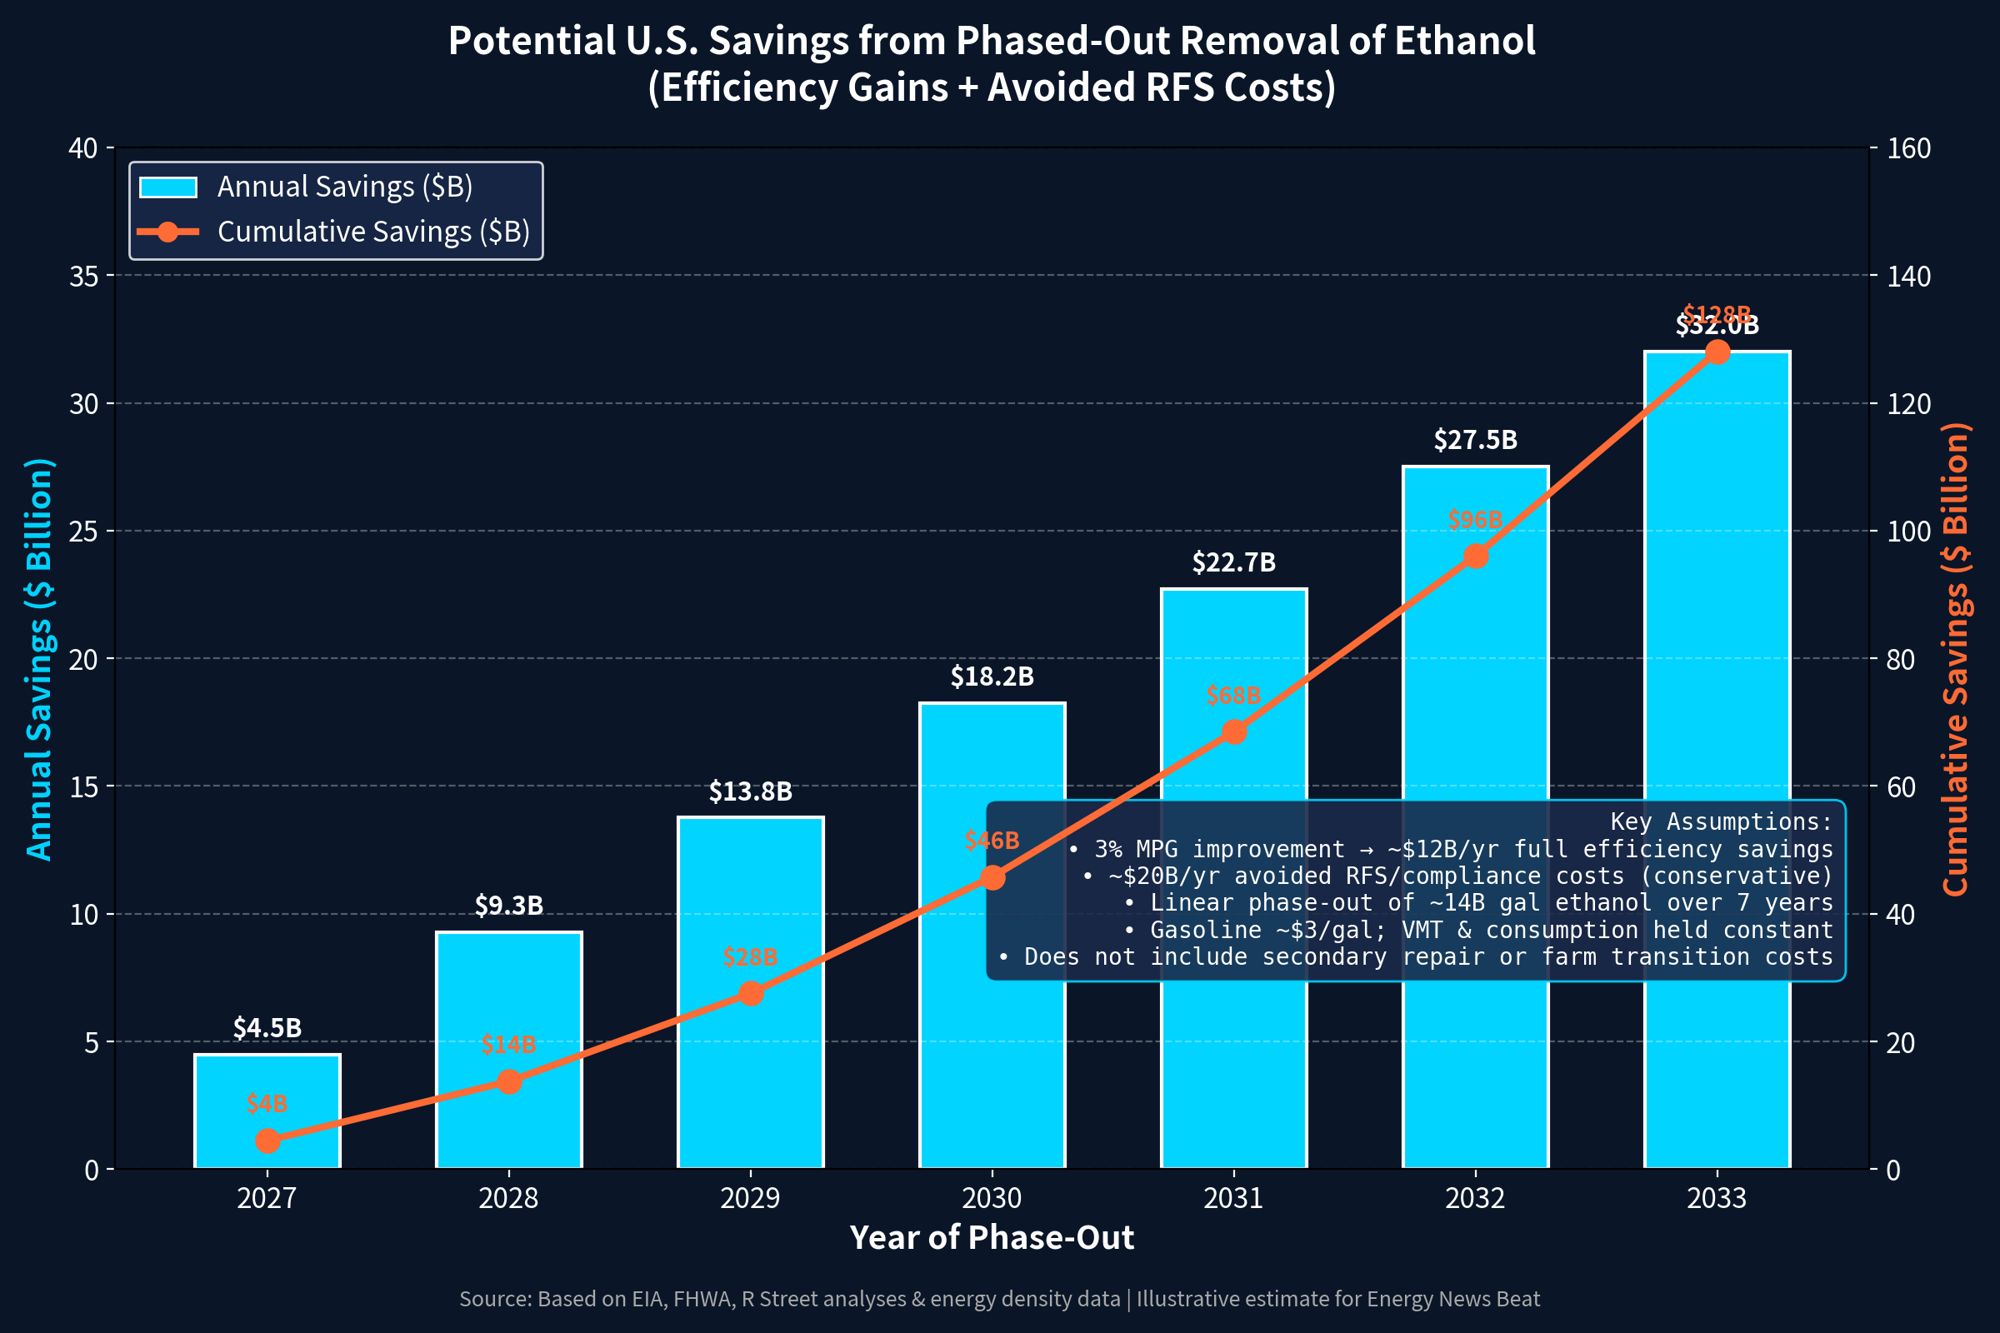
A multi-year plan to wean farmers off ethanol-related supports
Abrupt elimination of the RFS would disrupt Midwest farm economies that have structured operations around ethanol demand. A several-year wind-down could include:
- Gradual reduction of conventional (corn ethanol) volume obligations under the RFS—e.g., stepping down from the current ~15 billion gallon conventional target by 1–2 billion gallons per year over 5–8 years, aligned with projected declines in gasoline demand from efficiency gains and electrification.
- Temporary, declining transition payments or conservation-oriented incentives for corn acres shifting to other crops, cover crops, or non-food uses, funded by a portion of the fiscal savings from lower RFS costs.
- Expanded research, extension, and market-development support for alternative high-value crops, livestock feed diversification, and industrial uses of corn (beyond fuel).
- Infrastructure and workforce assistance in ethanol-dependent communities to attract other manufacturing or value-added agriculture.
- Clear statutory end-date for preferential biofuel tax credits (such as elements of the 45Z credit) tied to food-crop feedstocks, while preserving pathways for genuinely advanced, non-food biofuels if they meet performance criteria without mandates.
This approach would give farmers, ethanol plants, and rural communities time to adapt while restoring greater market discipline to the fuel supply. Policymakers would need to monitor corn prices, rural employment, and fuel markets and adjust the glide path accordingly.
Eliminating or substantially reforming the ethanol mandate would not be costless or instantaneous, and legitimate debates continue over energy security, rural economies, and the relative climate impacts of corn ethanol versus petroleum. The efficiency data, however, are clear: ethanol’s lower energy density imposes a measurable miles-per-gallon penalty. Scaling even a modest 3% improvement across trillions of vehicle-miles produces multi-billion-dollar annual effects at the pump—effects that drivers notice one fill-up at a time.
The $128 billion saved would not even include the average $ 3 to $ 4 thousand dollars per car in repairs that consumers have to pay due to ethanol.
So, with elections rolling in November, if President Trump wanted more money in people’s pockets and to save the environment, he would look at the suggested plans to wean the country off ethanol.
Primary sources and further reading
- EIA: Ethanol content and fuel-economy impact — https://www.eia.gov/tools/faqs/faq.php?id=27&t=10
- FHWA Highway Statistics (VMT and related) — https://www.fhwa.dot.gov/policyinformation/statistics/
- EIA gasoline and ethanol consumption data — https://www.eia.gov/energyexplained/gasoline/use-of-gasoline.php and Monthly Energy Review
- R Street Institute analysis of RFS consumer costs — https://www.rstreet.org/research/the-consumer-costs-and-climate-impacts-of-the-rfs/
- USDA/ERS and RFA data on corn use for ethanol
- EPA RFS regulatory impact analyses and volume rules
- Peer-reviewed and DOE/NREL studies on energy balance and vehicle durability
The numbers above use the most recent publicly available figures as of mid-2026 and standard engineering estimates; actual future savings would depend on oil prices, vehicle fleet composition, and policy details.