
For two decades, governments, corporations, and activists have poured trillions into wind, solar, batteries, and hydrogen as the path to a “clean” energy future. The result? According to U.S. Energy Secretary Chris Wright, the world has spent roughly $10 trillion—yet wind and solar deliver only about 3% of global primary energy consumption. And nobody is talking about the $89 Billion dollar liabilty that we have for land reclamation for wind farms in the United States. None of them is funded.
That’s not a rounding error. It’s a stark illustration of the Energy Transition Replacement Treadmill—an endless, resource-intensive cycle of build, subsidize, degrade, replace, and landfill that shows no signs of slowing. As highlighted in a recent analysis by Peter Clack (@PeterDClack on X), we aren’t simply adding new capacity; we’re committing to repeated, massive replacements of today’s infrastructure long before 2050 net-zero targets.
The $10 Trillion for 3% Reality Check
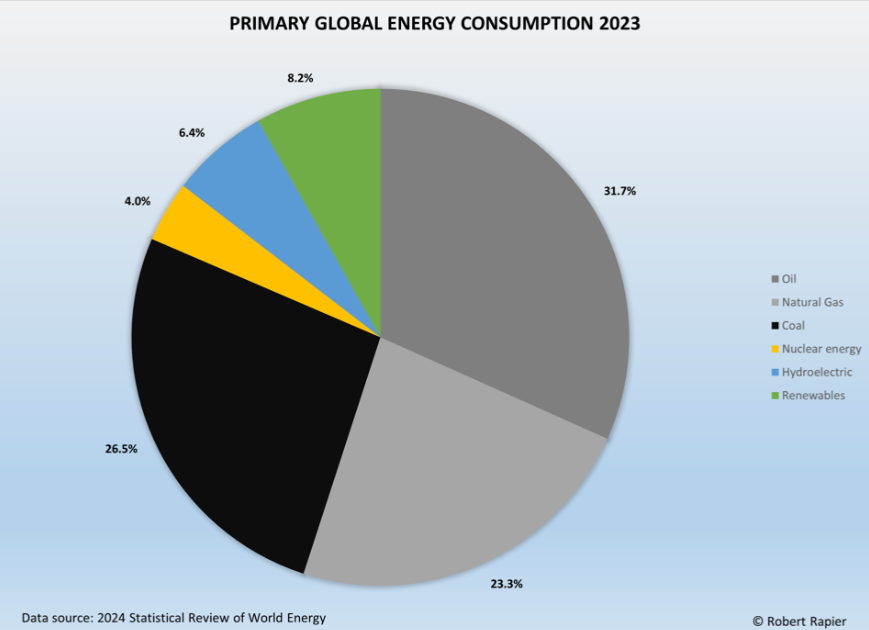
Global primary energy data confirms the minimal impact. In 2024, oil, gas, and coal still dominate ~80-86% of primary energy supply, with wind and solar contributing roughly 3% despite explosive capacity growth in electricity markets.
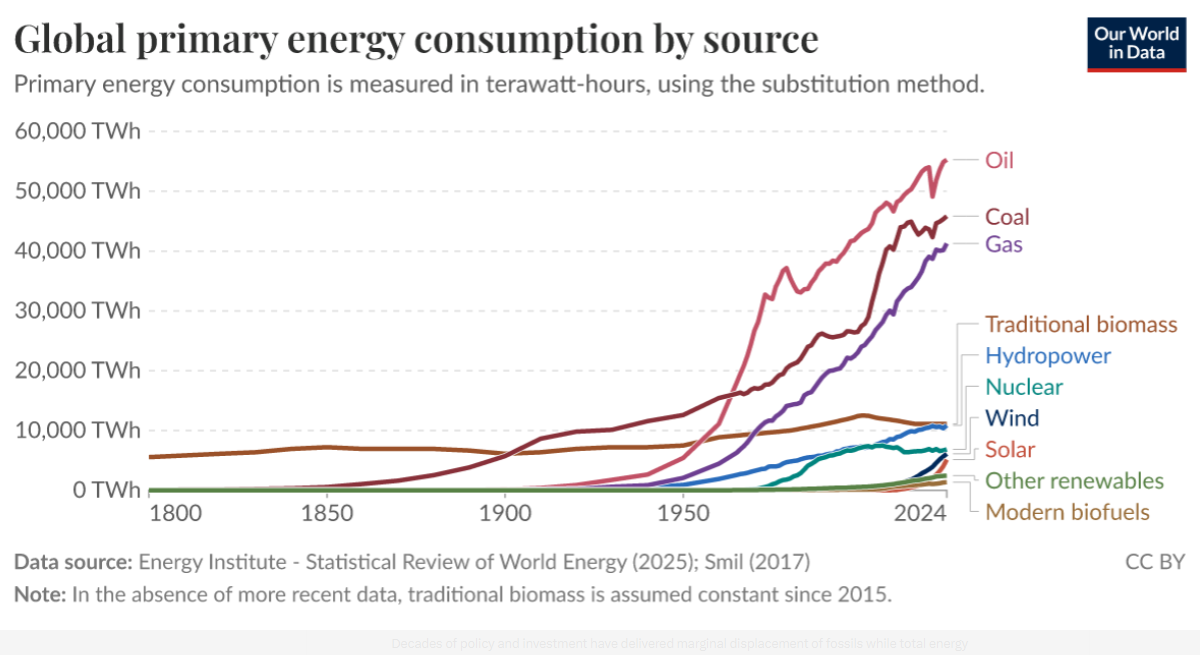
Renewables (including hydro and bio) are higher in electricity (~30-46% projected by 2030 in IEA outlooks), but primary energy—accounting for all uses like transport and heat—tells the true story. Decades of policy and investment have delivered marginal displacement of fossils while total energy demand keeps rising.
The Replacement Treadmill: Not One Transition, But Perpetual Cycles
Every wind turbine and solar panel installed today has a finite life: turbines ~20-30 years, panels ~25-35 years. Peter Clack notes that all ~225,000 turbines worldwide (>1.2 TW) will need decommissioning or repowering before 2050. The same applies to solar.
McKinsey estimates the baseline energy transition requires $9.2 trillion per year, totaling $275 trillion by 2050—figures that exclude the full cost of repeated replacements.
This is the treadmill: build once, pay again (and again) for the next generation.
Grid Costs: The More Renewables, the More Expensive
Intermittency isn’t free. Higher wind/solar penetration drives up system costs for backup, transmission, and balancing. Real-world evidence shows a clear pattern: Germany’s electricity prices rose over 56% as renewables expanded to ~30% of electricity.
U.S. states with aggressive Renewable Portfolio Standards (RPS) saw prices 11-17% higher after 12 years.
Broader OECD analysis links rising renewable shares to higher retail electricity prices.
Studies confirm the correlation: variable renewables suppress wholesale prices in the short term (merit-order effect) but inflate total system costs through grid upgrades, storage, and firming capacity. Places like California and parts of Europe bear some of the world’s highest electricity rates alongside high renewable penetration.
Resources and Manufacturing: Finite Supply Meets Infinite Demand
Modern turbines demand massive inputs: steel, concrete, copper wiring, and rare-earth magnets (0.5–2 tonnes per MW for permanent-magnet designs). China controls ~90% of rare-earth refining. Solar requires aluminum frames, glass, silicon, silver, and copper. Scaling this globally competes for the same materials needed elsewhere in the economy.
Even “green” supply chains rely on fossil-powered mining and manufacturing—often in China, which burns coal to produce the panels and turbines sold to the West.
End-of-Life: The Recycling Myth and Landfill Reality
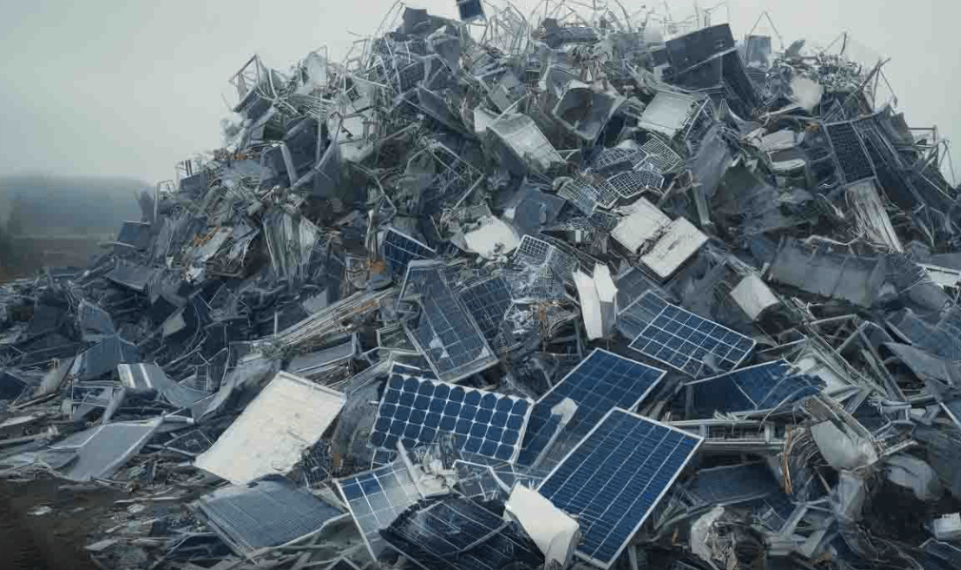
The treadmill’s back end is ugly. In the United States, recycling infrastructure is minimal: ~90% of end-of-life solar panels go to landfills because disposal is cheaper than recycling.
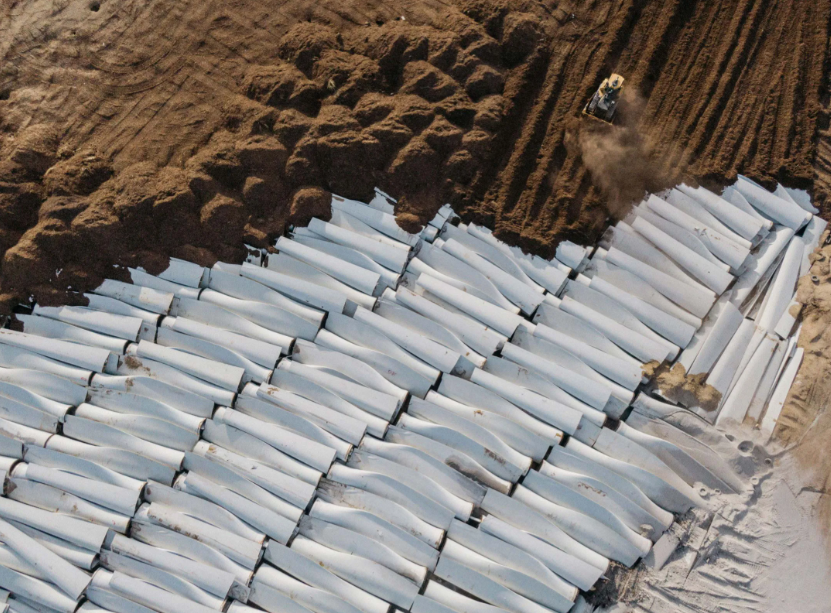
Wind turbine blades (composite fiberglass/epoxy, often airplane-wing sized) are overwhelmingly landfilled. NREL projects 2.2 million metric tons of U.S. blade waste by 2050; globally, 43 million tonnes of blade waste and 60–80 million tonnes of solar PV waste are expected.
Decades of Rising Costs, Minimal Environmental Gain
After trillions spent, fossil fuels still supply the vast majority of primary energy. Emissions reductions have been modest relative to investment, while wildlife impacts (bird/bat deaths), land use, and mining footprints mount. The “diesel paradox” persists: heavy equipment for mining and installation still runs on the very fuels the transition claims to replace.
Conclusion: Unsustainable by Design
The Energy Transition Replacement Treadmill is not a one-time investment—it’s a perpetual, escalating cycle of subsidies, resource extraction, grid overhauls, and waste. With $10 trillion already spent for a 3% primary-energy gain, and the first wave of replacements now approaching, the math no longer adds up. True sustainability requires reliable, dispatchable, affordable energy—not an endless loop of replacement and regret.
Policymakers and investors must confront physical realities: finite resources, engineering limits, and economic trade-offs. The treadmill isn’t just expensive—it’s unsustainable.
Appendix: Sources, Links, and Charts
- Peter Clack X Post (April 30, 2026): https://x.com/PeterDClack/status/2049797274512048446
- Energy News Beat coverage of $10T / 3% claim: https://energynewsbeat.co/electrical-generation/the-world-has-spent-10-trillion-on-green-energy-and-only-reached-3-of-global-energy/
- Energy Institute Statistical Review of World Energy (2025): https://www.energyinst.org/statistical-review
- IEA World Energy Outlook 2024: https://www.iea.org/reports/world-energy-outlook-2024
- NREL / IRENA waste projections and recycling data: Various reports cited in CNBC/Bloomberg coverage (2023–2025).
- Decommissioning cost studies: EPRI, NREL, Finnish Environment Institute reports.
- Price correlation studies: OECD, ScienceDirect papers on RE penetration and retail prices.
- McKinsey energy transition estimates: Referenced in Clack post and related analyses.
Charts and Images (embedded above or linked via sources):
- Primary energy pie chart and time-series from Energy Institute / Our World in Data.
- Casper, WY blade landfill photos (public domain / news sources).
- Solar panel waste piles (illustrative from environmental reporting).
All data drawn from public, verifiable sources as of April 2026. Energy News Beat encourages readers to review primary data for full context.