In recent days, Wall Street’s biggest bear (Morgan Stanley’s Michael Wilson) has flipped to warning of a ‘market meltup’ as a tactical call (based on technicals and positioning, not fundamentals), BofA’s Michael Hartnett also called for a sharp – if brief – bear market rally (with similar technically-driven reasoning).
JPMorgan flow trader Andrew Tyler who said that the key to a more aggressive squeeze may lie with the following:
CTA buying – thought to activate in the 3800 – 3900 range;
Buybacks – said to accelerate coming out of the earnings blackout window as soon as next week;
Macro data – this is still a market driven by yields and the Nov 2 Fed meeting and Nov 10 CPI release loom large.
This trifecta of terror for bears is exactly what Nomura’s Charlie McElligott writes about in his note today and we note that the market is doing exactly what we suspected – melting-up further (after dreadful housing and sentiment data)…
The Nomura cross-asset strategist notes that US Equities Options show more “stabilizing” resumption of “long Gamma vs Spot” location for Dealers at the Index level, while still “Negative $Delta” – helping to create a more compressed intraday trading range, helping to stabilize the market with ongoing tailwind of bleeding Puts in conjunction with upside demand as we rally…
But overall US Equities Index implied Vol stays bid in “spot up, vol up” fashion yet again yesterday, driven by demand for “right-tails / crash-UP” hedges from an underexposed buyside that is terrified of missing the “pivot” rally, which is then evident in the “greater than 2:1” magnitude of the spread on “upside” vs “downside” day absolute returns seen over the month of October, as well as the current and “rare” tendency to see “Corr 1” on UPSIDE moves on “grabbiness,” as opposed to historically seeing “Corr 1” moves on risk-off / DOWNSIDE moves…
…yet downside Puts still too remain firm at the same time, as there certainly doesn’t seem to be any sort of “all clear” from market at this point, due to this persistent Rates and FX vol tension.
Additionally, as SpotGamma notes, realized volatility is starting to come down, and with that, implied volatility. This is a bullish signal for markets as it invokes a vanna tailwind. Skew continues to show no sign of bearish fears as shown by metrics like SDEX…
Crucially, while all eyes have been on exploding call volumes, the guys at SpotGamma note a very important caveat:
Shown below is SPX call volume (red) and open interest (blue), and you can see that there has been a rather impressive surge in call volumes.
However, note that open interest is not moving with the same trajectory. Further, there has been a nearly equivalent surge in put volumes.
Call volume not translating into open interest falls in with this theme of “day trading” as it suggests traders are not positioning for rallies over any time horizon longer than one day.
What we need to see here is call positions entering the market.
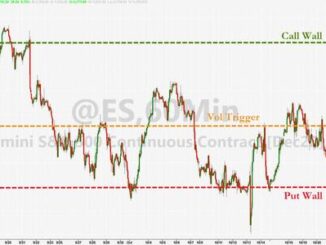
There is a risk here that markets are stalling right around the 3800 area where gamma flips from positive to negative with ‘day traders’ not translating into longer-term ‘BTFD-ers’.
The next leg could come from one of two sources: CTA ‘buy to cover’ flows and/or the end of the share buyback blackout window…
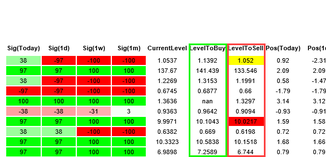
CTA ‘Buy to Cover’ triggers are nearing…
And with 75% of S&P market cap having reported by 10/28 and Goldman estimating the next buyback open window starts on 10/31, we suspect that is when the real buying begins, and “as some companies have already started reporting, we estimate ~25% of the S&P 500 are currently in their full open window (are able to use some discretion).”
Nomura’s McElligott summarizes why equity flows remain tilted towards upside
1. Long Gamma stabilization yet with still Negative $Delta = Put bleed catalyst,
2. Call Skew remaining “Bid” on “Crash-UP” fear-grab
3. post EPS Corp “Buyback” resumption,
4. Vol Control re-allocation buying next 2w to 1m,
5. CTA Trend covering remaining “overhead”
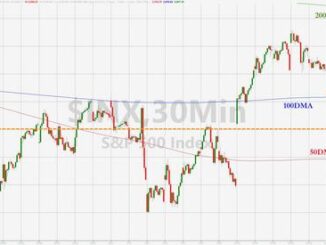
…but LOCALLY, it’s gonna be about MegaCap Tech / Growth Earnings this week (MSFT, GOOGL, AMZN, AAPL)…and as shown below, big “Gamma-y” implied moves (highlight box = earnings implied % move)
Finally, we remind readers of what Goldman desk trader, John Flood – who had been unabashedly bearish into the current market dump – said yesterday:
Some green shoots are appearing. The fact the U.S. mkt was able to shrug off an epic HK -636bp overnight drawdown / China ADR unwind paired with the nuanced dovish shift in fed tone last Friday is making me more constructive on this mkt (for the first time in a while). It feels like the floor has quickly been raised from S&P 3200 to 3500.
Though he did hedge a little by noting the same as McElligott, that there are “still PLENTY of balls in the air as 45% of the S&P market cap reports this week (if MSFT, AAPL, AMZN or GOOGL lay an egg we could still be in some real trouble.”