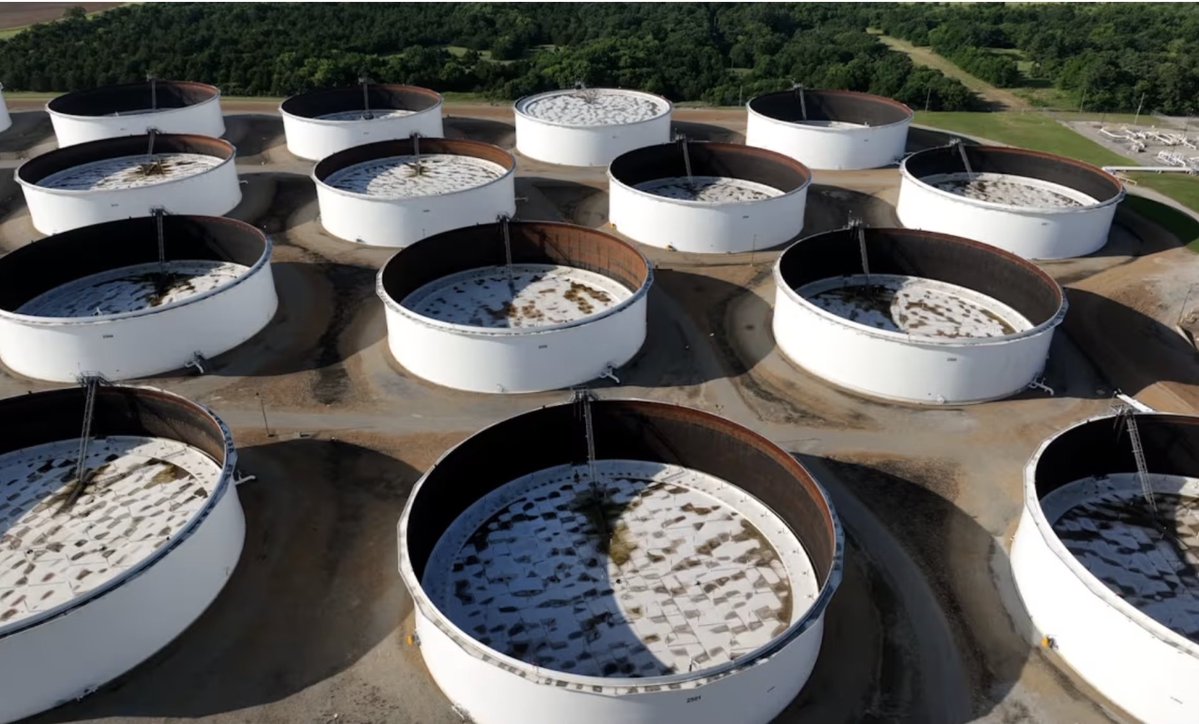
The U.S. Energy Information Administration (EIA) reported a surprise and historically large build in commercial crude oil inventories for the week ending August 7, 2026. Commercial stocks (excluding the Strategic Petroleum Reserve) rose by 17.4 million barrels to 424.4 million barrels—the largest weekly increase since January 2023 and well above analyst expectations of a draw (around 0.6–1.4 million barrels in various polls).
This brought inventories to their highest level since early June and left them only about 2% below the five-year average for this time of year (and roughly flat to slightly lower year-over-year).
Key Drivers and Regional Details
The build was driven primarily by a sharp rise in crude imports and a drop in exports. U.S. crude oil imports averaged 7.3 million barrels per day (up 1.14 million bpd from the prior week). Exports fell notably (reports indicate a decline of roughly 0.6 million bpd to around 3.1 million bpd, near multi-month lows). Domestic production held steady near 13.8 million bpd.
The bulk of the commercial build occurred on the Gulf Coast (PADD 3), which rose by about 14.7 million barrels to 245.2 million barrels. Other PADD changes were more modest.
Cushing, Oklahoma (the key NYMEX delivery hub) inventories increased by 1.6 million barrels to approximately 22.6 million barrels.
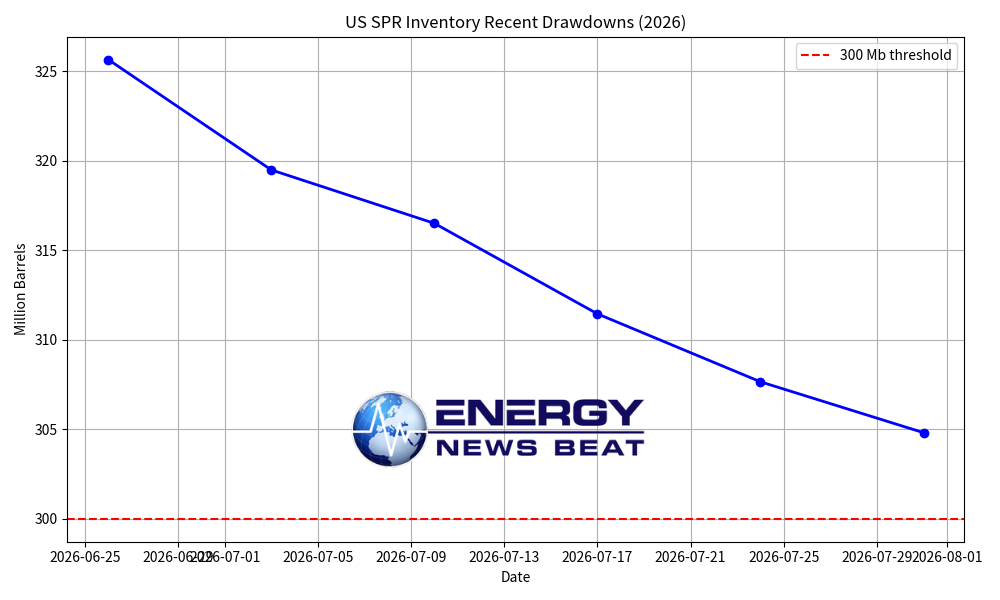
Strategic Petroleum Reserve (SPR) stocks continued their decline, falling 6.1 million barrels to 298.7 million barrels. This marks the lowest level in more than four decades (since around 1983) amid ongoing emergency releases tied to Middle East supply disruptions, including issues related to the Strait of Hormuz.
Total commercial petroleum inventories rose by about 15.7 million barrels.
Refined Products and Refinery Activity
While crude built substantially, product inventories remained relatively tight:
Total motor gasoline stocks fell 1.0 million barrels to 208.7 million barrels (about 6% below the five-year average).
Distillate fuel oil (diesel and heating oil) inventories were essentially flat, down just 0.1 million barrels (or little changed) to around 107.1–107.2 million barrels (about 12% below the five-year average).
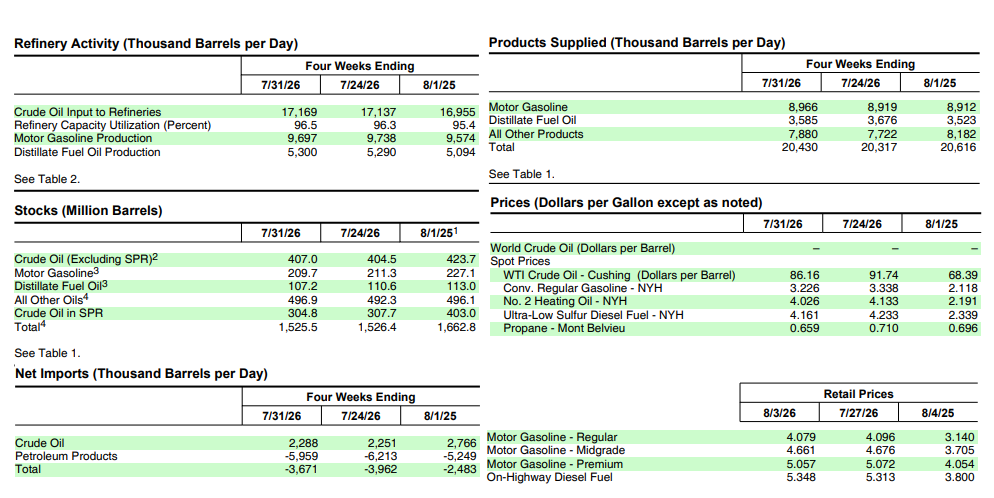
U.S. crude oil refinery inputs averaged 17.2 million barrels per day (up 26,000 bpd). Refineries operated at 96.2% of operable capacity (down 0.3 percentage points). Gasoline production averaged 9.6 million bpd (lower), while distillate production rose to 5.3 million bpd.
Total products supplied (a demand proxy) averaged 20.7 million bpd over the prior four weeks, down 2.1% year-over-year. Gasoline product supplied averaged 9.0 million bpd (down 0.5% YoY), while distillates averaged 3.7 million bpd (up 1.9% YoY).
What This Means for US Consumers
A large crude inventory build is typically bearish for oil prices in the near term, which can eventually translate to lower wholesale costs and potential relief at the pump for gasoline and diesel—especially heading into the later summer driving season and toward heating-oil season. However, product inventories remain below seasonal averages (particularly distillates at a steep 12% deficit), which can keep retail prices sticky even if crude softens. Geopolitical risks and ongoing SPR draws introduce volatility that could offset any downside pressure on prices. Consumers may see modest easing if builds persist and exports stay soft, but tight products and global supply concerns (Middle East) mean prices are unlikely to collapse quickly.
What This Means for Investors in the US Market
The report was clearly bearish for crude futures in the immediate aftermath, with WTI and Brent extending losses on the large surprise build. Energy-related equities, oil ETFs (such as USO), and leveraged oil products often face short-term pressure on such data. Cushing builds can specifically weigh on the WTI-Brent spread dynamics.
Longer-term, investors should note the counterbalancing factors: SPR stocks at multi-decade lows reduce the buffer against further disruptions, product stocks remain lean (supportive for refining margins), and demand signals are mixed but not collapsing. Persistent large builds could signal weaker export demand or temporary import surges, potentially capping upside in oil prices. Conversely, if geopolitics tighten global supply further, the commercial build may prove temporary. Energy sector investors may favor refining exposure over pure upstream producers in the near term while monitoring weekly data for confirmation of a trend.
Overall, the data highlights a bifurcated market—ample (or rebuilding) crude versus tighter products—amid an unusual geopolitical backdrop of SPR releases.
- EIA Weekly Petroleum Status Report summary and data (week ending August 7, 2026): https://www.eia.gov/petroleum/supply/weekly/ and related PDFs/CSVs (e.g., https://ir.eia.gov/wpsr/wpsrsummary.pdf; overview and table data).
- Key reporting: Reuters (“US crude stocks see largest weekly rise in 3.5 years, EIA says,” August 12, 2026).
- Additional coverage: Oilprice.com, Seeking Alpha, CME Group/Econoday, Trading Economics, Morningstar/Dow Jones summaries of the EIA release.
- Historical context and SPR levels drawn from EIA series and contemporaneous reporting on multi-decade lows.
Data reflects EIA figures released August 12, 2026. Markets react in real time; always cross-check the official EIA release for the most precise tables.