


U.S. drilling activity remains resilient with modest gains reported in the latest industry-standard data, while Canada shows stronger momentum. Sources differ in methodology and absolute counts, highlighting the value of cross-referencing multiple providers. Here’s a comprehensive breakdown drawing from Baker Hughes (the longstanding industry benchmark), Enverus (daily GPS-based tracking), and the detailed WellDatabase report you provided.
Baker Hughes North America Rig Count (Week Ending ~June 18, 2026)
Baker Hughes released its North America rig count on Thursday, June 18, 2026 (one day early due to the Juneteenth holiday).
United States: 563 rigs Week-over-week: +1 (from 562 the prior week)
Year-over-year: +9 (from ~554 in mid-June 2025)
By type: Oil-directed 433 (77%, flat WoW), Gas-directed 122 (22%, +1 WoW), Miscellaneous 8 (1%, flat).
Canada: 186 rigs Week-over-week: +6
Year-over-year: +47 (significant rebound)
North America Total: 749 rigs (US + Canada)
Key takeaway from Baker Hughes: The U.S. count has been remarkably stable in the low-to-mid 560s in recent weeks, with a very slight uptick. Gas-directed rigs edged higher while oil-directed held steady. Canada’s sharp year-over-year gain stands out as a bright spot.
Enverus Rig Count Perspective
Enverus provides a daily rig count using GPS tracking on a large portion of the U.S. fleet, offering higher-frequency and often higher absolute numbers than Baker Hughes’ weekly rotary rig tally.
Public snapshots from mid-June 2026 placed the U.S. count in the 610–630 range (with one recent period showing ~626). This is notably higher than Baker Hughes’ 563, reflecting Enverus’ broader capture of active drilling operations and daily granularity versus the weekly snapshot approach.
Enverus data is particularly useful for real-time basin-level insights inside their platform, though public summaries are more limited.
WellDatabase US Rig Report Comparison (June 20, 2026)
The WellDatabase report shows a lower headline U.S. total than Baker Hughes but provides excellent granular detail by state, basin, well type, depth, and operator. At Energy News Beat, we are tracking the difference between Baker Hughes, WellDatabase, and Enverus. We use Welldatabase almost daily and trust their data.
U.S. Total: 537 rigs Week-over-week: –12
Year-over-year: –13
Oil vs. Gas alignment is striking:Oil: 407 (+2 WoW)
Gas: 122 (–1 WoW) — exactly matches Baker Hughes’ gas count
Thermal: 7 | Unknown: 1 | Undisclosed adjustments account for the rest of the gap
The ~26-rig difference between WellDatabase (537) and Baker Hughes (563) likely stems from classification differences (e.g., some rigs counted as “undisclosed” or varying definitions of “active”).
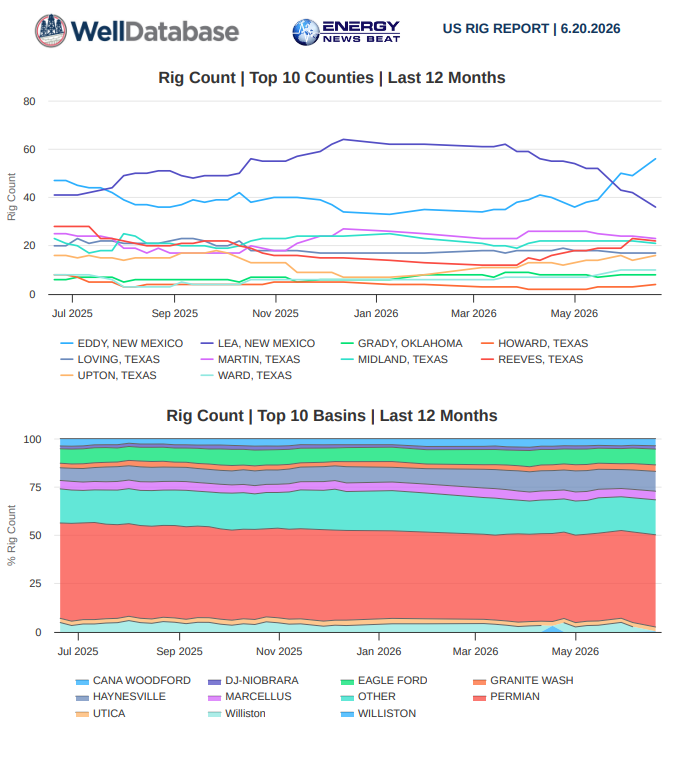
Geographic Breakdown (WellDatabase Data)
Top States (selected):
Texas: 261 (+1 WoW)
New Mexico: 97 (+1 WoW)
Oklahoma: 44 (+1 WoW)
Louisiana: 35 (–3 WoW)
Wyoming: 16
Pennsylvania: 17
Colorado: 12 | Utah: 12 | Alaska: 12
Ohio: 11 | West Virginia: 8
North Dakota activity appears very low in the latest snapshot (sharp reported declines in related categories)
Top Basins (WellDatabase):Permian: 256 (–1 WoW, –15 YoY) — still dominates (~48% of total)
Haynesville: 55 (flat WoW, +19 YoY) — strong gas play momentum
Eagle Ford: 44 (flat, +3 YoY)
Cana Woodford: 20 (+1)
Granite Wash: 18
Marcellus: 24
Williston: 2 (–13 WoW, –25 YoY) — notable sharp drop
Other: 94
Well Type & Profile:Horizontal: 453 (–3 WoW) — overwhelming majority
Directional: 72 (+9 WoW)
Vertical: 11 (–14 WoW)
Depth focus remains in the 10k–15k ft range (240 rigs) and 5k–10k ft (115 rigs), typical for modern shale development.
Operator Snapshot: The WellDatabase operator table highlights many operators currently at zero active rigs (with prior-year activity), underscoring industry consolidation and efficiency focus. Activity remains concentrated among a smaller group of major E&Ps in the core shale basins. Detailed operator-by-operator rankings are typically proprietary or subscription-based across platforms.’
Overall Market Context & Trends
U.S. rig count has stabilized in a narrow band after multi-year declines driven by capital discipline, efficiency gains, and commodity price dynamics. Baker Hughes shows a very slight weekly uptick; WellDatabase shows a weekly dip — both point to a relatively flat-to-mildly constructive environment.
Gas-directed rigs are holding or edging higher (consistent 122 count across BH and WellDatabase), supported by strong Haynesville activity.
Canada’s rebound (+47 YoY per Baker Hughes) is a standout positive signal.
Permian continues to anchor U.S. activity despite modest weekly and yearly declines.
Williston’s weakness stands out as a potential area to watch.
These counts serve as leading indicators for future U.S. and Canadian oil and gas production. Stable-to-rising rig activity, combined with ongoing drilling and completion efficiency gains, supports expectations for resilient supply growth in the months ahead.
The financial control and fiscal responsibility of the United States Exploration and Production companies are truly admirable. We will continue our weekly reports comparing the three main data sources.
- Baker Hughes Rig Count – Official site (data published June 18, 2026): https://rigcount.bakerhughes.com/
- American Oil & Gas Reporter (BH data aggregator): https://www.aogr.com/web-exclusives/us-rig-count (detailed oil/gas/misc breakdowns)
- WellDatabase US Rig Report – June 20, 2026 (welldatabase.com, “RigReport.pdf”)
- Enverus Daily Rig Count – https://www.enverus.com/dailyrigcount/ (methodology and recent public snapshots referenced)
- Supporting context from EIA and industry reporting on rig trends and efficiencies.
Data methodologies differ (weekly rotary vs. daily GPS tracking vs. proprietary databases), so cross-referencing provides the most accurate picture. Let me know if you’d like charts, deeper basin/operator analysis, or a follow-up on frac spreads/production implications! Energy News Beat – Your weekly pulse on North American energy markets.