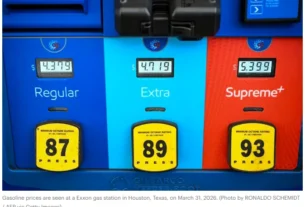
In a timely new analysis published today, Doomberg challenges conventional peak oil narratives with a provocative twist: it’s “Peak ‘Not Oil.’” The piece highlights how surging U.S. natural gas liquids (NGLs) — particularly propane and butane — are delivering a “tsunami of new supply” that the global economy is rapidly adapting to, rendering a narrow focus on crude oil production peaks incomplete at best.
As Energy News Beat prepares to interview Doomberg on July 6 for our Global Oil and Gas Market Update, this analysis examines the data behind the U.S. natural gas and NGL export boom, current inventory levels, domestic reliance on natural gas, and the critical economic dynamics tying drilling decisions to oil prices versus export viability at moderate natural gas prices.
Doomberg’s Core Thesis: Abundance Beyond Crude
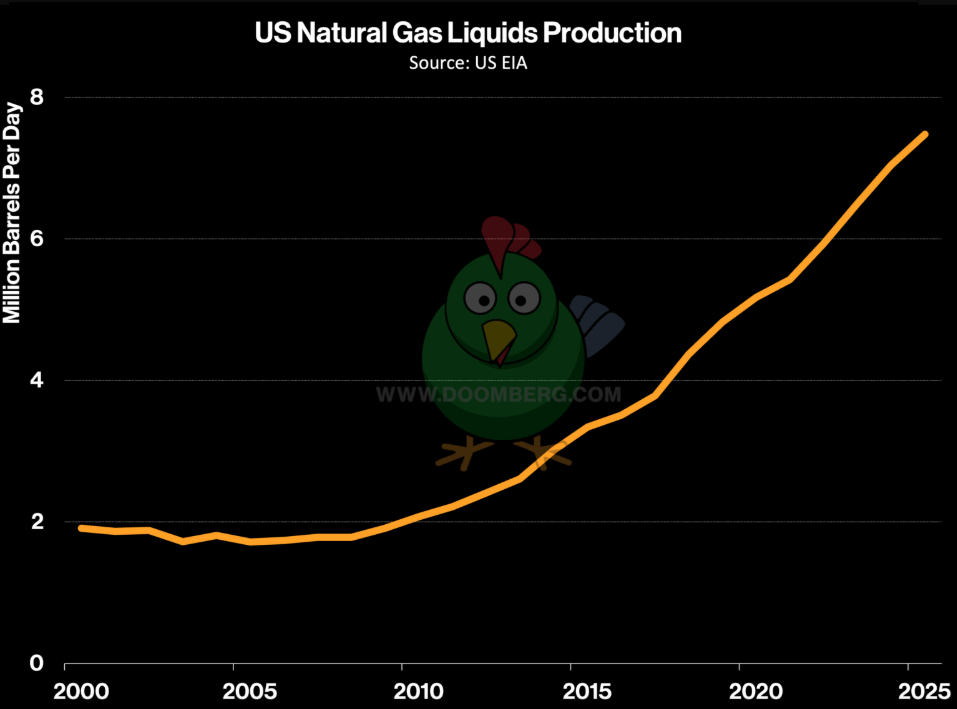
Doomberg argues that NGLs are frequently overlooked in peak oil discussions simply because they carry “gas” in their name. U.S. NGL production is exploding and on track to reach approximately 8 million barrels per day soon. Propane and butane typically make up 40–50% of a typical NGL barrel. The U.S. has become the world’s largest exporter of LPG (liquefied petroleum gas), with markets like India demonstrating massive substitution — kerosene consumption there has dropped 95% since 2000, thanks to LPG adoption.
This abundance narrative aligns with broader U.S. energy realities: record production across crude, NGLs, and natural gas, coupled with strong export channels that provide an outlet for surplus supply.
U.S. Natural Gas Exports: A Record-Breaking Surge
The United States has transformed from a net importer to one of the world’s top natural gas exporters. Recent EIA data shows:Net natural gas exports (exports minus imports) reached a record 21.0 Bcf/d in March 2026 — the highest monthly level since tracking began in 1973.
LNG exports are forecast to average 17.0 Bcf/d in 2026 (up 1.9 Bcf/d from 2025) and rise further to ~18.2–18.6 Bcf/d in 2027 as new liquefaction capacity ramps up.
Pipeline exports (primarily to Mexico) are expected to reach 9.8 Bcf/d in 2026 and 10.0 Bcf/d in 2027.
Overall net exports are projected to grow to 18.7 Bcf/d in 2026 and 20.5 Bcf/d in 2027.
NGLs and Liquids Exports: Record Highs
U.S. natural gas plant liquids (NGPL) production has grown steadily, reaching record levels around 7.5 million barrels per day in recent years and continuing upward.
Exports of these liquids are equally impressive:
NGPL exports hit a record 3.1 million barrels per day in 2025 (up 7% year-over-year).
Propane exports averaged a record 1.8 million barrels per day in 2025.
Normal butane exports reached a record ~535,000 barrels per day in 2025.
These volumes underscore Doomberg’s point: the U.S. is not just producing more hydrocarbons — it is successfully exporting the liquids-rich portion of the barrel at scale.
Inventory Levels: Comfortable and Building
U.S. natural gas storage inventories remain healthy. As of the week ending June 19, 2026:Working gas in storage stood at 2,835 Bcf — up 76 Bcf from the prior week.
This level is 49 Bcf below the same time last year but 152 Bcf above the five-year average.
With summer injection season underway, stocks are building at a solid pace, providing a strong buffer heading into winter demand.
U.S. Dependence on Natural Gas
Natural gas remains foundational to the U.S. energy system:
It accounts for roughly 36% of total U.S. primary energy consumption (2025 data).
In electricity generation, natural gas provided approximately 40–43% of U.S. power in recent years (43.1% in 2023; around 40% projected for 2025–2026).
This dependence supports baseload power, industrial demand, and residential/commercial heating, while also enabling the export boom without compromising domestic supply security.
The Drilling Economics Dynamic: $50–60 Oil vs. $3 Natural Gas
Here lies the key tension: Doomberg’s abundance thesis intersects with real-world producer behavior:
Shale oil breakeven prices for new wells currently average around $60–70 per barrel WTI nationally, with the most efficient Permian locations closer to $55–60/bbl. Breakevens are expected to rise further over time as core inventory depletes.
At sustained $50–60 oil, many marginal shale projects and new drilling programs become uneconomic. Because a large and growing share of U.S. natural gas production is associated gas from oil wells (especially in the Permian), slower oil-directed drilling directly tempers natural gas supply growth.
However, at ~$3.00/MMBtu Henry Hub (current spot and futures prices hover around $3.10–$3.50), the economics flip in favor of exports:U.S. LNG projects remain highly competitive globally due to low feedstock costs and efficient infrastructure.
NGL extraction and LPG exports (propane/butane) generate strong margins at these gas prices.
Export demand acts as a powerful price floor and outlet, allowing producers to monetize associated gas even when oil-directed activity slows.
This creates a self-reinforcing dynamic: moderate natural gas prices (~$3) support robust LNG and LPG exports, which in turn help sustain production economics and prevent domestic oversupply gluts — even as oil prices remain range-bound and drilling activity moderates.
Synthesis: Abundance Meets Export Reality
Doomberg’s “Peak ‘Not Oil’” framing captures an essential truth. While crude oil production may face plateau pressures tied to drilling economics at lower prices, the broader hydrocarbon liquids complex — led by NGLs — continues delivering abundance. The U.S. is successfully exporting record volumes of both natural gas and NGL-derived products while maintaining comfortable inventories and deep domestic reliance on natural gas for power generation.
The interplay is clear: low-to-moderate oil prices may slow associated gas drilling, but viable export economics at $3 natural gas provide the necessary demand pull. This balance supports continued production growth (albeit potentially at a moderated pace) and reinforces America’s position as a global energy exporter.
As global markets navigate geopolitical factors (including recent disruptions tied to the Iran conflict), the U.S. natural gas and NGL export machine remains a stabilizing force.
Energy News Beat will interview Doomberg on July 6th for an in-depth discussion on these themes and the broader global oil and gas outlook. Stay tuned.

Appendix: Sources and Links
- Doomberg – “Peak ‘Not Oil’” (June 30, 2026): https://newsletter.doomberg.com/p/peak-not-oil
- EIA – U.S. natural gas exports and forecasts (April 2026 STEO updates): https://www.eia.gov/todayinenergy/detail.php?id=67484
- EIA – Natural Gas Monthly (March 2026 data): https://www.eia.gov/naturalgas/monthly/
- EIA – Weekly Natural Gas Storage Report (week ending June 19, 2026): https://www.eia.gov/naturalgas/storage/
- EIA – U.S. NGPL Exports (March 2026): https://www.eia.gov/todayinenergy/detail.php?id=67387
- LP Gas Magazine – U.S. propane and butane exports records (2025 data): https://www.lpgasmagazine.com/u-s-propane-butane-exports-reach-record-highs/
- EIA – U.S. Field Production of Natural Gas Liquids (historical data): https://www.eia.gov/dnav/pet/hist/LeafHandler.ashx?n=PET&s=M_EPL2_FPF_NUS_MBBLD&f=A
- EIA – Electricity generation by source (latest detailed): https://www.eia.gov/tools/faqs/faq.php?id=427&t=3
- EIA – U.S. Energy Facts (natural gas share): https://www.eia.gov/energyexplained/us-energy-facts/
- Enverus / Dallas Fed / industry reports on shale breakeven prices (2025–2026 data).
- CME Group / FRED – Henry Hub natural gas prices (June 2026): https://www.cmegroup.com/markets/energy/natural-gas/natural-gas.html
All data current as of late June 2026. EIA remains the primary authoritative source for U.S. energy statistics.