In our March Petroleum Supply Monthly (PSM), we introduced data on the interregional movement of renewable diesel. These new data add to our existing tanker and barge movement coverage for renewable diesel. With the new data, we now capture most of the renewable diesel movements to the U.S. West Coast, the region where most of the renewable diesel is consumed in the United States.
What is renewable diesel, and where is it consumed?
Renewable diesel is a transportation and heating fuel that is chemically equivalent to petroleum-based distillate and is produced using fats, oils, or greases rather than petroleum. A combination of federal and state incentives has attracted major oil companies to construct renewable diesel production facilities across the country.
Because California, Oregon, and Washington are the only states with active clean fuel programs that incentivize the consumption of renewable diesel, we believe that renewable diesel is primarily consumed on the West Coast. Our new rail movement data provide some confirmation for that belief.
We analyze regional movement patterns throughout the United States using five PADDs.
What’s new in the March PSM?
In the March PSM, we introduced the following:
- Inter-PADD renewable diesel rail movements, dating back to January 2022
- PADD-level renewable diesel product supplied. We provide product supplied as a proxy for consumption. Prior to the March PSM, we published a combined PADD-level product supplied calculation for all non-ethanol biofuels. With the March PSM, we are now breaking that out into PADD-level product supplied for biodiesel, renewable diesel, and other biofuels.
What are the key takeaways from the renewable diesel movement data?
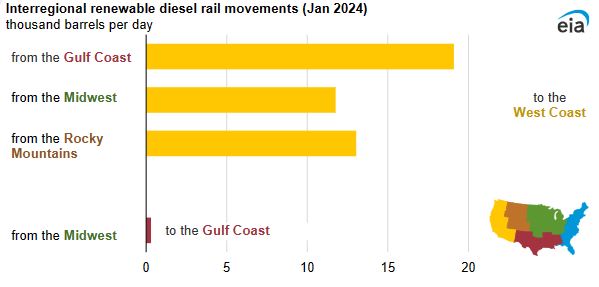
The new movement data show that renewable diesel transport by rail is growing and that most of these rail movements are destined for the West Coast. Rail movement of renewable diesel increased about 50% from early 2022 to late 2023. This increase was likely due to strong growth in renewable diesel production during that period. Of all the movement of renewable diesel for January 2022–January 2024, we estimate that virtually all of it went to the West Coast.
The West Coast receives renewable diesel rail shipments from the Gulf Coast, Midwest, and Rocky Mountains. The largest volume comes from the Gulf Coast, which sends more renewable diesel by rail than other regions because of its significant production capacity. This production capacity supports the movement of significant volumes of renewable diesel by both rail and water. Renewable diesel producers in the Midwest and Rocky Mountains do not ship renewable diesel to the West Coast by water, and the volumes they ship by rail are smaller than those from the Gulf Coast because of less production in those regions.
How do renewable diesel rail movements compare with rail movements of other biofuels?
Renewable diesel rail movements are significantly lower than those for fuel ethanol but higher than those for biodiesel. Fuel ethanol rail movements are the highest among any biofuel because it is the most consumed, and it is primarily moved by rail because its chemical properties make it unsuitable for transportation in pipelines. Biodiesel rail movements are lower than those for renewable diesel primarily because less biodiesel is consumed.
How much renewable diesel is moving by tanker or barge?
Some renewable diesel also moves by tanker or barge from the Gulf Coast to the West Coast. We report data for renewable diesel tanker and barge shipments dating back to 2016 and observed an increase in these shipments when renewable diesel production increased on the Gulf Coast in 2022 and 2023.
Note: No tanker and barge movements were reported in January 2022.
During most months of the past two years, renewable diesel has been the only energy product transported by tanker or barge between the Gulf Coast and West Coast. Before renewable diesel producers on the Gulf Coast began shipping product through the Panama Canal to the West Coast, it was rare for domestic energy product movements to take this route because of limited ships that comply with the Merchant Marine Act of 1920 (also called the Jones Act). The Jones Act requires goods or passengers moved in U.S. coastal waters between U.S. ports to be carried on U.S. flagged and owned ships that are constructed in the United States and crewed by U.S. citizens.
Clean fuel programs in West Coast states have made it economical for some Jones Act-compliant tankers to absorb the expenses of traveling long distances through the Panama Canal to deliver renewable diesel. These shipments have continued in recent months, with tanker and barge movements between the Gulf Coast and West Coast averaging nearly 50,000 barrels per day in January 2024, despite limitations on the number of ships allowed to cross the Panama Canal.


