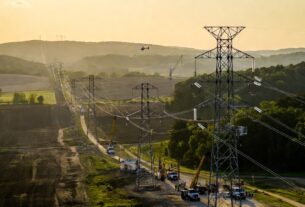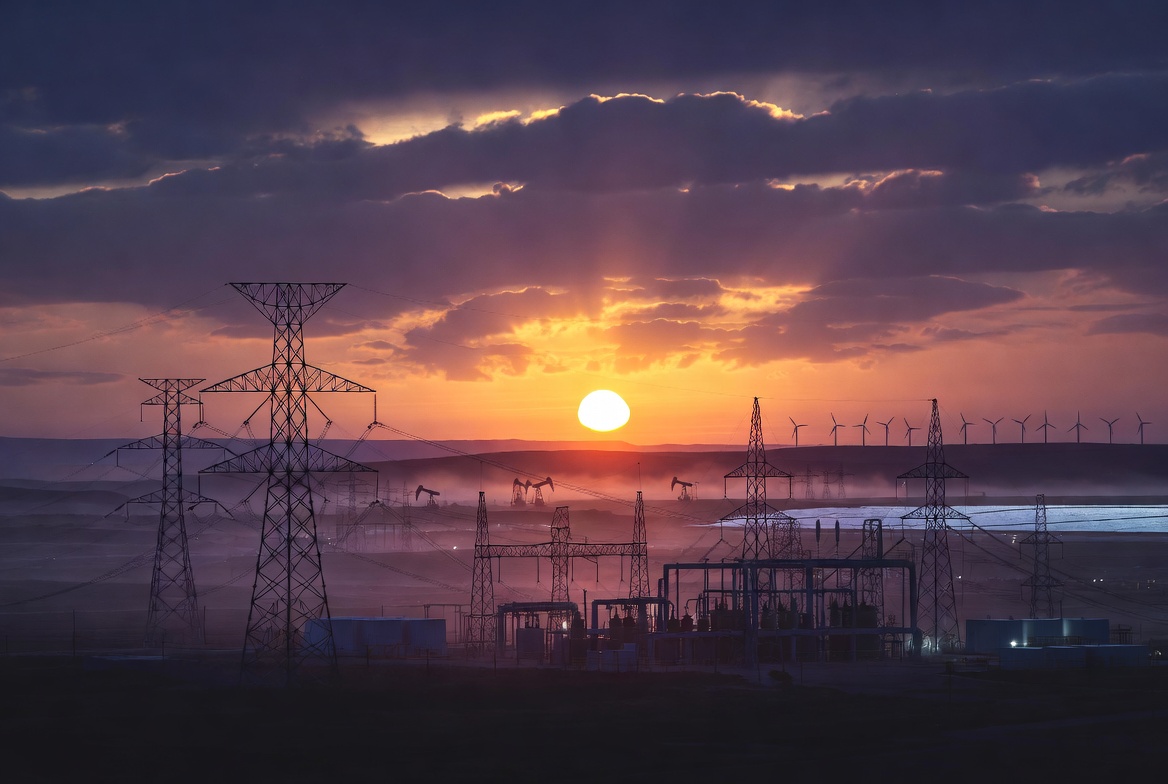
On Wednesday, July 22, 2026, extreme Texas heat drove air-conditioning demand that pushed the Electric Reliability Council of Texas (ERCOT) grid past 91 gigawatts for the first time. Unofficial real-time figures from ERCOT’s website showed a peak around 91,300 megawatts near 5 p.m. CT, with system-wide demand data indicating highs near 91,089 MW. This shattered the previous unofficial highs from the day before (around 87.3–87.5 GW) and the long-standing official record of roughly 85.5 GW set in August 2023.
Energy analyst Doug Lewin (@douglewinenergy) highlighted the milestone in a detailed thread: “Air conditioning demand in extreme Texas heat pushed the ERCOT grid beyond 91 gigawatts today. Before yesterday, we had never exceeded 86 GW so this record shatters the old one. Note there was >20 GW of buffer, no energy emergency, no conservation call.” The grid operated under normal conditions with substantial reserves, wholesale prices remaining well below the cap (95% below at times), and no calls for conservation.
The prior day had already set records for both peak demand and solar output (34,665 MW). July 22 also produced the highest net load on record—peak demand minus wind and solar—beating the previous mark by about 3.5 GW. Batteries played a critical role, discharging over 10 GW as the sun set (the seventh time exceeding 10 GW discharge, with five of those in July 2026 alone).
Energy Mix on the Texas Grid
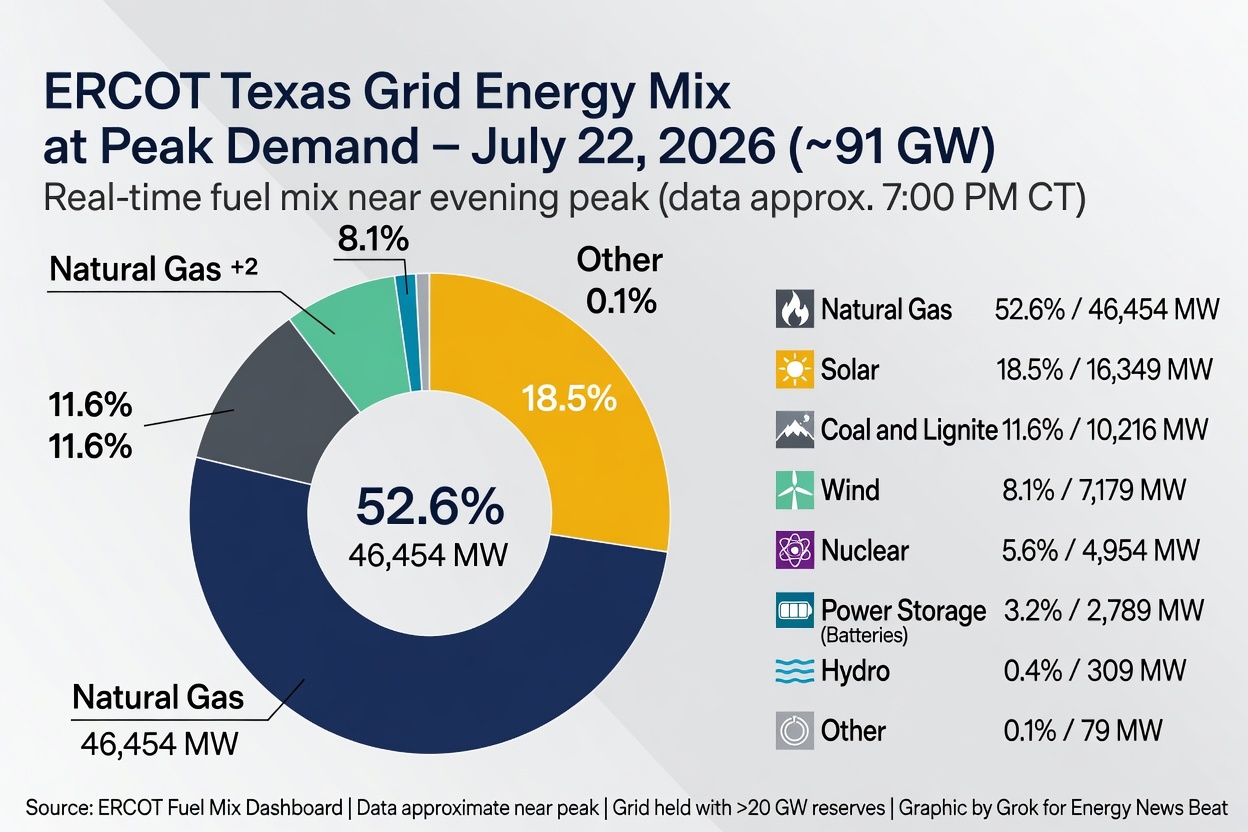
ERCOT’s real-time fuel mix dashboard around the evening of July 22 (near peak conditions, last updated approximately 19:06 CT) showed a diverse and flexible generation stack that met the surge:
- Natural gas: ~46,454 MW (52.6%)
- Coal and lignite: ~10,216 MW (11.6%)
- Solar: ~16,349 MW (18.5%)
- Wind: ~7,179 MW (8.1%)
- Nuclear: ~4,954 MW (5.6%)
- Power storage (batteries discharging): ~2,789 MW (3.2%)
- Hydro: ~309 MW (0.4%)
- Other: ~79 MW (0.1%)
Natural gas remained the largest single contributor, reflecting its role as the flexible backbone. Solar contributed strongly during daylight hours (often 35–45% of generation earlier in the heat wave and rivaling or exceeding gas at times), while wind and storage filled gaps. By the end of 2026, ERCOT projects more than 45 GW of solar and 27 GW of storage capacity, a sharp increase from ~20 GW solar and 5 GW storage in 2023.
Now take a look when the Sun goes down:
Later Evening / After Dark Mix (solar gone – approx. midnight–early AM snapshot when solar = 0 MW)
Public ERCOT-derived trackers (e.g., D Magazine / ERCOT real-time) showed roughly this composition once solar dropped to zero (demand had moderated from the absolute peak but remained elevated due to residual heat/AC load):
- Natural Gas: ~62% (~43,400 MW)
- Wind: ~25% (~17,500 MW)
- Nuclear: ~8% (~5,600 MW)
- Coal: ~3% (~2,100 MW)
- Hydro: ~1% (~700 MW)
- Other: ~1% (~700 MW)
- Solar: 0% (0 MW)
- Power Storage: Batteries were discharging heavily (Doug Lewin reported >10 GW discharge as the sun set — one of the highest of the summer — helping bridge the gap; exact % varies with total load but was a major evening contributor).
This brings up some huge questions. At what cost? – What price are consumers paying for the intermittency of non-baseload power? Why are wind and solar companies not charged for grid resiliency? If the wind had not picked up and batteries were not in place, the ERCOT system could have failed. After you look at what if the wind does not blow, we see huge blackout possibilities and a non-resilient grid with just a small change in circumstances.
Key Drivers for Baseload
Baseload power—the continuous, reliable generation needed to keep the grid stable—continues to come primarily from thermal resources: natural gas (combined-cycle and other plants), coal/lignite, and nuclear. These provide dispatchable output independent of weather. Gas plants, in particular, ramp quickly to follow load and compensate for renewable variability.
Wind and solar are intermittent by nature. Solar production aligns well with daytime cooling demand in Texas heat but drops sharply after sunset. Wind output varies with weather patterns and can be higher or lower independently of peak heat. Net load (total demand minus wind + solar) therefore remains a key stress metric; the record net load on July 22 underscored continued reliance on thermal generation plus storage to cover the residual. Outages of gas and coal units (noted as 40% higher on the record day versus the prior day) were partially offset by stronger wind and battery discharge. The system functions as an integrated whole: each resource contributes, but firm thermal capacity and growing storage provide the essential reliability margin.
Demand After Dark: Do Wind and Solar Help Keep Peak Demand Going?
Evening peaks often remain high because air conditioners continue running as temperatures stay elevated. Solar output falls to near zero after sunset, so it does not directly support post-dark demand. Wind can help when available and was expected to be stronger on July 22 than the prior day. The standout performer after dark has been battery storage: systems charged heavily during high solar periods and then discharged more than 10 GW into the evening, helping suppress prices and maintain reserves. Combined with thermal baseload, this kept the grid stable despite the highest demand and net load on record. Without the rapid growth in storage, the evening net-load challenge would have been significantly tighter.
Overall, the Texas grid demonstrated resilience built on capacity additions, market flexibility, and operational diversity. Reserves stayed ample (>20 GW buffer at the peak), and the lights stayed on through record heat.
Recommendations for Homeowners: Preparing for Blackouts (Weather-Related or Man-Made)
Even with a strong grid performance, localized outages can still occur from storms, equipment issues, or extreme events.
Practical steps include:
- Build a 3-day (or longer) emergency kit: 1 gallon of water per person per day, non-perishable food, manual can opener, flashlights/headlamps + extra batteries, battery-powered or hand-crank radio, first-aid supplies, essential medications (plus cooler/ice packs if needed), portable phone chargers, and copies of important documents.
- Consider backup power: Portable generators (run outdoors only, ≥20 feet from windows/doors/vents; never in enclosed spaces due to carbon monoxide risk), whole-home standby generators with automatic transfer switches, or home battery systems (often paired with solar). Label critical circuits and prioritize fridge, medical devices, fans/AC, and communications.
- Home readiness: Seal drafts, close blinds/curtains during the day to block heat, maintain HVAC (clean filters, professional tune-up), pre-cool the house before peak hours, and have a plan for the coolest room. Keep fridge/freezer closed as much as possible (full freezers can hold for ~48 hours).
- During an outage: Stay hydrated, dress lightly, use battery fans or damp cloths, avoid cooking indoors if possible, and never use gas stoves/ovens for heating. Unplug sensitive electronics to protect from surges when power returns. Know how to report outages to your transmission/distribution utility (not the retail electric provider).
- Longer-term resilience: Explore solar + storage, surge protection, and community resources (cooling centers). Monitor ERCOT alerts and local weather.
Texas continues to grow load rapidly (population, data centers, industry), but the combination of thermal resources, record renewables, and storage is enabling the grid to meet unprecedented peaks without emergency conditions—so far.
As noted above: At what cost are wind and solar to the grid and consumers? We have seen that the moment wind and solar are attached to any grid, the price goes up 100% of the time. Grid resiliency is not charged to them, and it is a total miscalculation of how the grids are priced out.
Charge wind and solar for storage, and give them no subsidies, and let’s see how they behave.
Appendix: Sources and Links
- Doug Lewin X thread (July 22, 2026): https://x.com/douglewinenergy/status/2080058133829832763
- ERCOT Fuel Mix Dashboard: https://www.ercot.com/gridmktinfo/dashboards/fuelmix
- ERCOT Grid and Market Conditions / Dashboards: https://www.ercot.com/gridmktinfo/dashboards
- ERCOT System-Wide Demand: https://www.ercot.com/gridmktinfo/dashboards/systemwidedemand
- GridStatus.io ERCOT records and data: https://www.gridstatus.io/records/ercot and https://www.gridstatus.io/ercot
- WFAA report on 91,300 MW peak: https://www.youtube.com/watch?v=bY3MQfBlaMU
- Inside Climate News (July 22, 2026): https://insideclimatenews.org/news/22072026/texas-grid-operator-ercot-prepares-for-heat-demand/
- Dallas Morning News / Houston Chronicle coverage of heat-driven demand: https://www.dallasnews.com/news/politics/article/hot-temperatures-texas-driving-record-breaking-22353870.php
- ERCOT official site (general grid info and load data): https://www.ercot.com/
- Homeowner preparedness references: Base Power Company tips (https://www.basepowercompany.com/blog/stay-powered-through-summer-storms-9-essential-tips-for-texas-homeowners), Texas Farm Bureau / Texas Heritage for Living (https://blog.txfb-ins.com/preparing-for-power-outages-in-texas/), TXU Energy checklist (https://www.txu.com/energy-resources/power-outage-emergency-checklist-guide), and related Texas utility/outage guidance.
Data from ERCOT dashboards is real-time and subject to later verification by official meters. All figures cited reflect available public reports as of the event.