Overview of Rig Counts
The latest data from Baker Hughes indicates that drilling activity in the United States remains relatively stable amid fluctuating oil prices. As of the week ending October 17, 2025, the total U.S. rig count stood at 548, marking an increase of 1 rig from the previous week.
This includes 418 oil rigs (unchanged week-over-week), 121 natural gas rigs (up 1), and 9 miscellaneous rigs (unchanged).
Compared to the same period last year, the total U.S. rig count is down by 38 rigs.
Breaking down by major states and basins (based on early October data, as detailed state-level updates for mid-October are not fully available in real-time reports):
|
State/Basin
|
Total Rigs (Early October)
|
Oil Rigs
|
Gas Rigs
|
Notes
|
|---|---|---|---|---|
|
Permian (TX/NM)
|
~251
|
251
|
N/A
|
Largest basin; more than five times the rigs in Eagle Ford. statista.com
Recent trends show a slight decline of 1 rig in late September. money.usnews.com
|
|
Eagle Ford (TX)
|
~50
|
N/A
|
N/A
|
Stable but lower activity.
|
|
Texas (Overall)
|
~250-260
|
Majority oil
|
Minor gas
|
Dropped 2 rigs in late September. rigzone.com
|
|
New Mexico
|
~100
|
Mostly oil
|
Minor
|
Part of Permian.
|
|
Louisiana
|
~30
|
Mixed
|
Mostly gas
|
Dropped 1 rig in late September. rigzone.com
|
|
North Dakota (Bakken)
|
~30
|
Mostly oil
|
Minor
|
Steady.
|
|
Oklahoma
|
~40
|
Mixed
|
Mixed
|
Includes Granite Wash (+1 rig recently). rigzone.com
|
|
DJ-Niobrara (CO/WY)
|
~20
|
Mixed
|
Mixed
|
Added 2 rigs recently. rigzone.com
|
Globally, Baker Hughes reports international rig counts on a monthly basis, excluding certain regions like Russia, onshore China, and Iran.
The latest available data for September 2025 shows steady activity in key producing countries. For example, Saudi Arabia has over 230 active rigs across operations.
Other notable countries include:
|
Region/Country
|
Estimated Rigs (September 2025)
|
Oil vs. Gas Breakdown
|
Notes
|
|---|---|---|---|
|
Saudi Arabia
|
230+
|
Mostly oil
|
High activity to maintain production. bakerhughes.com
|
|
United Arab Emirates
|
~100
|
Mostly oil
|
Stable.
|
|
Iraq
|
~80
|
Oil dominant
|
Excluded historically but now tracked.
|
|
Algeria
|
~50
|
Mixed
|
North Africa leader.
|
|
Brazil
|
~20 offshore
|
Oil
|
Growing offshore.
|
|
Europe (e.g., Norway)
|
~30
|
Mixed
|
Offshore focus.
|
|
Total International
|
~900-1000 (estimate based on trends)
|
Oil: ~70%, Gas: ~30%
|
Monthly average; global total (including NA) around 1,700 rigs.
|
International activity has been consistent, with a focus on oil rigs in the Middle East and Latin America, while gas rigs are more prominent in Asia and Europe.
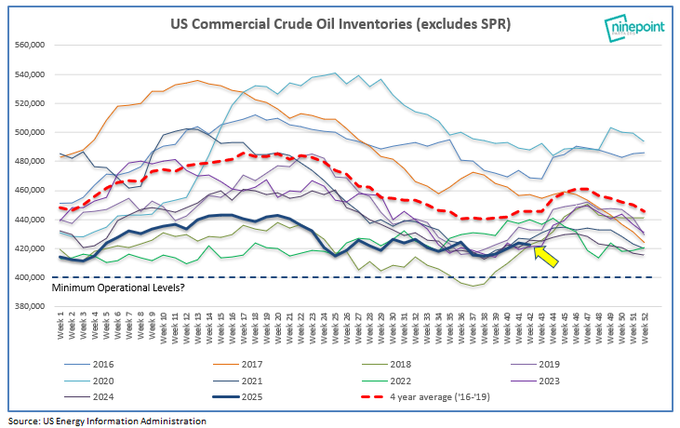
Storage Numbers
According to the U.S. Energy Information Administration (EIA)’s Weekly Petroleum Status Report for the week ending October 10, 2025, U.S. commercial crude oil inventories (excluding the Strategic Petroleum Reserve) increased to 423.8 million barrels, up 3.5 million barrels from the previous week.
This level is about 4% below the five-year average for this time of year.
Total motor gasoline inventories decreased by 0.3 million barrels and are slightly below the five-year average.
Distillate fuel oil inventories (including diesel) fell by 4.5 million barrels, standing 7% below the five-year average.
Jet fuel inventories were not detailed in the summary but align with seasonal trends.
For natural gas, working gas in underground storage totaled 3,721 billion cubic feet (Bcf) as of October 10, 2025, reflecting a net increase of 80 Bcf from the previous week.
This is 26 Bcf (1%) higher than the same time last year and 154 Bcf (4%) above the five-year average.
Floating storage in tankers has reached a record high, with 1.24 billion barrels of crude and condensate on the water as of the week to October 17, 2025.
This surge signals a growing global surplus, driven by increased supply and longer shipping routes.
⭕️OPEC+ supply expected to decline in October.
⭕️China LNG imports projected to be lowest since 2018.
⭕️Permian/Haynesville gas/LNG: Boom is conditional.
⭕️US E-15 politics: Can Trump balance constituent interests?
⭕️Antitrust: AI energy deals.
⭕️LNG as shipping fuel: exaggerated… pic.twitter.com/YrDEU84F0X— Anas Alhajji (@anasalhajji) October 21, 2025
Demand Trends
Demand for oil remains robust in key markets. China and India are leading drivers, with India’s oil demand growth outpacing China’s in 2025.
India’s consumption is projected to add 197,000 barrels per day (b/d), fueled by urbanization and rising incomes.
China’s demand has been revised slightly lower to 42,000 b/d growth but remains strong overall.
Jet fuel demand is experiencing solid growth globally, on track for a 3% increase in 2025, supported by recovering air travel.
However, in some regions like India, growth has slowed after a post-pandemic surge.
In the European Union, diesel demand is under pressure from supply shifts, including the ban on Russian imports, leading to tightened margins and increased reliance on imports from India and the U.S.
Overall, EU diesel consumption is expected to decline modestly by 30,000 b/d in 2025, though regulatory changes could boost renewable diesel.
Capital Expenditure (CapEx) and Long-Term Investment AnalysisGlobal energy investment is set to reach a record $3.3 trillion in 2025, with oil, natural gas, and coal accounting for about $1.1 trillion.
Upstream oil and gas CapEx is projected to grow modestly, with total oil and gas CapEx reaching $654 billion in 2025, expanding at a 4.08% CAGR to $799 billion by 2030.
Major companies like Chevron have announced 2025 CapEx budgets around $20-22 billion, focusing on high-margin upstream projects.
Despite these figures, the industry faces chronic underinvestment relative to natural decline curves. The International Energy Agency (IEA) estimates that nearly 90% of upstream investments since 2019 have been used to offset production declines rather than grow supply to meet demand.
Global oil and gas field decline rates are increasing, requiring trillions in additional investment—potentially $4.3 trillion between 2025 and 2030—to maintain output.
Without sufficient CapEx, supply could drop sharply; for instance, U.S. output might fall 75% by 2035 absent new investments.
This underinvestment, combined with steady demand growth (projected at 700,000 b/d for 2025-2026), positions oil and gas as strong long-term investments.
Potential supply shortfalls could drive price volatility and higher returns, emphasizing the need for balanced energy strategies to ensure security while addressing decline curves.
Key for Investors
As some of our financial experts who have been guests on the podcast point out, the return to tangibles and commodities is critical. We see that investing in oil and gas can be profitable if you pick the right deal and the right wells. Fortunately, we do that on a daily basis and have good tools.
Got Questions on investing in oil and gas? Or do you have a Tax Burden in 2025?
Crude Oil, LNG, Jet Fuel price quote
ENB Top News
ENB
Energy Dashboard
ENB Podcast
ENB Substack