
US LNG export infrastructure is rapidly scaling up, turning American shale gas into a cornerstone of global energy supply. This buildout underscores US energy dominance through exports, as highlighted in recent analyses by commodity trader and analyst Jack Prandelli
on X). His posts detail the current state of US LNG terminals and the surge in final investment decisions (FIDs), positioning the US to reshape the global LNG market.
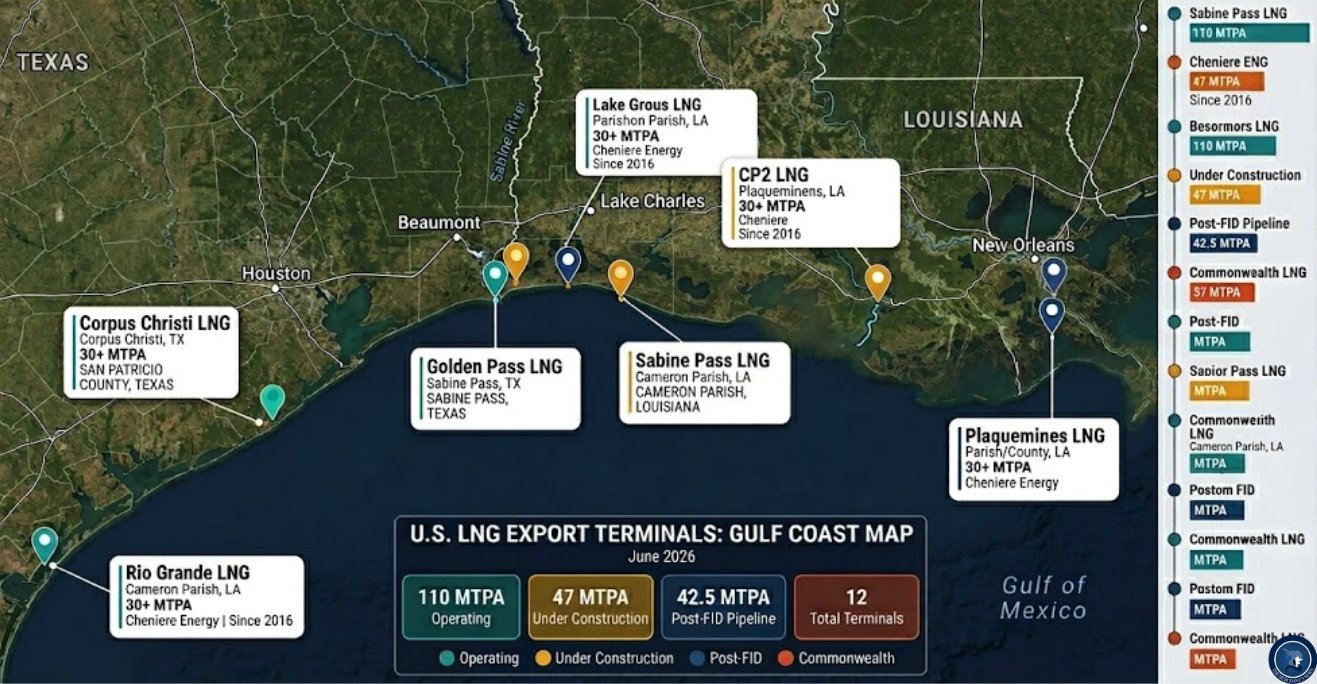
Current Operating Capacity:110 MTPA Across Six Terminals
The US currently operates 110 million tonnes per annum (MTPA) of LNG export capacity from six major terminals, primarily in Louisiana and Texas. These facilities are already powering significant global flows:
- Sabine Pass (Cameron Parish, LA) — Cheniere Energy
- Corpus Christi (San Patricio County, TX) — Cheniere Energy
- Freeport (TX)
- Calcasieu Pass (Cameron Parish, LA) — Venture Global
- Plaquemines (Plaquemines Parish, LA) — Venture Global (Phase 1 recently ramping up)
- Golden Pass (Sabine Pass, TX) — Joint venture involving ExxonMobil and QatarEnergy
Louisiana and Texas together form the engine of US LNG exports, with Cheniere and Venture Global as leading operators. Cheniere’s facilities (Sabine Pass and Corpus Christi) represent a substantial share of current output, with strong operational track records and ongoing optimizations.
Under Construction: Adding 47 MTPA
Several major projects are advancing:
- Rio Grande LNG (~17 MTPA) — NextDecade (targeting 2027–2028)
- Louisiana LNG (~16.5 MTPA, formerly associated with Driftwood) — Woodside (targeting 2029)
- Port Arthur Phase 1 (~13.5 MTPA) — Sempra Infrastructure and partners (e.g., ConocoPhillips; targeting 2028–2029)
These projects will significantly expand Gulf Coast capacity in the coming years.
Post-FID Projects: Another 42.5 MTPA in the Pipeline
Recent FIDs signal strong momentum:
CP2 Phase 1 (Venture Global, adjacent to Calcasieu Pass) — targeting 2029–2030
Port Arthur Phase 2 — Sempra-led, with offtake from ConocoPhillips, EQT, JERA, and others
Commonwealth LNG (9.5 MTPA) — FID announced May 15, 2026; backed by Kimmeridge, Caturus, and Mubadala Energy (targeting late 2020s)
Additional momentum includes Delfin FLNG 1 (4.4 MTPA), which reached FID on June 3, 2026.
Total projected capacity by 2030: ~200 MTPA across approximately 12 terminals — nearly double today’s operating levels.The Bigger Picture: 360+ Billion Cubic Metres (bcm) of Capacity
When combining existing facilities with projects that have already reached FID, US LNG export capacity is on track to surpass 360 bcm annually. According to analysis citing Anne-Sophie Corbeau (Columbia Center on Global Energy Policy / SIPA), this scale is transformative:
- More than twice all US LNG exports in 2025
- Larger than total EU gas demand in 2025
- More than 80% of China’s entire gas consumption in 2025
- More than 60% of all global LNG trade in 2025
A bar chart from the Columbia SIPA Center vividly illustrates this dominance, comparing US capacity (existing + FID’ed) against EU/China demand and global LNG trade volumes.
What This Means for the Global LNG Market
The US is cementing its position as the world’s leading LNG exporter. Flexible, Henry Hub-linked US cargoes (with destination flexibility and hedging potential) contrast with more rigid, oil-linked supplies from traditional players. This shift is already evident as buyers lock in long-term contracts spanning 20+ years.
In the context of regional disruptions (e.g., Qatar’s reported train damage and slower restart), US supply provides a reliable alternative. Qatar’s pre-disruption capacity was ~77 MTPA; even with expansions, loss offtake to US LNG may prove difficult to fully reclaim. US projects are contracted, financed, and advancing on the ground — infrastructure that doesn’t “unbuild” easily.
Traders like Gunvor, Trafigura, and Vitol are actively positioning in US gas and LNG infrastructure, signaling long-term confidence. New buyers (e.g., Germany via Venture Global–EnBW deals, India ramping US volumes significantly, and emerging markets like South Africa) are diversifying toward flexible US supply.
Implications for Consumers Worldwide
For energy consumers in Europe, Asia, and beyond:
Greater supply security and diversification — Reduced reliance on any single region or supplier amid geopolitical risks.
More competitive and flexible pricing — Henry Hub-based contracts allow hedging and resale, potentially stabilizing costs compared to purely oil-linked alternatives.
Long-term certainty — Multi-decade offtake agreements help utilities and industries plan investments (e.g., power generation, petrochemicals, data centers).
Potential price moderation — Increased global supply from the US can help balance markets, especially as demand grows from electrification, industry, and new importers.
Overall, this buildout supports affordable, reliable energy access while accelerating the displacement of higher-emission fuels in some markets.
Investor-Relevant Forward-Looking Statements
Public companies driving this expansion offer compelling visibility:
Cheniere Energy (NYSE: LNG) — Operates the largest US platform (Sabine Pass + Corpus Christi, >53 mtpa operating + expansions). Recent quarters show record cargoes, substantial completions on Corpus Christi Stage 3 trains, and raised 2026 financial guidance (Consolidated Adjusted EBITDA and Distributable Cash Flow).
The company is advancing brownfield expansions (Sabine Pass Stage 5 and Corpus Christi further phases) and signing long-term SPAs (e.g., with CPC Taiwan through 2050). Management emphasizes reliable growth and shareholder returns via its capital allocation plan.
Venture Global (NYSE: VG) — Rapidly scaling with Calcasieu Pass operating, Plaquemines ramping, and CP2 under construction. The company is executing a modular, low-cost strategy across multiple Gulf Coast sites.
NextDecade (NASDAQ: NEXT) — Advancing Rio Grande LNG toward first gas in the late 2020s.
Sempra (NYSE: SRE) — Through Sempra Infrastructure, developing Port Arthur LNG (Phases 1 and 2) with strong offtake commitments from major international buyers.
Other developments (e.g., Delfin via potential reverse merger structures like $TGLO) add optionality in the floating LNG space. Investors should monitor regulatory progress, offtake contracting, and execution timelines, as most capacity is already backed by long-term contracts.
Full context and deeper analysis are available in Jack Prandelli’s Substack article (linked in his posts), which covers Qatar’s position, buyer behavior, and the structural advantages of US LNG.
The map and capacity comparisons shared in Prandelli’s recent posts provide a clear visual of this Gulf Coast transformation. US energy dominance is no longer aspirational — it is being built, contracted, and exported in real time. This positions American producers, infrastructure owners, and the broader economy at the center of global energy flows for the decade ahead.
This appendix compiles all key sources, data references, company statements, and links referenced in the article “Energy Dominance is displayed through your Exports”. Links are current as of June 2026.Primary X Posts (by Jack Prandelli)
- US LNG Export Terminals Map (Operating: 110 MTPA, Under Construction: 47 MTPA, Post-FID: 42.5 MTPA):
https://x.com/jackprandelli/status/2067658399932616984 - US LNG Capacity Scale, Recent FIDs & Market Comparisons (including the Columbia SIPA bar chart):
https://x.com/jackprandelli/status/2067620274120343898
Full In-Depth Analysis
- “Qatar Comes Back 17% Smaller” – Full article by Jack Prandelli (The Merchant Substack) with detailed US LNG pipeline, Qatar context, buyer contracts, and market implications:
https://themerchantsnews.substack.com/p/qatar-comes-back-17-smaller-thats
Capacity Data, Projections & Market Comparisons
- Columbia Center on Global Energy Policy (SIPA) – Source of the “US LNG Dominance” bar chart comparing US capacity (existing + FID’ed) to EU/China demand and global LNG trade (data from GIIGNL, ACER, CGEP):
https://www.energypolicy.columbia.edu/
(Related analysis: https://www.energypolicy.columbia.edu/publications/how-qatars-lng-decisions-will-impact-an-oversupplied-global-market/) - U.S. Energy Information Administration (EIA) – North American LNG export capacity outlook and project details:
https://www.eia.gov/todayinenergy/detail.php?id=66384
Company Reports, Forward-Looking Statements & Investor Resources
- Cheniere Energy (NYSE: LNG) – Q1 2026 Earnings Release, raised 2026 guidance, Corpus Christi Stage 3 updates, and expansion plans:
https://lngir.cheniere.com/news-events/press-releases/detail/339/cheniere-reports-first-quarter-2026-results-and-raises-full - Venture Global (NYSE: VG) – Investor Relations homepage, project updates (Calcasieu Pass, Plaquemines, CP2), and financial materials:
https://investors.ventureglobal.com/
Company site: https://ventureglobal.com/ - Sempra Infrastructure / Port Arthur LNG – Project details, Phase 1 & Phase 2 updates, and offtake agreements:
https://semprainfrastructure.com/what-we-do/lng/port-arthur-lng/
https://portarthurlng.com/ - NextDecade (NASDAQ: NEXT) – Rio Grande LNG project information (company investor materials available via standard NASDAQ channels).
Additional Supporting Resources
- U.S. LNG Export Terminals Status (FERC/EIA compiled data): Searchable via EIA liquefaction capacity files (linked within the EIA article above).
- General Industry Context: GIIGNL (International Group of Liquefied Natural Gas Importers) and ACER data referenced in Columbia analyses.