By Wolf Richter for WOLF STREET.
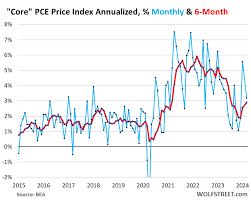
The core PCE price index, the inflation index that the Fed is focused on and refers to all the time, was revised up today for January to an annualized month-to-month growth rate of 5.6% (up from the original 5.1%) on a big up-revision of the index for core services to an annualized rate of 7.9% (up from the original 7.1%). In core services is where inflation is now solidly entrenched.
So in February, on top of those upwardly revised figures for January, the core PCE price index rose by 3.2% annualized from January (+0.28% not annualized), according to the Bureau of Economic Analysis today. This pushed the six-month annualized core PCE price index to 2.9%, the highest since July.
Powell cites this 6-month measure (red in the chart below) all the time because it shows the recent trend better than the month-to-month readings (blue), which are super volatile, and the year-over-year readings, which are too slow in reacting to changing trends. The Fed’s target is 2%.
Core Services PCE price index is where the action is. Energy prices plunged since mid-2022, though they’ve come up again recently, and durable goods prices dropped, and those have produced the cooling inflation rates we saw last year.
But core services inflation – services without energy services – has remained at high levels and has started to re-accelerate. Core services is where the majority of consumers spending goes. And Fed speakers have discussed this issue endlessly.
The horror show came with the January reading of “core services.” In the reading released a month ago, the PCE price index for core services spiked to 7.1% annualized in January from December, the worst month-to-month jump in 22 years. Today this was upwardly revised to 7.9%.
In February, the reading of core services rose by 2.9% annualized (blue line in the chart below). And the 6-month reading rose by 4.25% annualized, the highest since June 2023.
For five months in the second half last year, the core services index had gotten stuck around 3.5%, which had triggered the discussion about sticky services inflation. But core services inflation then got unstuck and has ratcheted higher.
In the month-to-month readings (blue) since August 2023, we see higher highs and the higher lows. This is when the trend changed, but it was hard to see initially due to the huge volatility. Now it becomes clearer:
Durable goods PCE price index rose in February by 2.8% annualized from January, the second month in a row of positive readings, after a big dive into the negative (blue in the chart below). This raised the 6-month index to -1.7% (red).
What we’re starting to see is that the big deflation in durable goods has likely ended, and durable goods price developments are now normalizing, which removes some of the counterbalance to hot inflation in services.
Durable goods pricing is what we’re going to watch very carefully. It’s durable goods and energy that caused the big and very welcome cooling of inflation last year. But energy costs have been rising for months, and now durable goods are starting to become a concern again.
The 7 Core Services Categories.
Core services are grouped into seven PCE price indices. The month-to-month data in these categories of core services can be super-volatile (blue in the charts below), so we’ll focus on the six-month annualized readings, which iron out this volatility and show the recent trends (red in the charts below).
Housing, 6-month annualized: +5.8% in February, having hovered just under 6% since August 2023. The stickiness of housing inflation has surprised lots of people.
The housing index is broad-based and includes factors for rent in tenant-occupied dwellings; imputed rent for owner-occupied housing, group housing, and rental value of farm dwellings.
Financial Services and Insurance, 6-month annualized: +5.2%.
Food services and accommodation, 6-month annualized: +4.4%
Health Care, 6-month annualized: +3.3%.
Transportation services, 6-month annualized: +4.9%.
Includes motor vehicle services, such as maintenance and repair, car and truck rental and leasing, parking fees, tolls, and public transportation from airline fares to bus fares.
Recreation services 6-month annualized: +5.7%.
Includes cable, satellite TV and radio, streaming, concerts, sports, movies, gambling, vet services, package tours, repair and rental of audiovisual and other equipment, maintenance and repair of recreational vehicles, etc.
Other services, 6-month annualized: +1.5%.
A vast collection of other services, including broadband, cellphone, and other communications; delivery; household maintenance and repair; moving and storage; education and training across the board; professional services, such as legal, accounting, and tax services; union dues, professional associations dues; funeral and burial services; personal care and clothing services; social services such as homes for the elderly and rehab services, etc.
The core services inflation head-fakes last time.
Last time core services inflation of this magnitude and higher occurred – in the 1970s and 1980s – there were clear signs that inflation was cooling sharply, that the high interest rates had pushed inflation back down, which caused the Fed to ease, then the core services inflation resurged, and the Fed jacked up rates even further.
So this is the year-over-year “core services” PCE price index which excludes energy and the direct effects of the two oil-price shocks at the time. Powell has mentioned the risk of being misled by head-fakes a few times to support the Fed’s wait-and-see mode.
Enjoy reading WOLF STREET and want to support it? You can donate. I appreciate it immensely. Click on the beer and iced-tea mug to find out how:
Would you like to be notified via email when WOLF STREET publishes a new article? Sign up here


