Energy *IS* the Economy
Introduction
Sustainability is a myth. Our global economy uses energy to process limited natural resources into high entropy waste and heat. Entropy represents dispersed mass and energy unavailable to create physical work. We consume almost 1 kg of natural resources for every $1 of goods and services, which also requires 1 kWh of energy and releases 0.20 kg of CO2.
Many environmentalists today are concerned with a single aspect of energy, CO2 emissions from burning fossil fuels, and ignore energy reliability and cost. Industry, commerce, and transportation require reliable, low cost energy to operate factories, computers, mines, smelters, railroads, ships, and services. Companies move to countries where energy is cheap. The Ukraine war energy cost spikes illustrate the importance of energy.
Society needs to optimize the economic system in which we all live, balancing lowered CO2 emissions, energy reliability and cost, and natural resource consumption. Energy is the lifeblood of the economy, and natural resources are its food.
Energy forms
Energy can be heat energy or useful energy, the ability to do physical work such as lifting an elevator, moving a truck, or generating electric energy. Useful energy includes gravitational potential energy such as water behind a dam and chemical potential energy in a charged battery.
Kilowatt-hours are a measure of energy, distinguished here as kWh for heat and kWh(e) for useful energy like electricity. Heat engines can convert heat energy to useful energy; typically 3 kWh can create 1 kWh(e). Such energy conversion machines include a car’s internal combustion engine, steam turbines, jet engines, and a natural gas power plant. As useful energy is used it becomes heat energy, by friction or decay and dispersion. Each 1 kWh(e) eventually becomes 1 kWh.
Energy drives the economy. There is no substitute for energy. We’ll show that on average in 2022, each $1 of economic production, gross world product (GWP),
- demands 1 kWh of heat energy,
- uses 0.27 kWh(e) of electric energy,
- emits 0.21 kg of CO2, and
- requires 0.96 kg of mined minerals.
Energy, Economy, Entropy
All systems evolve, increasing entropy as orderly structures are dispersed and energy degrades to heat that radiates into space. The universe is expanding and cooling. As our solar system evolves the Sun will cool, expand and consume the Earth. Entropy increases.
The economy is also a system that employs energy to transform Earth’s natural resources to goods and services that degrade to waste and heat. The popular idea of sustainability runs counter to physics and thermodynamics, which dictate that our economy, driven by energy and natural resources, will devolve.
Earth’s energy system
Earth absorbs the Sun’s radiating light, including photons that oscillate faster or slower than those we can see. Faster photons are more energetic than slower, infrared ones. To maintain a stable temperature, the energy absorbed by Earth is balanced by infrared energy radiating to space. The radiated energy is low-grade heat, of less utility than incoming bright sunlight that can power solar panels or chloroplasts in leaves.
The first law of thermodynamics is conservation of energy. Energy is never lost. The useful gravitational potential energy of an apple becomes kinetic energy as it falls from a tree, then heat energy from its impact on the ground. The energy conservation law includes matter, a static form of energy, related by Einstein’s famous E=mc2 equation.
The second law of thermodynamics means energy in a system always degrades its usefulness to do work. The system’s energy dispersion, or entropy, always increases. Orderliness decreases; value decreases. Entropy increases when you dissolve a cube of sugar in a cup of tea and the sugar molecules disperse throughout the water. Undoing this dispersion would be difficult and energy intensive. Mathematically, entropy is proportional to the number of bits in the binary number of possible quantum states of the system.
Why doesn’t everything on the planet earth system degrade to useless disorder as entropy increases? Because the Earth system absorbs the Sun’s low entropy, valuable energy as life on Earth prospers from the energy’s transformations of natural resources, emitting high entropy heat to space. Seemingly, the economy might use sunlight energy instead of potential energy of natural resources embedded in fossil fuels and uranium. However building generating equipment to capture the low density sunlight energy requires massive consumption of natural resources.
Economic system
The economy, too, is a system. Our modern economy performs by using high quality, low entropy materials and energy to provide the services we enjoy. Measured as gross world product (GWP), economic production uses materials and energy.

Figure 1. Energy and natural resources create economic activity. Outlined graphics indicate stocks; other graphics represent processes.
The economic system exemplifies the second law of thermodynamics, with entropy rising as valuable energy becomes low value heat and concentrated natural resources devolve to high entropy, dispersed waste.
Capital goods are the years-long-lived machinery of the economy, such as factories, buildings, ships, highways, tools, and computers. Use and time deplete capital goods; the economy adds to them.
Consumption is production output consumed within one year by people. Their labor is largely the expertise that controls capital goods, powered by energy, for production. People are sustained by food, grown using sunlight energy.
Energy is dissipated by production through dispersion and friction, becoming low quality heat. Consumption creates waste and heat. The capital goods use energy to function. Eventually capital goods cease to function and become waste.
Natural resources such as petroleum, coal, and uranium are raw material sources for valuable energy, delivered as high temperature heat or electricity. Mining requires ever more energy as raw materials such as copper ore and phosphates are harvested from less concentrated sources. The world is not about to exhaust its natural resources; “peak oil” has been repeatedly disproven. However, more energy and productivity must be invested in energy acquisition and conversion as the best sources become depleted, leaving less for economic production of capital goods and for consumption. Energy must be invested for finding, acquiring, and converting the uranium, coal, oil, and gas natural resources.
Waste
The second law of thermodynamics applies to the world economy, transforming energy and natural resources to heat and waste. Though some environmentalists dream of a circular economy, recycling waste is not very effective. Materials are strongly dispersed in high entropy waste and much energy would be needed to recover them. For example, car tires and shoe soles wear down as tiny particles rub off and are widely dispersed.
High value metals may be recovered by investing energy; aluminum is a good example. Energy-intensive manufactured aluminum sells for $2.3/kg. The recycling expense of collecting and bailing clean, used, aluminum cans costs $1.4/kg, more than half the value of recycled aluminum produced. Few recycling opportunities are so profitable.
Embedded energy in goods
Embedded energy is the total of all energy used to create a good or service, including the embedded energy of all input goods and services.
Energy is also stored in natural resource materials such as coal, releasing its chemical potential energy when burned. Two hundred million years ago sunlight powered plants that removed oxygen from atmospheric CO2 and used the carbon. The plants later decayed underground without oxygen becoming the natural resource coal, which contains 2 kWh per kg. Our economic calculations do not count the value of the embedded energy of “free” natural resources such as coal, iron ore, or sand. Let’s illustrate embedded energy with this example of aluminum.

Figure 2. Cost percentages of inputs to aluminum production.
The direct cost of electric energy totals 36% of the cost of aluminum. Cheap electricity in the Columbia River basin led Alcoa to build electrolysis smelters there, and cheap aluminum led Boeing to build airplanes in Seattle. Aluminum is called “solid electricity” because electricity is the biggest ingredient.
The next biggest cost, 23%, is for the material alumina, aluminum oxide refined from mined bauxite. Alumina is typically transported by ship to the smelter, so there is transportation energy cost in this alumina cost. Alumina is produced using energy to heat bauxite ore in a pressure vessel at 150-200°C in a sodium hydroxide solution. Shipping bauxite ore requires propulsion energy. Bauxite is harvested by energy intensive strip mining. Including these energy expenditures brings aluminum’s embedded energy far over the direct 36% smelter component.
The aluminum smelter itself is a capital good, which required materials, transportation, and energy use during construction. The smelter’s embedded energy is rationally allocated to its produced aluminum, proportionately to the 5% depreciation over its lifetime.
Where do we stop such analysis? Accounting for the strip mining equipment, trucks, ships, transportation fuel, etc. reveals that energy is the principal component of the economy. The originating upstream source of these production processes is natural resources, transformed by capital goods, powered by energy, directed by labor.
Embedded energy in labor services
Labor in such an aluminum production factory is largely the expertise to operate the capital goods that move and process materials. Two centuries ago people were paid for physical work, say lifting 16 tons of coal per day onto a cart 2 meters high. Tennessee Ernie Ford sang “You load sixteen tons and what do you get? Another day older and deeper in debt.” That worker’s energy is 16,000 kg x 9.8 n/kg x 2 m = 313,000 joules = 0.087 kWh(e), worth about 2 cents today. The labor services’ cost and value now is 10,000 times that.
Today labor service is not providing work energy but expertise to operate a capital asset, such as a truck, Bessemer furnace, computer, or pencil. Humans develop their expertise while consuming food, education, healthcare, housing, protection, and other services that depend on energy, natural resources, and other goods and services. At work, the laborer’s services use the embedded energy of commuting, living in a home, obtaining food, and wearing appropriate clothing. Your doctor’s expertise and skills depend on energy-enabled education and experience. With no energy-enabled economy your doctor would be a witch doctor.
Valuing energy in the economy
Each $1 of Gross World Product requires 1 kWh of energy.
Gross Domestic Product (GDP) is essentially the market value of goods and services produced by a nation during one year. National GDPs include adjustments for imports, exports, government taxes and subsidies, and foreign ownership. The sum of all nations’ GDPs is Gross World Product (GWP) is simpler because international components cancel.
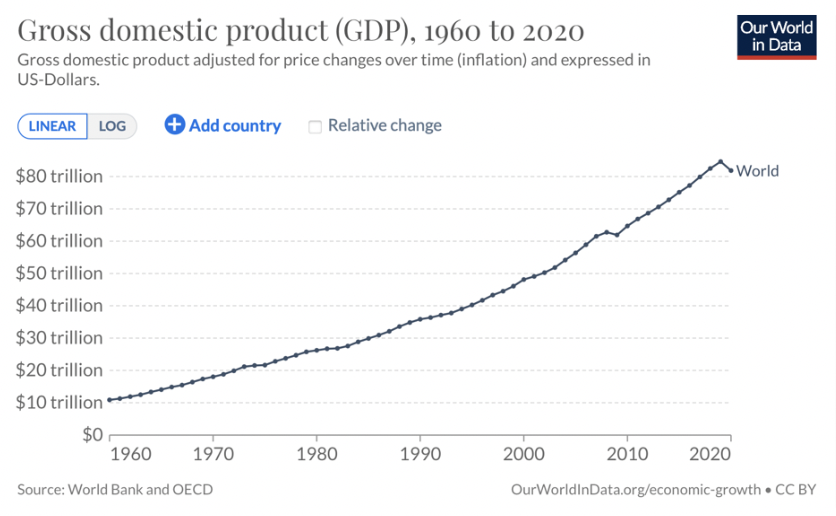
Figure 3. Gross World Product, constant 2015 dollars.
GWP is plotted in Figure 3, though labeled GDP (nation=World). For 2022 GWP sums to $104 trillion.

Figure 4. World heat energy consumption.
Figure 4 shows global heat energy consumption (excluding food) through 2021 at 176,000 TWh per year, or 176 PWh/year, or 20,000 GW. BP reports 165,000 TWh/year. We’ll assume 176,000 TWh/year for 2022.
This Figure 4 plot also shows US energy consumption, which is essentially flat. This flatness has given rise to false hopes that countries will be able to increase their GDPs without increasing energy consumption. The reality is that stricter environmental controls and government regulations have made energy intensive industries such as aluminum, steel, and cement manufacturing uneconomic in the United States. Energy intensive industries have relocated to developing nations.
The Figure 4 graph of GWP looks much like the Figure 3 graph of world heat energy consumption. The ratio of GWP to annual energy consumption is termed energy intensity, plotted in Figure 5.

Figure 5. World energy intensity, kWh/$, in 2011 dollars.
Though labeled as PPP the data are actually GWP (world summed GDP) in nominal US dollars at their 2011 value. PPP (purchasing power parity) is defined to be nominal GDP for the United States. Energy intensity has fallen with time, but the decline is slowing and leveling out at about 1.42 kWh per (2011) dollar in 2018, the latest data available from OurWorldInData.
One reason for the decline of energy intensity has been the technology improvement in conversion of heat energy to useful energy. Higher temperature heat sources permit more efficient conversion to work, electricity, and other useful energies. For example, legacy coal-fired electric power plants have a conversion efficiency of about 33%, while new, advanced combined cycle natural gas power plants can achieve conversion efficiencies of 60%. Energy intensity decline may be leveling out because physics (Carnot’s Law) limits improving heat to useful energy conversion efficiencies. World and United States energy intensities may be merging because new plants in the rapidly developing world use modern, efficient energy technology.
Measures of energy intensity vary significantly depending on the source.
From 2011 to 2022 the GDP deflator rose 29%. Enerdata’s estimate of world energy intensity is an annual decrease of 1.5% in 2019, slowing to 1% thereafter, altogether 4.5% for 2018 to 2022. To adjust OurWorldInData 2018 energy intensity measured in 2011 dollars, the 2022 global energy intensity in 2022 dollars, is 1.42 x (1-0.29) x (1-0.045) = 0.96 kWh/$.
IEA estimates 2019 energy intensity is 4.7 MJ/$ in 2017 dollars. or 1.31 kWh/$. Adjusting for the GDP deflator from 2017 to 2022 (0.85) and Enerdata’s 1%/year gives 2022 energy intensity in 2022 dollars as 1.31 x 0.85 x 0.98 = 1.09 kWh/$.
However simply dividing 2022 world energy (176 TWh/year) by IMF 2022 GWP ($104 trillion) gives 1.69 kWh/$.
We’ll use 1 kWh/$ as a rough estimate unless there is better information.
Wide variations of supply and demand make prices volatile in the short term. In the longer term high prices incentivize production, so prices drop but not so low as to become uneconomic for the producer. Prices for competitive goods drop to levels based on costs of production, which is strongly based on the cost of energy.
Each $1 of GWP demands 0.27 kWh(e) of electric energy.
Electric energy is useful energy, such as work, kinetic energy, or electricity. The notation Wh(e) distinguishes useful, electric energy from Wh for heat energy.
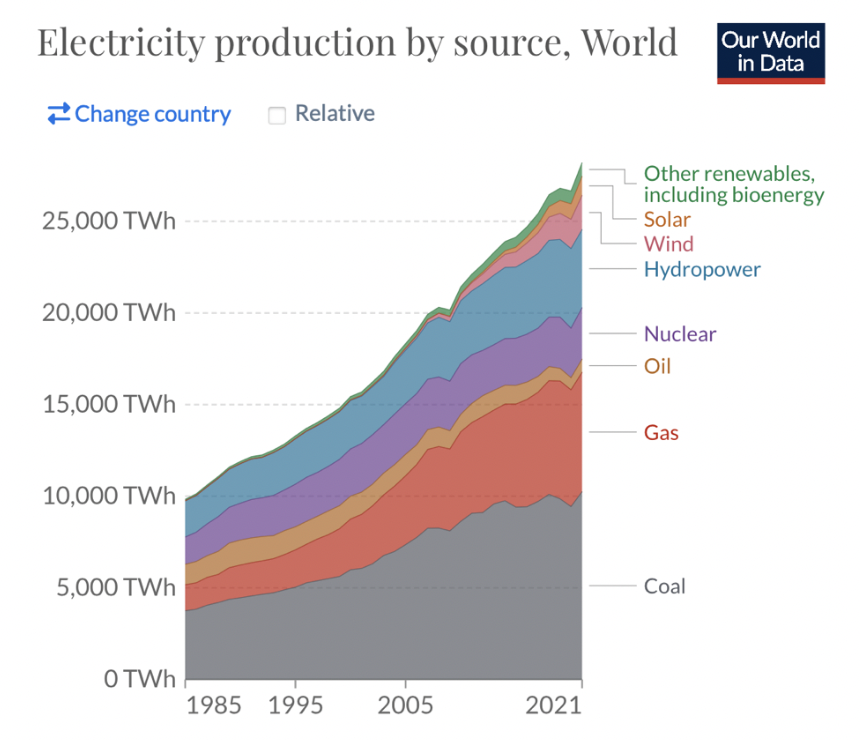
Figure 6. Electricity production by source.
Electric energy use reported by OurWorldInData for 2021 in Figure 7 was 28,000 TWh(e), or 28 PWh(e), or about 3200 GW average power. World Bank and Statista estimate GWP for 2022 at $104 trillion, so electric energy intensity is 28/104 = 0.27 kWh(e)/$.
36% of all heat energy is used to generate electric energy.
The 28 PWh(e) electric energy use includes 7 PWh(e) generated directly from solar, wind, and hydro sources. The remaining 21 PWh(e) was sourced from about 63 PWh of heat energy, converted to electric energy at 3 kWh to 1 kWh(e). Annual world energy use is 176 PWh, so 63/176 or 36% of all heat energy is used for electric energy generation.
Only 3 PWh of that 63 PWh of that annual heat energy comes from nuclear fission, so 60 PWh comes from combustion. This is a huge opportunity to use fission heat instead of combustion heat to generate electricity. We can now generate electricity with even less heat energy, using high temperature heat. Advanced fission power plants operating at 700°C raise thermal-electric conversion efficiency from typical 33% to over 46%.
Solar panels and wind turbines produce electric energy without requiring heat energy, but there are drawbacks. The large up-front embedded energy and embedded CO2 from manufacturing and installing such dispersed energy sources must be allocated over their lifetimes.
Intermittency is another, difficult problem. Typically gas turbines operate when wind or solar energy is reduced. Modern combined cycle gas turbine (CCGT) power plants in steady operation achieve a 60% conversion efficiency of natural gas heat to electric energy. However combustion turbines that power up and down quickly to supplement intermittent wind and solar generators operate at lower 34% efficiency, generating nearly twice the CO2 emissions of CCGTs. This erases much of the CO2 savings compared to using CCGTs steadily without wind and solar disruptions.
Demand for electric energy will grow rapidly in the developing nations.
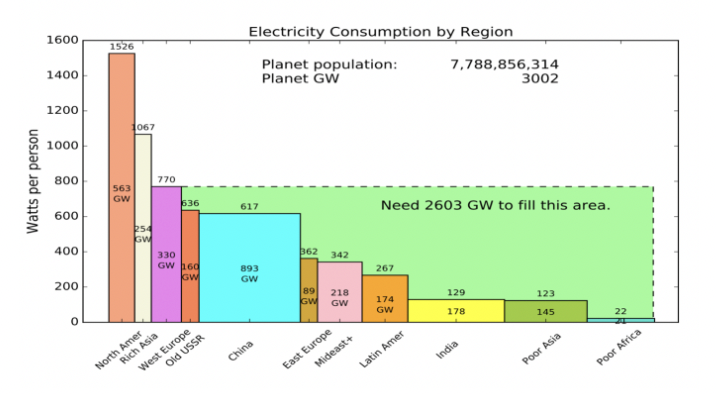
Figure 7. Developing nations’ shortfall in electric energy use.
The height of each colored block represents the average electric power consumption per capita. The width is proportional to the regional population, so the area represents regional average electric power generated and used. If citizens of developing countries use as much power as Europeans, electric power demand would increase by 2600 GW, or 23 PWh/year.
Each $1 of GWP requires mining 0.96 kg of natural resources.
The demand for mined minerals is sometimes overlooked, but it is substantial. Natural resources and energy are the materials that drive the economy. The UN reports that natural resource materials consumption, unchanging since 2010, is 0.96 kg/$. Such mined resources include coal and petroleum for energy.
The Society for Mining, Metallurgy & Exploration Foundation reports US per capita annual minerals use at 39,431 pounds. This is roughly 0.26 kg/$, low because the US service economy is not as industrial as the rest of the world’s.
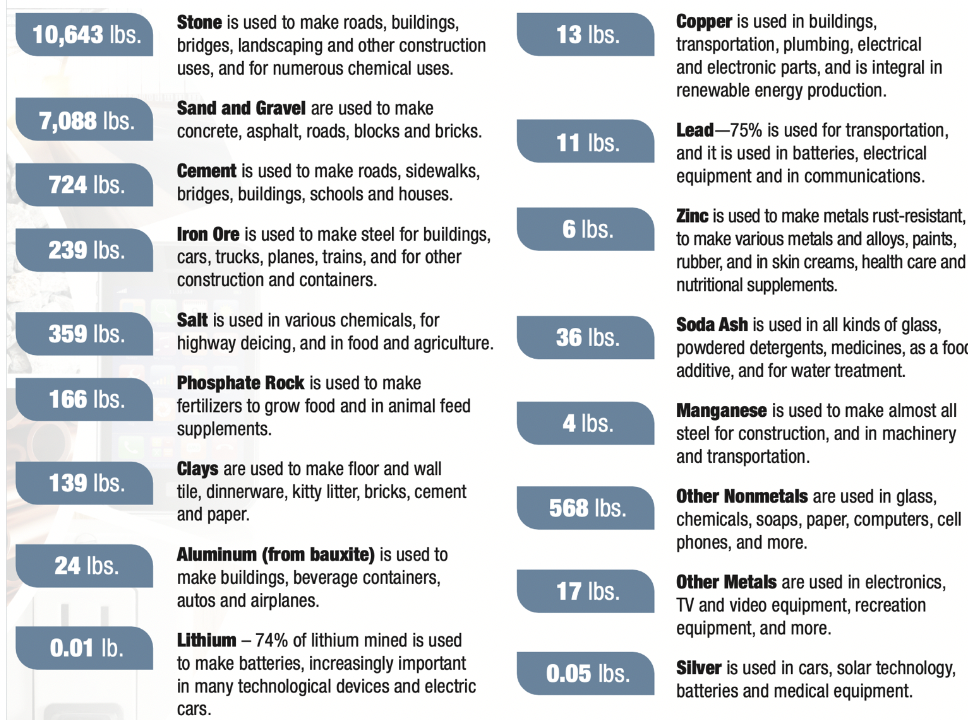
Figure 8. US per capita, annual natural resources use.
In addition,The Society estimates per capita energy source minerals include 914 gallons of petroleum, 3,290 pounds of coal, 94,560 cubic feet of natural gas, and 0.15 pounds of uranium.
Seemingly wind and solar radiation from the Sun could generate electric energy without mining and consuming Earth’s natural energy resources. However, producing the capital goods involved in building such generators consumes ten times more natural resources than building nuclear power plants. The Figure 9 tally below does not even include the natural resources needed to build material-intensive storage batteries to mitigate intermittency, nor transmission lines to mitigate the dispersion of locations where solar and wind energy might be collected.
Mass of material, tonnes/TWh(e)
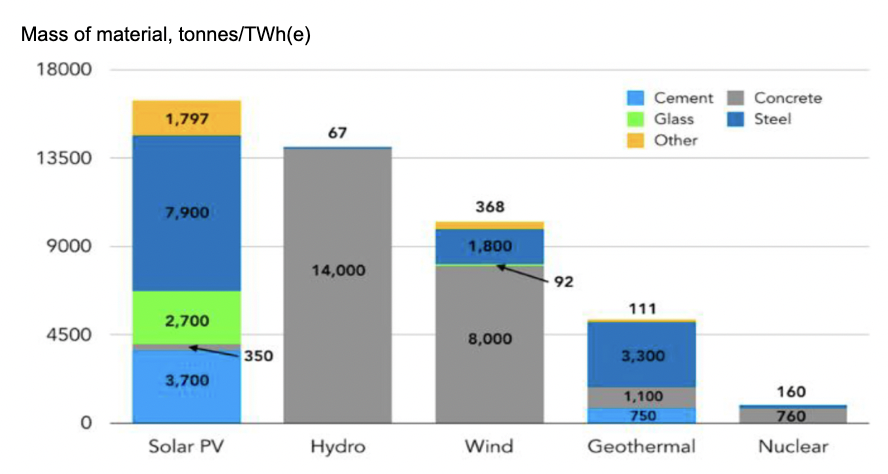
Figure 9. Lifecycle material mass requirements for energy sources per unit energy.
Nuclear power can supply electric energy using a fraction of irreplaceable natural resources required for solar, hydro, and wind generation.
World average energy cost is $0.059/kWh.
Enerdata estimated in 2010 that $6.4 trillion, just over 10% of GWP, was spent for energy. For 2022 the International Monetary Fund estimates GWP to be $104 trillion, suggesting energy expenditure of $10.4 trillion at the Enerdata ratio. Energy consumption in 2022 is about 176,000 TWh (176 PWh), so average energy cost is $10.4 trillion / 176,000 TWh = $0.059/kWh for the world economy.
Average energy cost varies considerably with the quality of energy, such as the difficulty of converting it to useful energy like work or electricity. These examples bracket the average of $0.059/kWh.
Petroleum is an easily transported liquid with high energy density; diesel’s is 12.7 kWh/kg. The US August 2022 average price was $5.1/gallon-diesel, or an energy cost of $5.1/3.2 kg / 12.7 kWh/kg = $0.125/kWh.
Coal prices are volatile, so $200/ton for coal is just an informed guess. At 7 kWh/kg its energy cost is $0.028/kWh.
Volatile US natural gas energy cost at $8/MMBTU is $0.027/kWh.
Embedded CO2 is 0.21 kg/$.
OurWorldInData estimates 148 TWh of energy from combustion of fuels in 2021. At 0.25 kg-CO2/kWh this is 37 Gt of CO2 emissions, closely matching their separate CO2 emissions estimate.
For a reasonableness check, in one year ending Sept 2022 Mauna Loa observatory measured atmospheric CO2 density rose by 0.64%, or 21 Gt-CO2 of the atmosphere’s 3210 Gt-CO2, but this is net of other sources such as forest fires and sinks such as ocean absorption and new forest growth.
We can use costs to estimate embedded CO2 from constructing capital goods. About 84% of world energy is derived from burning fossil fuels such as oil, coal, or natural gas, and the rest from hydro, fission, wind, and solar sources. CO2 emissions of 0.25 kg/kWh are typical for petroleum products diesel, jet fuel, and gasoline. Emissions range from 0.18 (methane) to 0.28 (coal) kg per kWh. Using 0.25 kg-CO2/kWh for 84% of energy use gives in 2022
1 kWh/$ x 0.84 x 0.25 kg-CO2/kWh = 0.21 kg-CO2/$, in 2022 dollars.
Thus we can roughly estimate atmospheric CO2 emissions for producing a capital good or service by multiplying the dollar cost by 0.21 kg-CO2.
To test this concept consider the cost of a product that is sold in volume in a competitive market — an auto. Least expensive models are priced most competitively. In 2019 Volkswagen estimated the CO2 emissions from producing a VW Golf and VW e-Golf. I trust VW’s reformed, good behavior in the wake of dieselgate. For my Dartmouth Osher course I annotated VW’s graphic to highlight approximately 12,000 kg-CO2 for an e-Golf including its battery and 6,000 kg-CO2 for a diesel powered Golf. Note 1 t = 1 tonne = 1,000 kg.
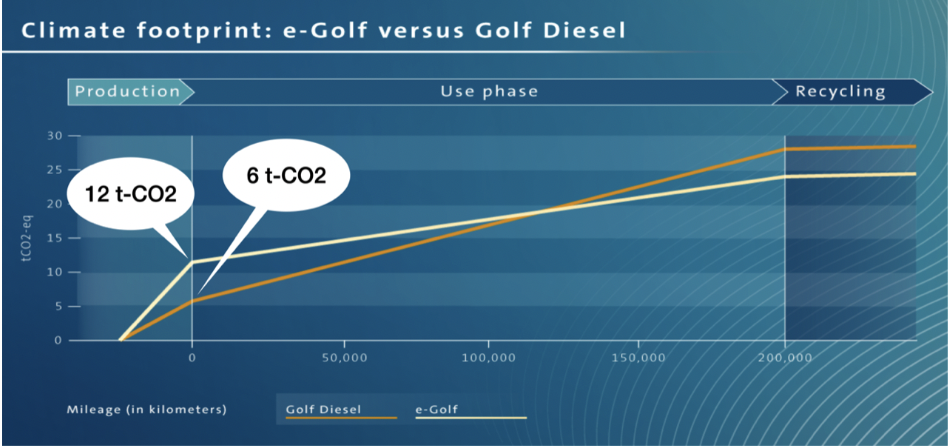
Figure 10. Volkswagen estimate of CO2 emission from manufacturing Golf auto.
In 2022 the least expensive model VW Golf GTI sold for $28,880. Multiplying 0.21 kg/$ x $28,880 = 6,000 kg-CO2, closely matching VW’s own estimate.
Using the energy/cost ratio of 1 kWh/$ implies that Golf required 28,880 kWh of energy in its manufacture. VW’s 2015 analysis was reported to be 24,000 kWh for a Golf, and 56,000 kWh for an e-Golf. Computing accurate embedded energy is difficult. In his Hot Air book David MacKay estimated 76,000 kWh to build an unspecified car.
Global energy return on investment (EROI) is 17:1.
Globally, on average, we spend $0.059 to obtain 1 kWh of energy, which can generate $1 of GWP. The energy investment of $0.059 can return $1 worth, so EROI is $1/$0.059 = 17:1.
The ratio of energy-out to energy-in is termed EROIE, energy return on invested energy, often shortened to EROI. Global average EROI is 17:1, for heat energy out/in.
Source: Gridbrief.com