Total debt rose over the years as a larger population financed more costly collateral. But income rose too.
By Wolf Richter for WOLF STREET.
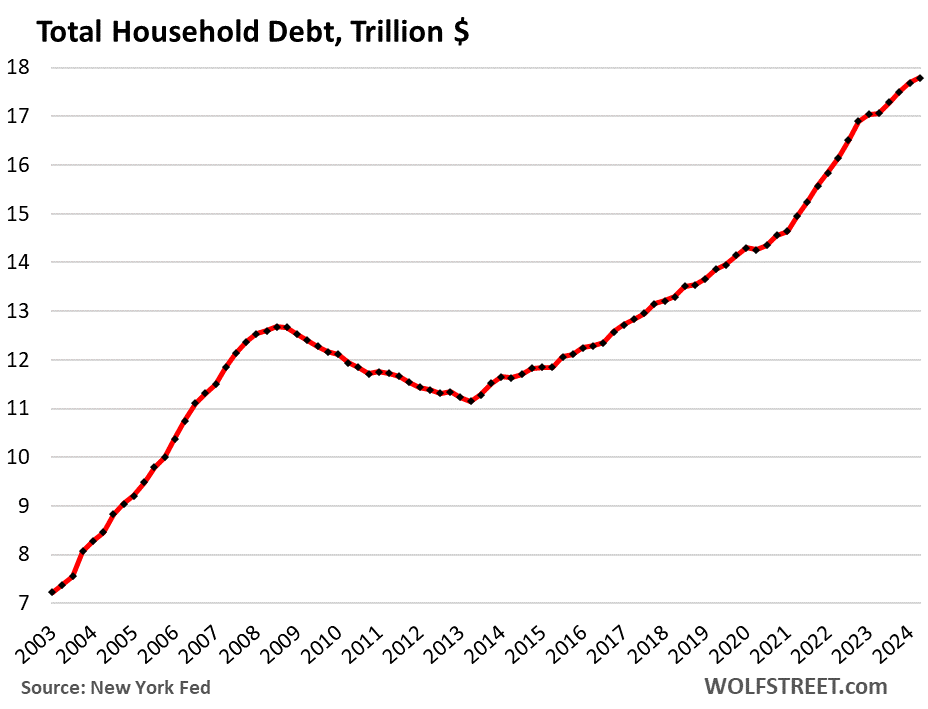
Total household debt outstanding in Q2 ticked up by $109 billion, or by 0.6%, from Q1 – the smallest percentage increase since Q2 2023, and the second smallest increase since Q1 2021 – to $17.8 trillion, according to the Household Debt and Credit Report from the New York Fed today. Year-over-year, total household debt grew by 4.3%.
Why the debt grows: Homes, vehicles, and many other things that people finance got more expensive over the many years — particularly, home prices have exploded over the years — driving up the amounts financed, and so overall debts grew.
In addition, the population grew over the many years, with more people getting mortgages and auto loans. So total amounts borrowed have risen over these years because a larger population is financing more costly collateral.
All categories except student loans increased quarter-to-quarter. Student loan balances dipped – not because borrowers were suddenly following a new religion of prudence and responsibility by paying down their loans faster than new borrowers were piling them on, but because the government forgave waves of loans and wrote them off at taxpayer expense:
Loan balances by category
Trillion $
QoQ %
YoY %
Total
$17.80
+0.6%
+4.3%
Mortgages
$12.52
+0.6%
+4.2%
HELOCs
$0.38
+1.1%
+11.8%
Auto
$1.63
+0.6%
+2.8%
Credit card
$1.14
+2.4%
+10.8%
Student loans
$1.59
-0.6%
+1.0%
Other
$0.54
+0.2%
+3.2%
The relative burden of household debt.
Households have to pay for this debt service from their income. One of the ways to measure the burden of debt is to compare the debt to the amount of income that is available to pay for debt service.
“Disposable income” has risen due to the growing population and higher wages. “Disposable income” is income from all sources but not capital gains; so income from wages, interest, dividends, rentals, farm income, small business income, transfer payments from the government, etc., minus taxes and social insurance payments. This is essentially the cash that consumers have available to spend on housing, food, cars, debt payments, etc. And what they don’t spend, they save.
Disposable income (according to data from the Bureau of Economic Analysis) grew by 0.9% in Q2 from the prior quarter. The total household debt grew by 0.6% in Q2. So the debt grew more slowly than income.
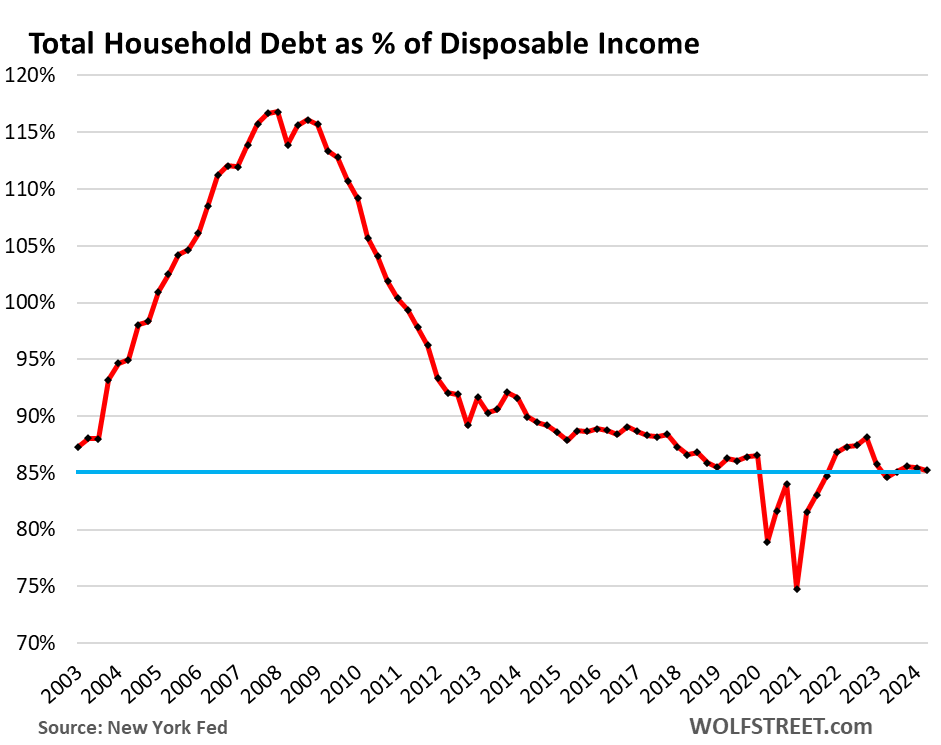
At $17.8 trillion, the debt amounts to 85.2% of disposable income, down a hair from the prior quarter (85.5%), and roughly unchanged over the past five quarters, and a historically low burden, bested only during the free-money-stimulus era which had inflated disposable income beyond recognition.
The chart also shows why households were hit so hard during the Financial Crisis that slammed them with an employment crisis as they had been heavily overindebted. That’s not the case anymore. Our Drunken Sailors learned a lesson?
Delinquencies still lower than normal, barely tick up.
Our Drunken Sailors, as we have come to call them lovingly and facetiously, have been sober enough to keep their balance sheets overall in good shape, with the debt burden moving along historically low levels.
A small portion of the people is always in trouble, subprime is always a factor, but subprime doesn’t mean “low income,” it means “bad credit,” and goes across the income spectrum. And there’s always some of it. And some people get into trouble, while other get out of trouble when they cure their credit problems. And it’s always in flux.
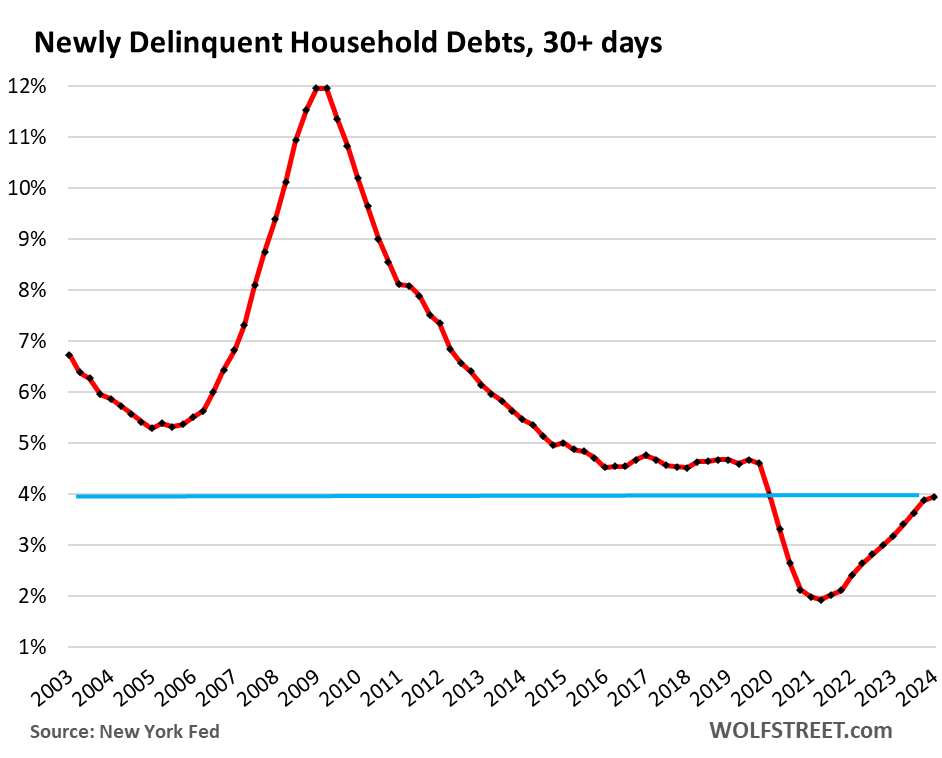
Newly delinquent: Household debts that were 30 days or more delinquent at the end of Q2 ticked up to 3.95%, from 3.88% of total debt balances — a minuscule increase that shows up in the flattening of the curve. The delinquency rate is still lower than any time before the pandemic.
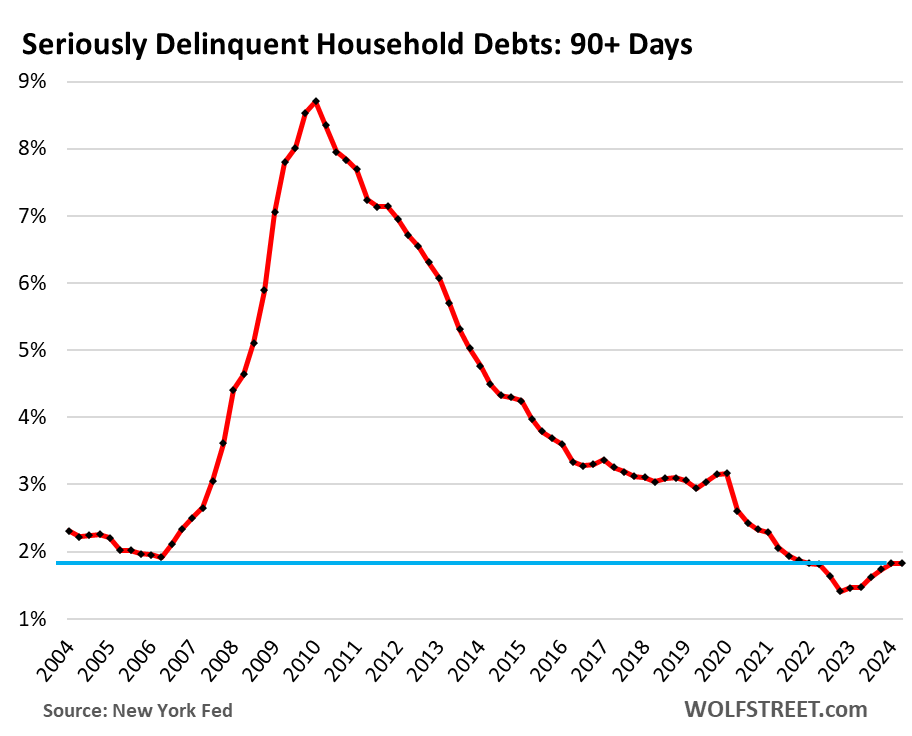
Serious delinquency: Household debts that were 90 days or more delinquent by the end of Q2 remained unchanged at a historically low 1.83% of total balances, still lower than any time before the free-money pandemic.
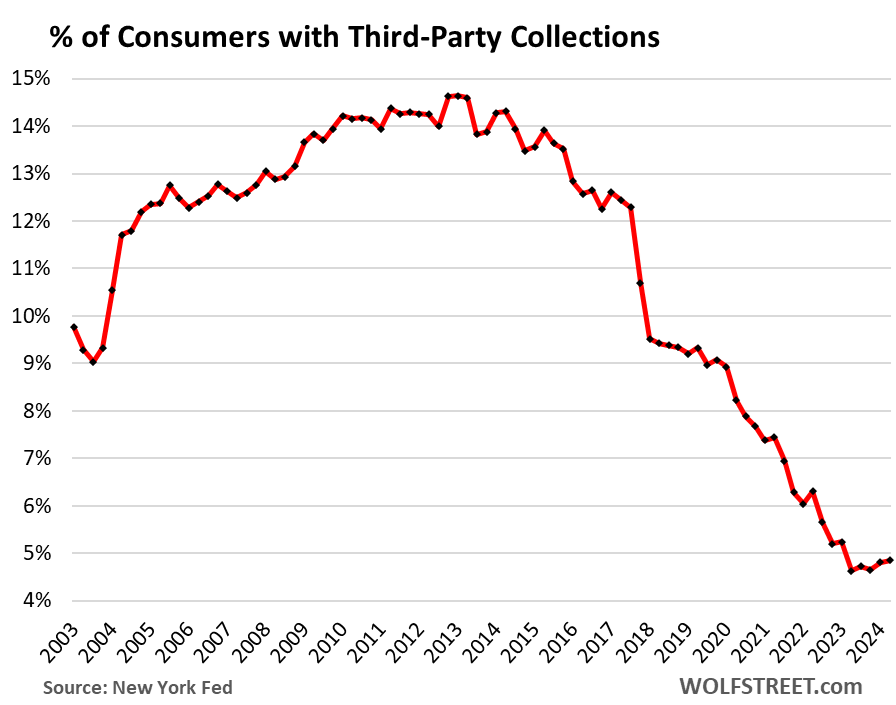
Consumers with third-party collections still near record lows.
A debt goes to a collection agency – the third party – after the lender has thrown in the towel on the delinquent loan, has written it off, and has sold the account for cents on the dollar to a company that specializes in hounding debtors to squeeze some money out of them.
The percentage of consumers with third-party collections inched up to 4.85% in Q2 from 4.81% in Q1. This chart is almost funny:
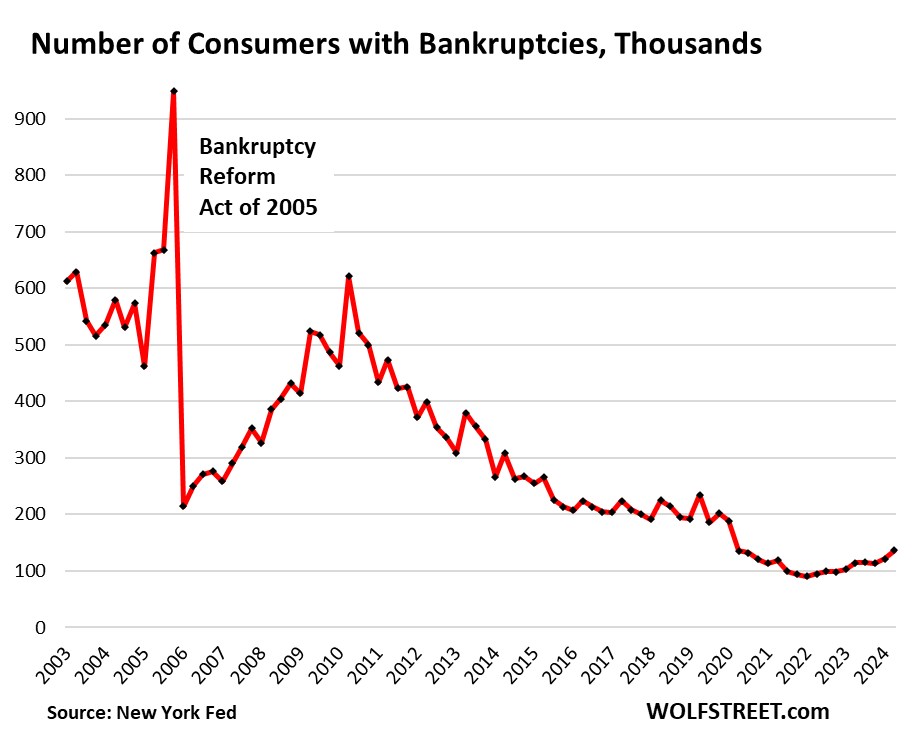
Consumers with bankruptcies still near record lows.
The number of consumers with bankruptcy filings are easing up from the historic bottom, and are still far below prepandemic normal. In Q2, there were 136,180 consumers with bankruptcy filings. By comparison, in Q2 2019, there were 234,280 consumers with bankruptcy filings – and that too had been relatively low historically:
We’re going to dive into the details shortly with separate articles for housing debt, credit card debt, and auto debt and their respective delinquencies. So stay tuned.
Enjoy reading WOLF STREET and want to support it? You can donate. I appreciate it immensely. Click on the beer and iced-tea mug to find out how:
Would you like to be notified via email when WOLF STREET publishes a new article? Sign up here.
Take the Survey at https://survey.energynewsbeat.com/