Reserves, Domestic ON RRPs, Currency in Circulation, the TGA, and official foreign RRPs determine how far QT can go.
By Wolf Richter for WOLF STREET.
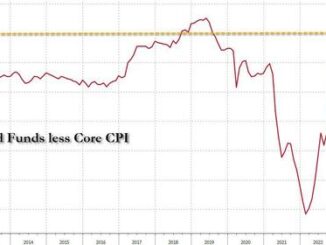
The Fed has been talking a lot about its liabilities recently, including Powell at the FOMC press conference the other day, the FOMC members as reported in the meeting minutes, and in speeches Fed governor Chris Waller and Dallas Fed president Lori Logan. The discussions have centered on how to get to the smallest possible balance sheet. And it’s the liabilities that determine how far QT can drive down the balance sheet’s assets.
During periods of QE, the balance sheet is driven by the assets that the Fed buys, which inflate its liabilities in equal amounts.
During QT, it’s the liabilities that determine how far the balance sheet can theoretically drop – the lowest theoretically possible level – which is now the red-hot topic because the Fed doesn’t know either. But as Powell said, the Fed needs to be careful as it gets closer to that point, wherever it is, because stuff happens when it gets below that point. The issue are reserves.
Liabilities represent liquidity of others in the market. They’re cash that the Fed owes others. Two of them represent liquidity that banks (reserves) and money market funds and other entities (ON RRPs) have stashed at the Fed, and those two are now being drained by QT. The other three are independent of QT.
Total liabilities: $7.47 trillion, down by $1.45 trillion from the peak in April 2022.
Every balance sheet, including the Fed’s, has to balance (Asset = Liabilities + Capital). The Fed’s capital is set by Congress. So for every dollar that assets decline, liabilities must also decline by a dollar. And so far, QT pushed down both assets and liabilities by $1.45 trillion from the peak in April 2022.
The big five liabilities. We split RRPs into two separate parts because they’re so different: ON RRPs with domestic counterparties (#2), and RRPs with foreign official counterparties (#5).
Reserves (cash that banks deposit at the Fed)
Overnight reverse repurchase agreements (ON RRPs) with domestic counterparties (cash from money market funds and other domestic entities)
Currency in circulation (paper dollars in pockets and under mattresses globally)
Treasury General Account (TGA), the government’s checking account
Reverse repurchase agreements with foreign official counterparties.
The two liabilities that are reduced by QT: Reserves and ON RRPs.
Reserves: $3.55 trillion, -$722 billion since Dec 2021 peak. Reserves are instant liquidity in the banking system. Since the last rate hike in July, the Fed has been paying banks 5.4% in interest on their reserve balances. For banks, on their balance sheets, reserves are “interest-earning cash” or similar.
QT is draining liquidity from the financial system, and reserves are one place where the drainage shows up.
Reserves are what the Fed looks at to determine how far it can take QT. Toward the end of QT-1, reserve balances dropped so low (below $1.4 trillion) that banks stopped lending to the repo market, even as repo rates began to rise sharply and it would have been profitable for banks to lend. And so the $5-trillion repo market blew out, and the Fed ended up stepping in to douse the panic.
So $1.4 trillion back in 2019 was too low. This time around the lowest level will be higher since everything has grown, and Powell has said that no one knows what that level will be, but they will keep their eyes out for signs that they’re approaching that level.
Note the sharp drop in reserves from December 2021 (QT started in July 2022) until the March 2023 bank panic, after which cash started flowing back into reserves.
This time around, the Fed intends to be smart about it. In July 2021, it put back in place its old Standing Repo Facility that it had killed in 2009 during QE. And it will eventually reduce the pace of QT so that it can approach the lowest possible level of reserves slowly, and back off before it gets there, rather than bumble into it and watch something blow up.
Banks use their reserve accounts at the Fed to transfer cash between banks; every transaction between two banks goes through their reserve accounts, with every bank paying every bank and getting paid by every bank once every day. These reserves are not a static inventory of cash, but a huge daily churn between banks.
ON RRPs: $496 billion, -1.87 trillion from peak. The Fed offers overnight reverse repos (ON RRPs) to domestic counterparties, mostly money market funds. But other approved counterparties are the banks, government-sponsored enterprises (Fannie Mae, Freddie Mac, etc.), the Federal Home Loan Banks, etc. These entities use RRPs to park excess cash at the Fed and collect 5.3% in interest.
ON RRPs represent excess liquidity that money markets don’t know what to do with. ON RRPs have existed for decades, but in normal times, they’re zero or near zero. It’s only in the later stages of QE through early QT that the balances balloon as excess liquidity is everywhere. And now they’re going back to zero, which is their normal state.
The liabilities that are not reduced by QT: Currency in circulation, the TGA, and foreign official RRPs.
Currency in circulation: $2.34 trillion. Currency in circulation reflects the paper dollars – officially, “Federal Reserve Notes” – In wallets under mattresses in the US and globally. Demand for Federal Reserve Notes soars during uncertain times, such as Y2K (will the ATMs work on January 1, 2000?), the months following the Lehman bankruptcy, and Covid.
The amount of currency in circulation is demand-based through the US banking system. If customers demand paper dollars, the banking system must have enough on hand. Foreign banks have relationships with US banks to get paper dollars for their customers.
Banks get those paper dollars from the Fed in exchange for collateral, such as Treasury securities, which are assets on the Fed’s balance sheet.
So every dollar of currency must be counterbalanced by a dollar in assets. As currency grows, so do assets. That has always been that way. Before QE, currency in circulation was the primary driver of the size of the Fed’s balance sheet. So the Fed’s balance sheet can never fall below the level of currency in circulation.
Currency in circulation has roughly flatlined since July 2023 at around $2.34 trillion. It is very unusual for currency to flatline for so long, it normally just grows. But maybe higher T-bill rates are persuading some holders to deposit their paper dollars in the bank and buy T-bills with them to earn 5.3%, rather than nothing.
Treasury General Account (TGA): $813 billion. The Treasury Department’s checking account at the New York Fed has massive inflows from debt sales, taxes, fees, etc., and massive outflows to pay for the actual government spending every day. The amount in the TGA is a liability for the Fed – money that the Fed owes the government.
During periods when debt sales are limited by a debt-ceiling fight in Congress, the TGA gets drawn down to very low levels. After the debt ceiling fight is resolved, the government issues a lot of T-bills quickly to bring the TGA back up to operational levels.
So account balances are not influenced by QT or QE, but by the Treasury Departments management of the government’s finances.
RRPs with foreign official counterparties: $349 billion. The Fed also offers reverse repurchase agreements to “foreign official” accounts, where other central banks can park their dollar cash. The account balances are determined by decisions of foreign central banks and are not a result of QE or QT.
The chart shows both, ON RRPs with domestic counterparties (red) and RRPs with foreign official accounts (blue). ON RRPs will go to zero; foreign official RRPs will not go to zero, but will likely remain near the recent range.
The “lowest possible level” of the Fed’s balance sheet in 2026?
No one knows, not even Fed, but here is our guess: $5.8 trillion, limited by the liabilities.
The minimum balance sheet level is determined by the liabilities. In the current setup at the Fed of “ample reserves,” it’s the reserve balances that the Fed will watch. If reserve balances drop too low, as they did in 2019, bad things can happen. Let’s say this theoretically lowest possible level of ample reserves is $2 trillion in two years. Add a little margin of safety, so maybe $2.2 trillion.
In this scenario, this lowest possible level of the balance sheet in this scenario would be $5.8 trillion, below which the balance sheet cannot decline without something blowing up:
$2.2 trillion reserves
$0 ON RRPs
$2.38 trillion currency in circulation, tends to grow over the years.
$900 billion TGA
$350 billion foreign official RRPs.
Realistically speaking, getting the balance sheet close to $6 trillion by the end of 2026, so shedding another $1.5 trillion, after the $1.45 trillion that have already been shed, will be a big improvement, meaning that the Fed’s balance sheet will by then have shed about $3 trillion, assuming that nothing blows up along the way.
Enjoy reading WOLF STREET and want to support it? You can donate. I appreciate it immensely. Click on the beer and iced-tea mug to find out how:
Would you like to be notified via email when WOLF STREET publishes a new article? Sign up here.