19 are below their 2022 peaks: Austin -20%, San Francisco -10%, Phoenix -8%, San Antonio -7%, Denver -7%, Salt Lake City -6%, Sacramento -6%, Portland -5%, Dallas -5%, Seattle -5%, Honolulu -4%…
By Wolf Richter for WOLF STREET.
The mix that drives the housing market now: Lowest demand since 1995 and surging supply of existing homes, as buyers are on strike because prices are too high. Active listings have been surging all year in just about every major market, including in formerly hot markets such as Florida and in Texas where they reached the highest level since at least 2016. In addition, since the first rate cut, mortgage rates have risen back to around 7%.
Homebuilders have been taking market share from sales of existing homes by lowering their price points, buying down mortgage rates, and throwing incentives into the mix, to where payments on a new house are below payments on an equivalent existing house. And facing ballooning inventories of unsold houses, they continue to aggressively price their inventory and motivate buyers with big incentives. They’re making deals and are absorbing demand that would have gone to existing home sellers, and their sales have held up.
And renting has become a far cheaper solution than buying in recent years, after the spike in prices and the surge in mortgage rates, homeowners’ insurance, property taxes, and maintenance expenses. More and more people who could buy are renting, or are planning to rent when they move the next time; they’re profiting from an arbitrage between two similar products with very different prices, in some metros saving thousands of dollars a month by renting an equivalent home. And this too contributes to the large-scale decline in demand in the purchase market.
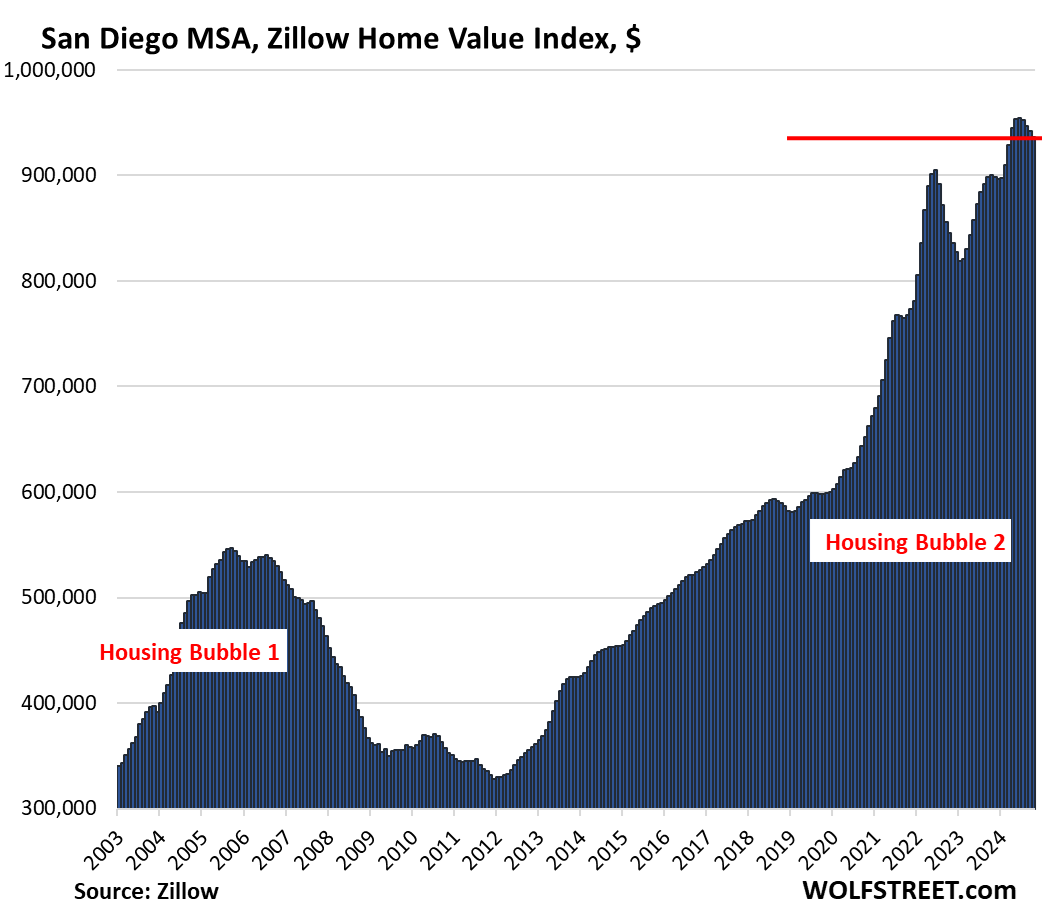
With these dynamics, prices in many major metros, even in markets such as San Diego, have started to sag.
Price declines from prior month: Prices of single-family houses, condos, and co-ops fell in October from September in 29 of the 30 large metros here.
Seasonal, you say? The charts below for each of the 30 markets show that in many markets, there has been nothing seasonal for years – seasonal price changes must happen in a similar way the same months every year, or they’re not seasonal. But in some markets, there is clearly some seasonality.
By Metropolitan Statistical Area (MSA), the top month-to-month price declines:
- Austin: -1.0%
- San Francisco: -0.6%
- Tampa: -0.7%
- San Antonio: -0.7%
- Dallas: -0.7%
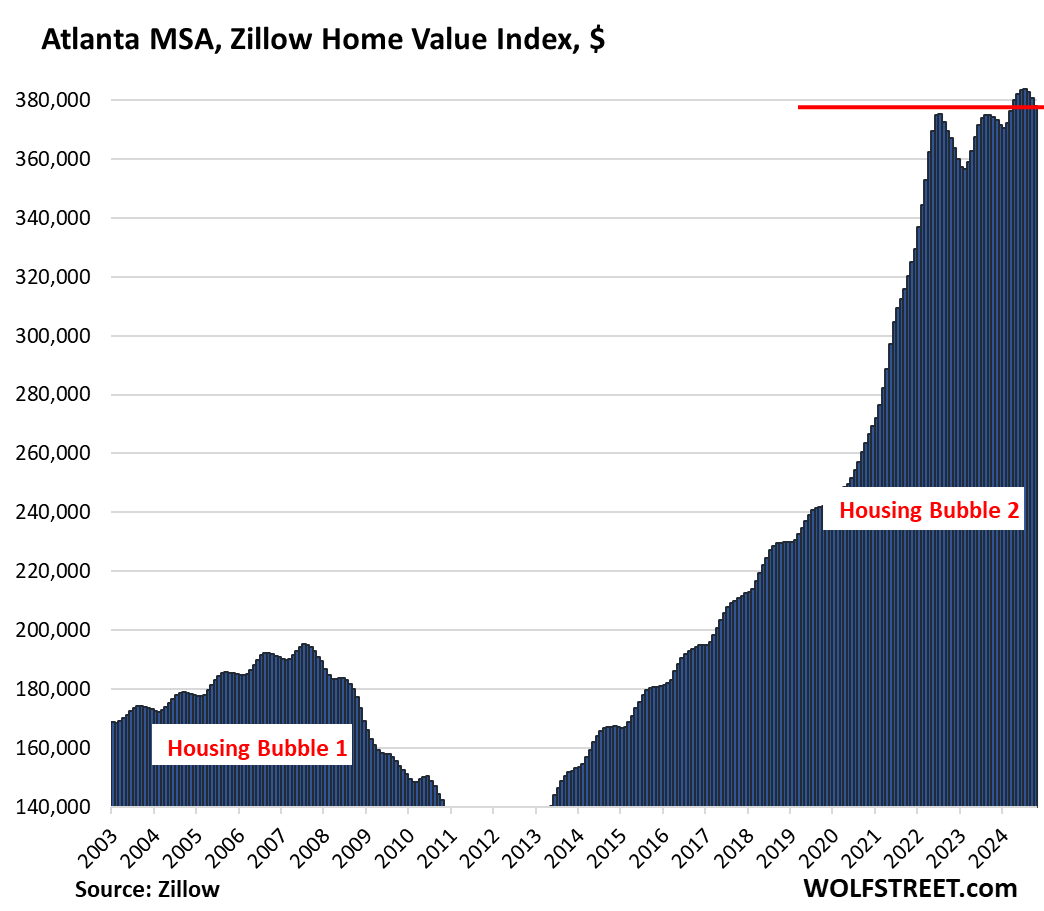
- Atlanta: -0.7%
- Denver: -0.6%
- San Diego: -0.6%
- Houston: -0.6%
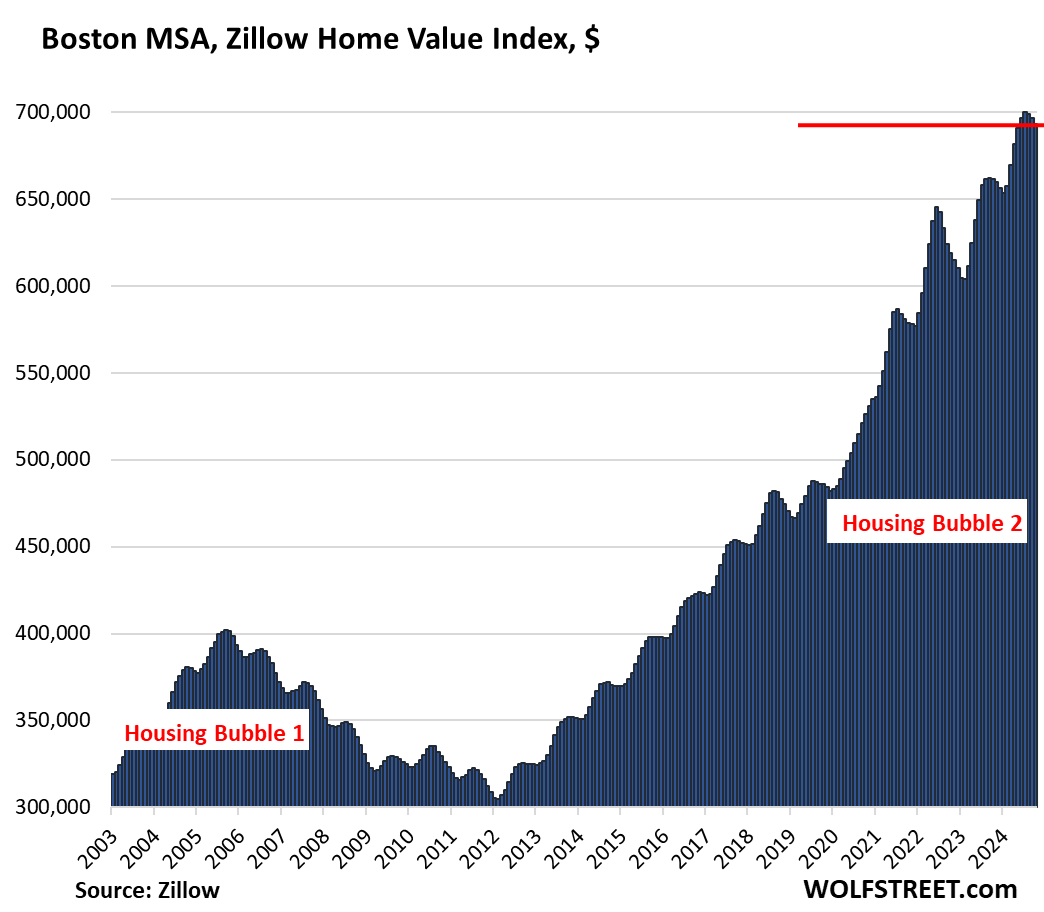
- Boston: -0.5%
- Phoenix: -0.4%
- Sacramento: -0.4%
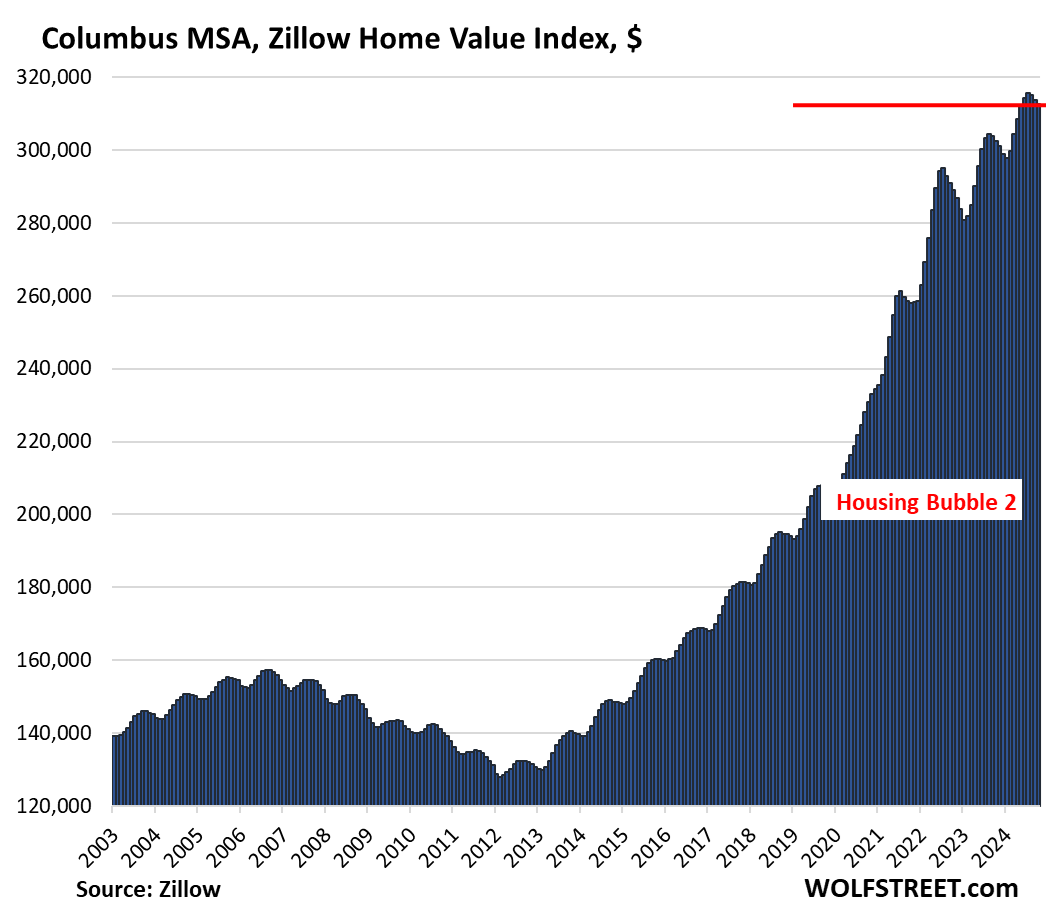
- Columbus: -0.4%
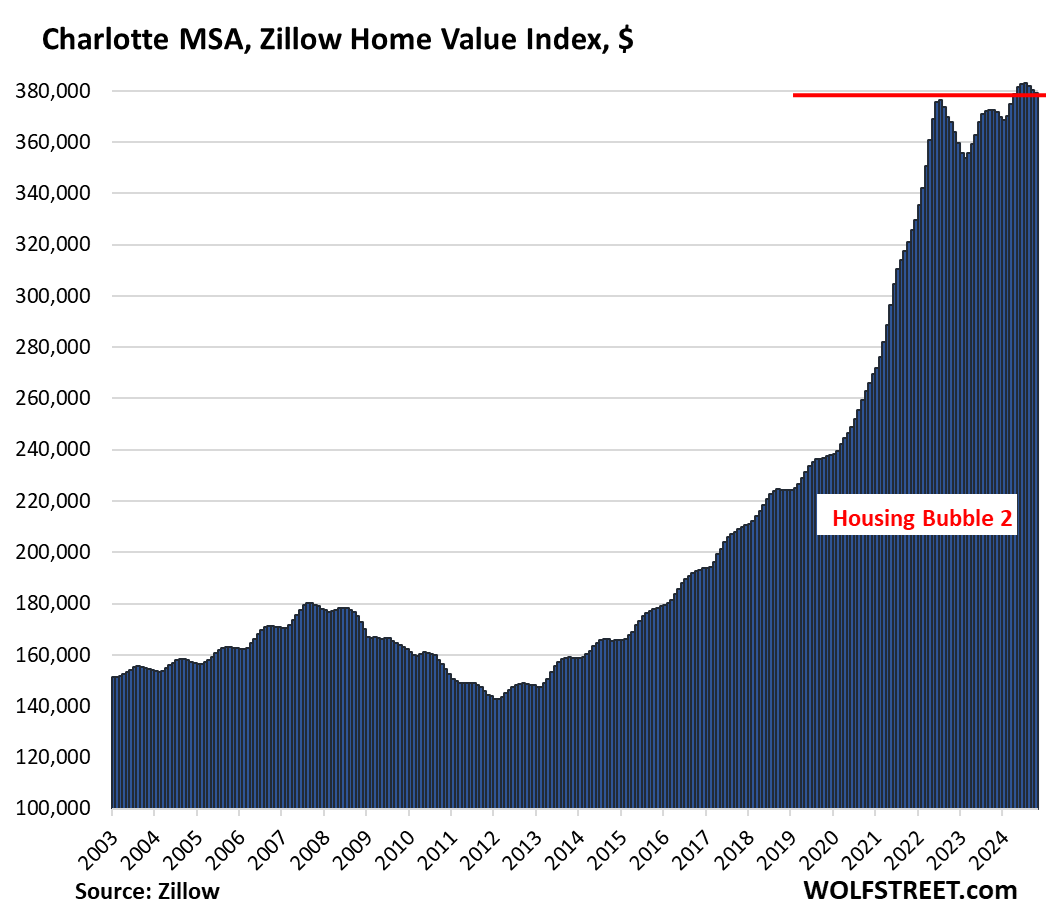
- Charlotte: -0.4%
- Portland: -0.3%
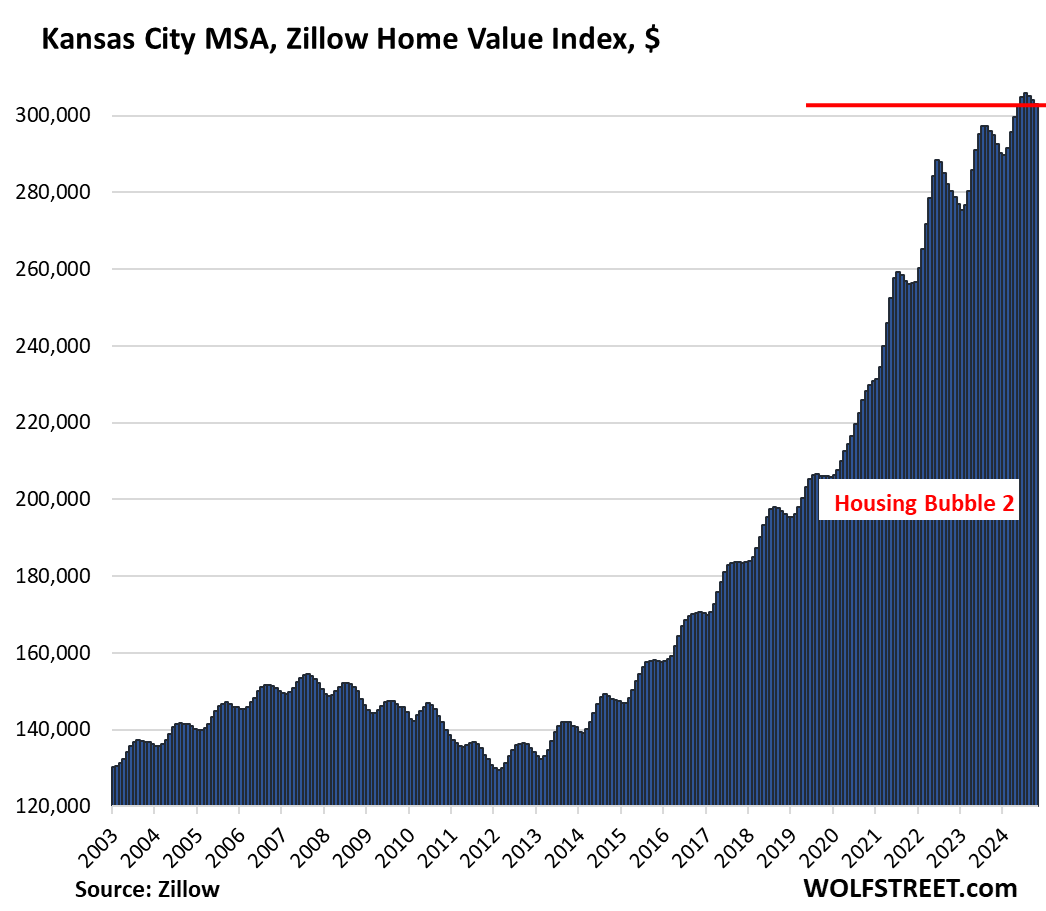
- Kansas City: -0.3%
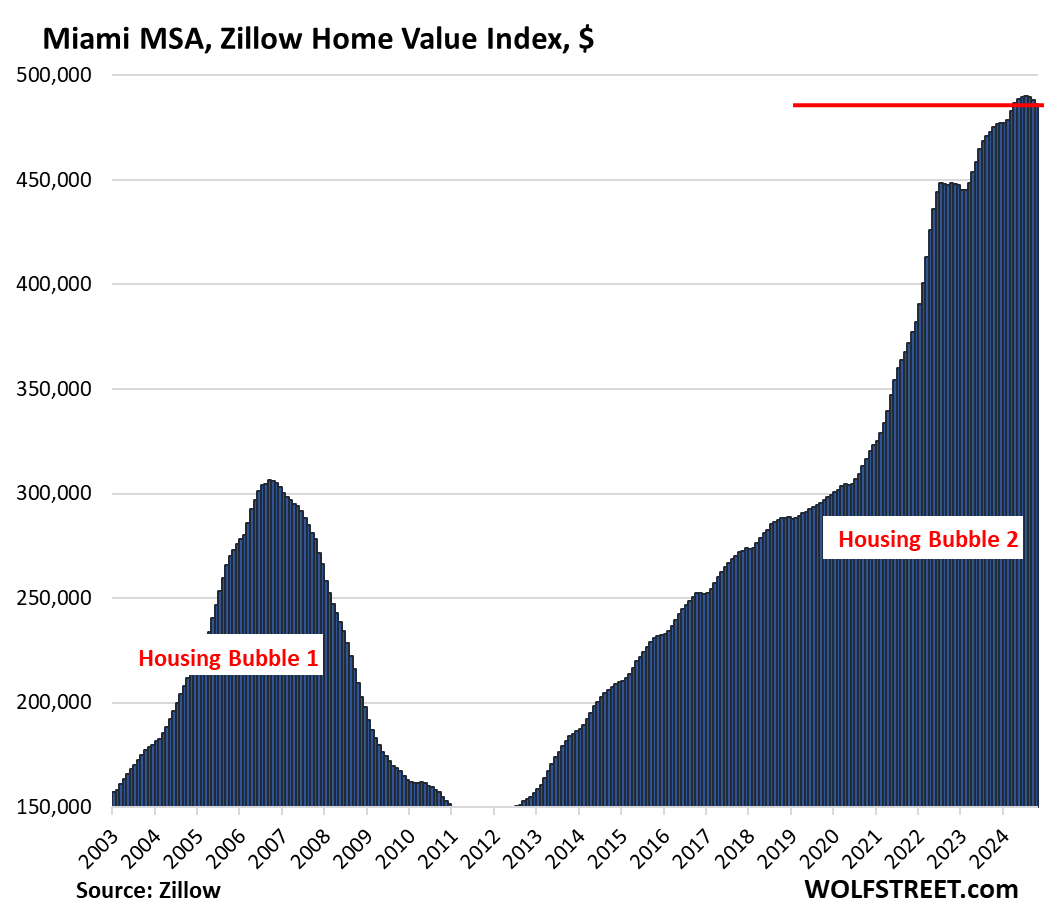
- Miami: -0.3%
- Seattle: -0.3%
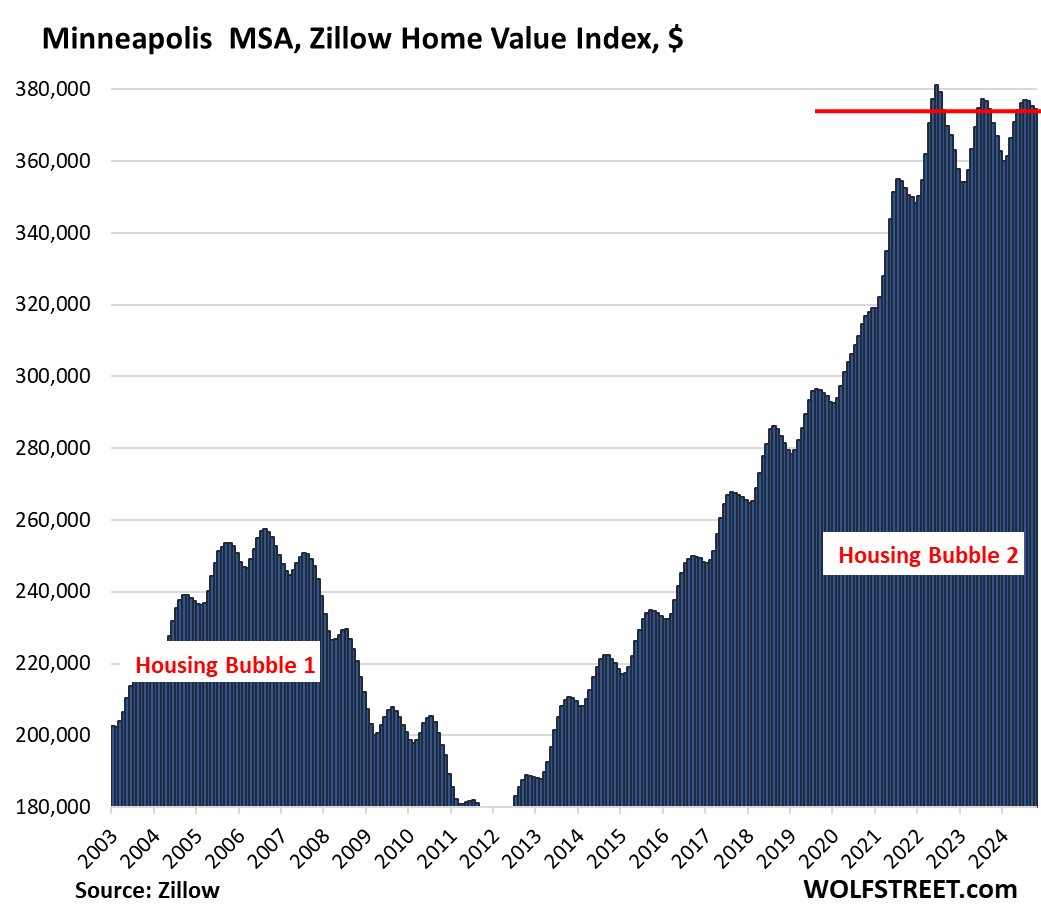
- Minneapolis: -0.3%
- Nashville: -0.3%
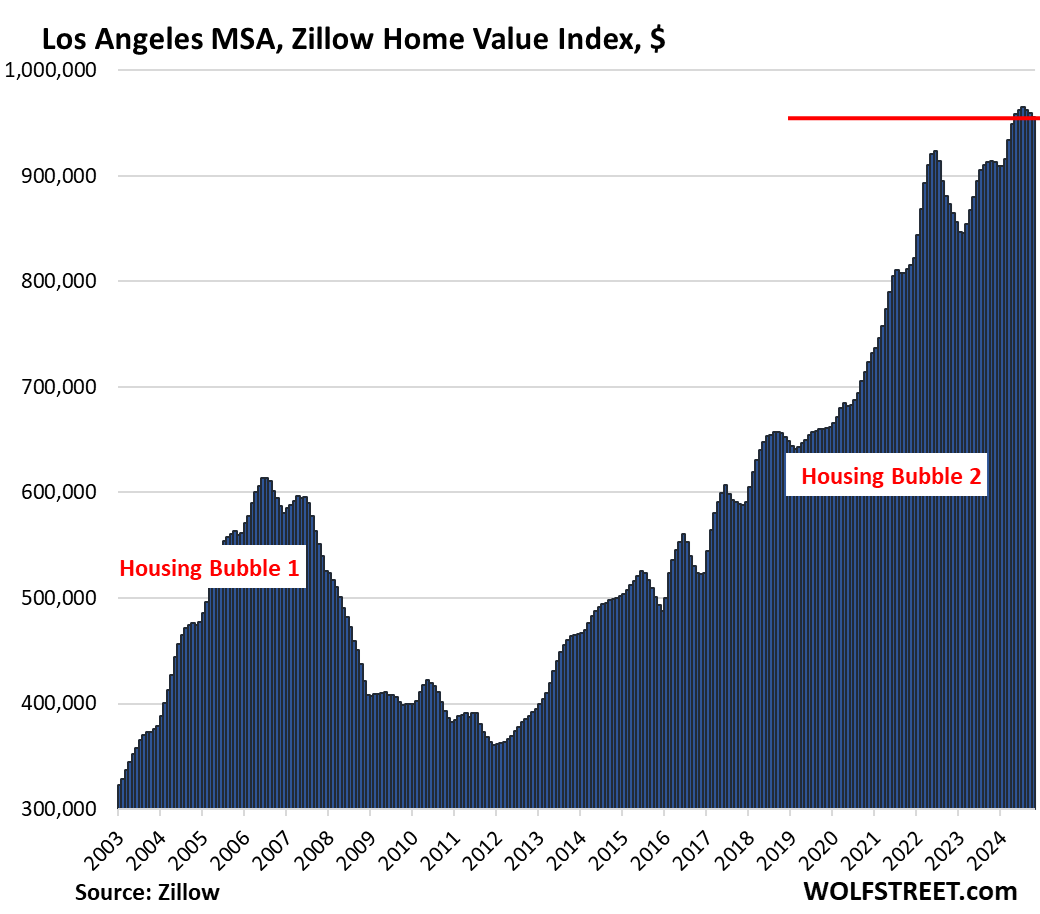
- Los Angeles: -0.3%
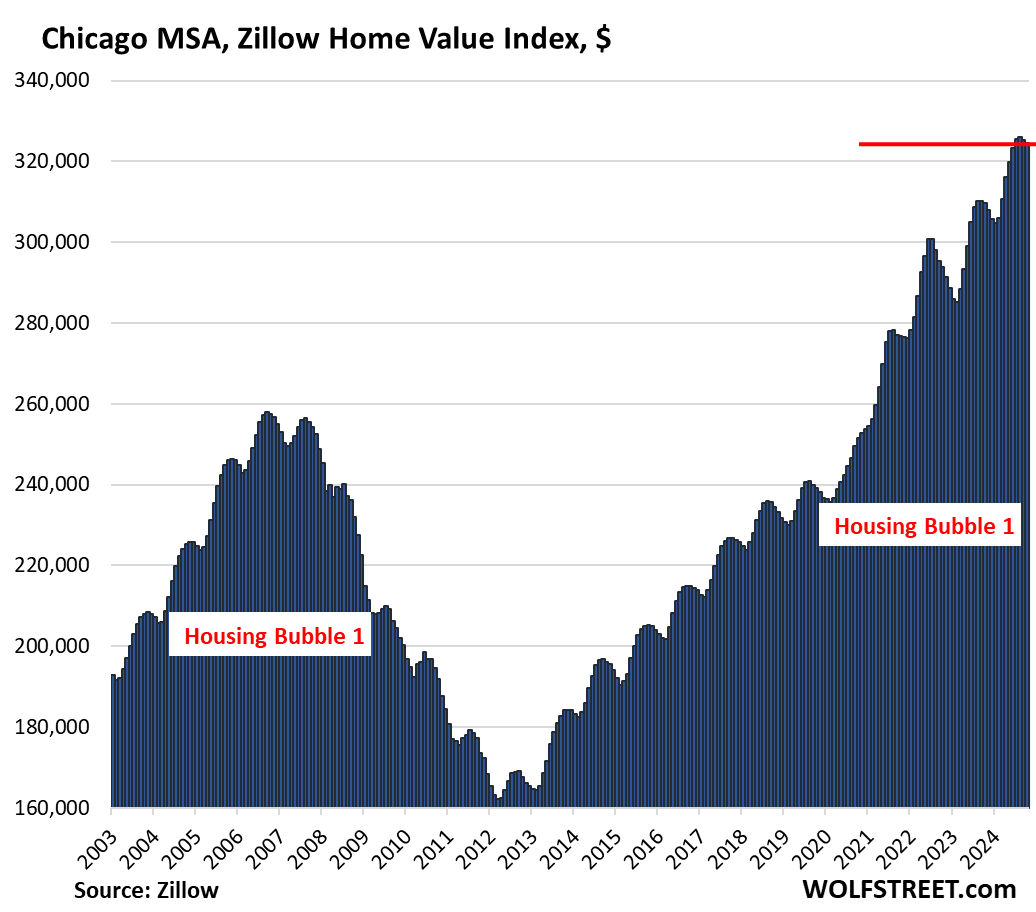
- Chicago: -0.3%
Down from their 2022 peaks: Home prices in 19 of the 30 MSAs here were down from their respective peaks in mid-2022, so roughly from 27 to 28 months ago, led by these 14:
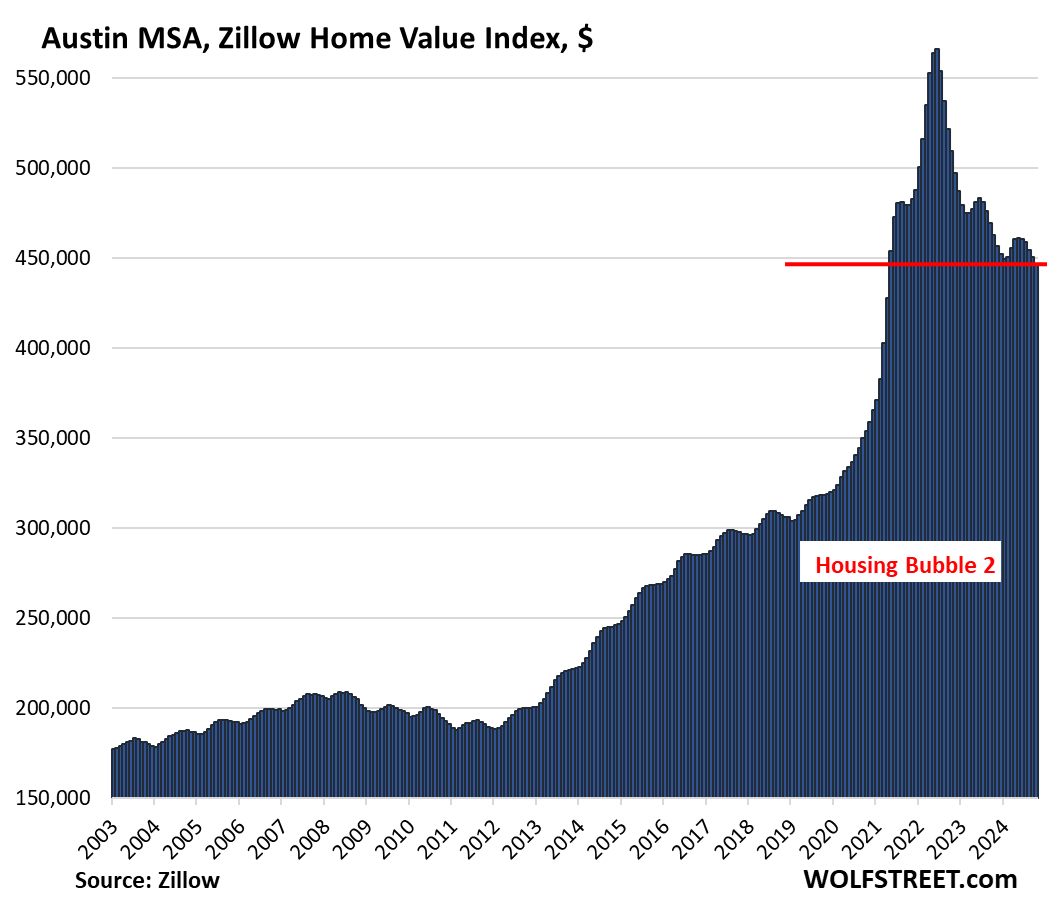
- Austin: -20.4%
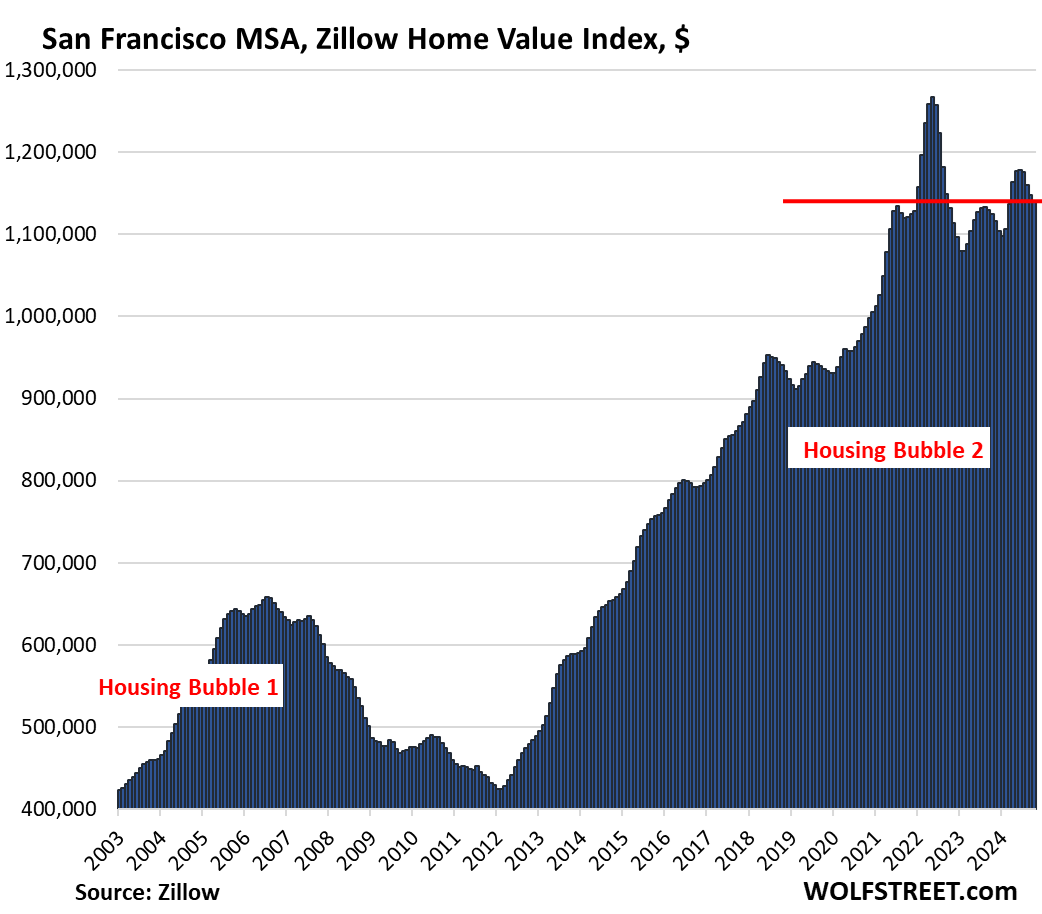
- San Francisco: -10.0%
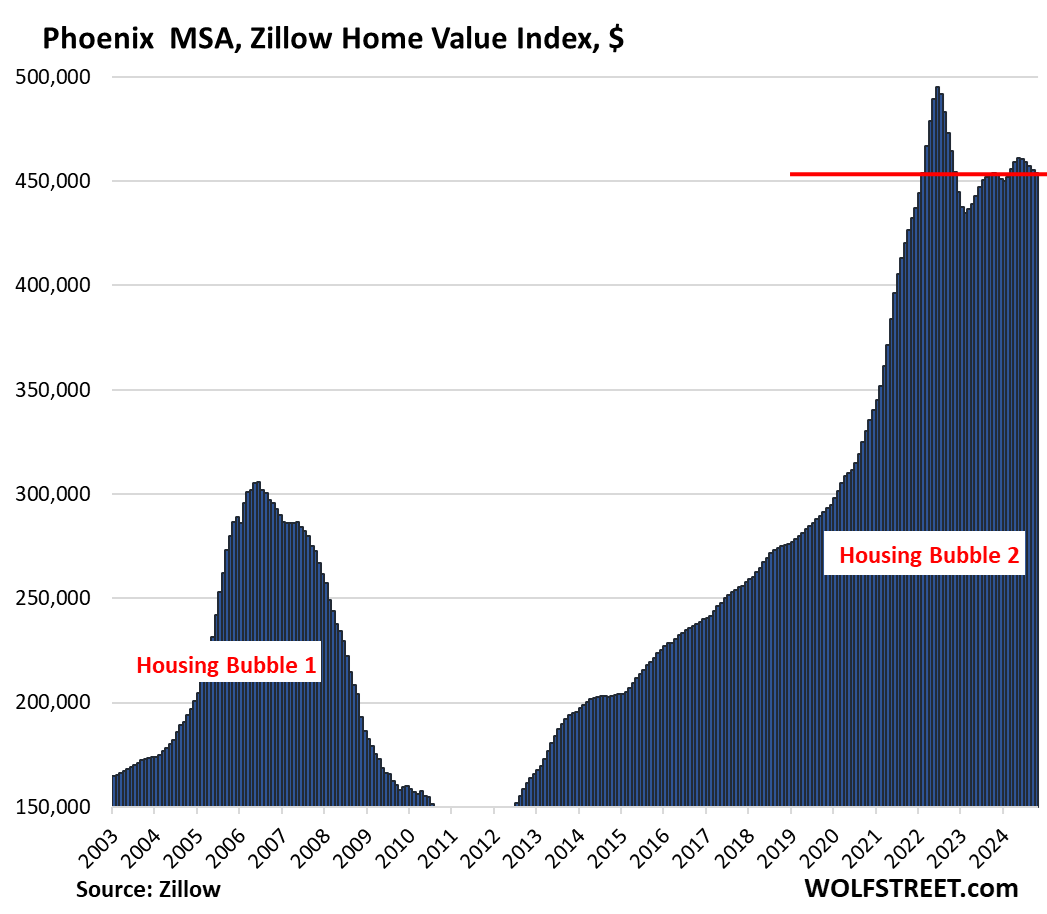
- Phoenix: -8.3%
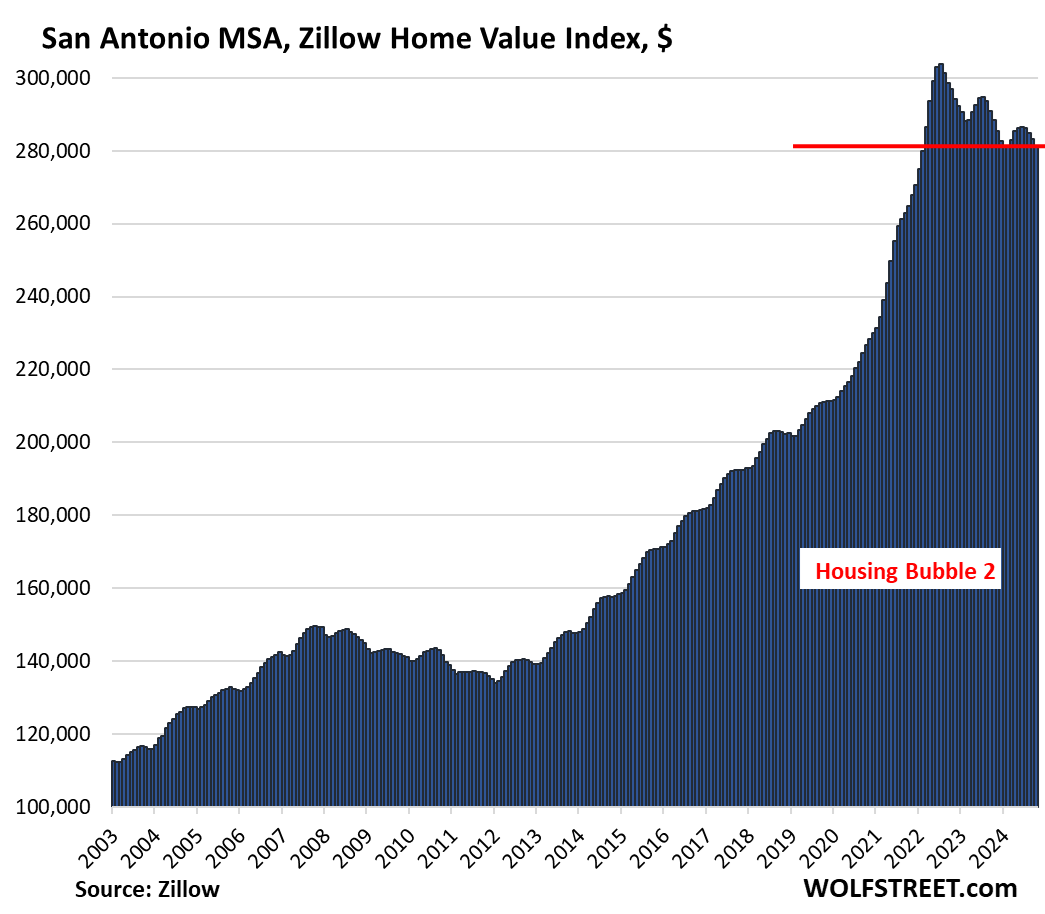
- San Antonio: -7.5%
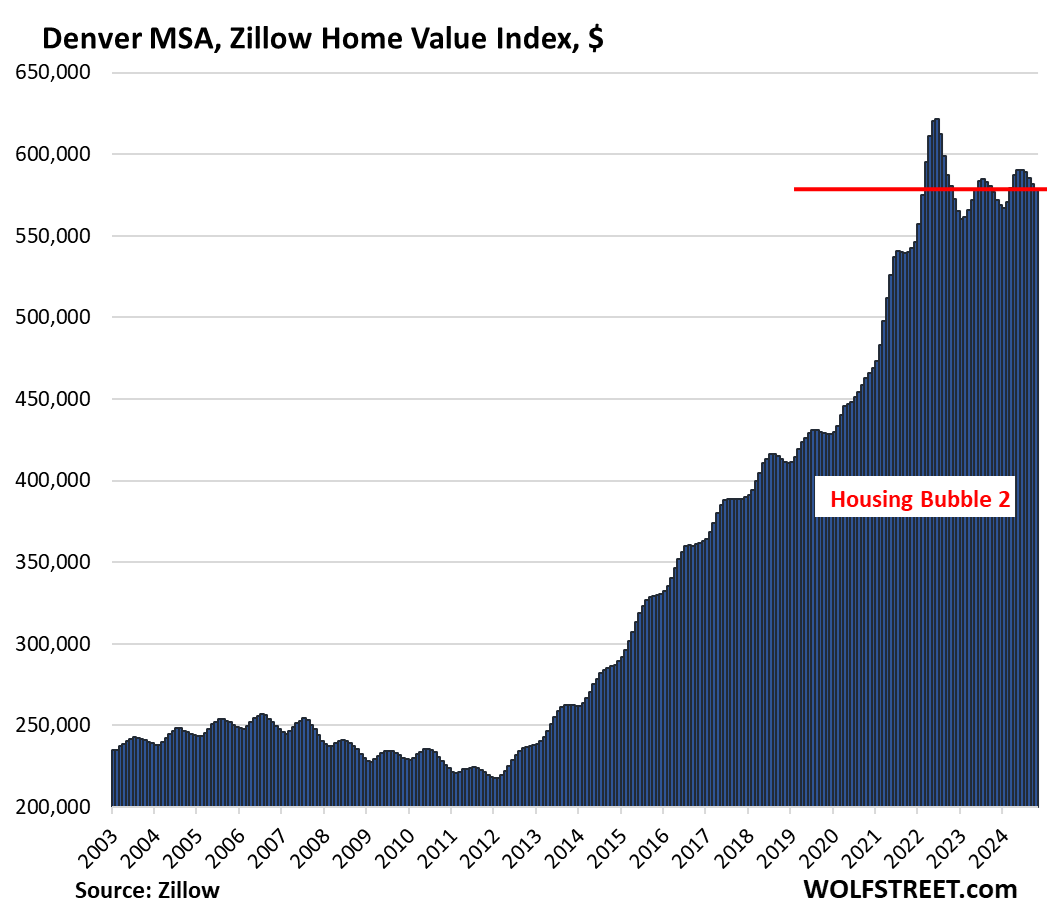
- Denver: -6.9%
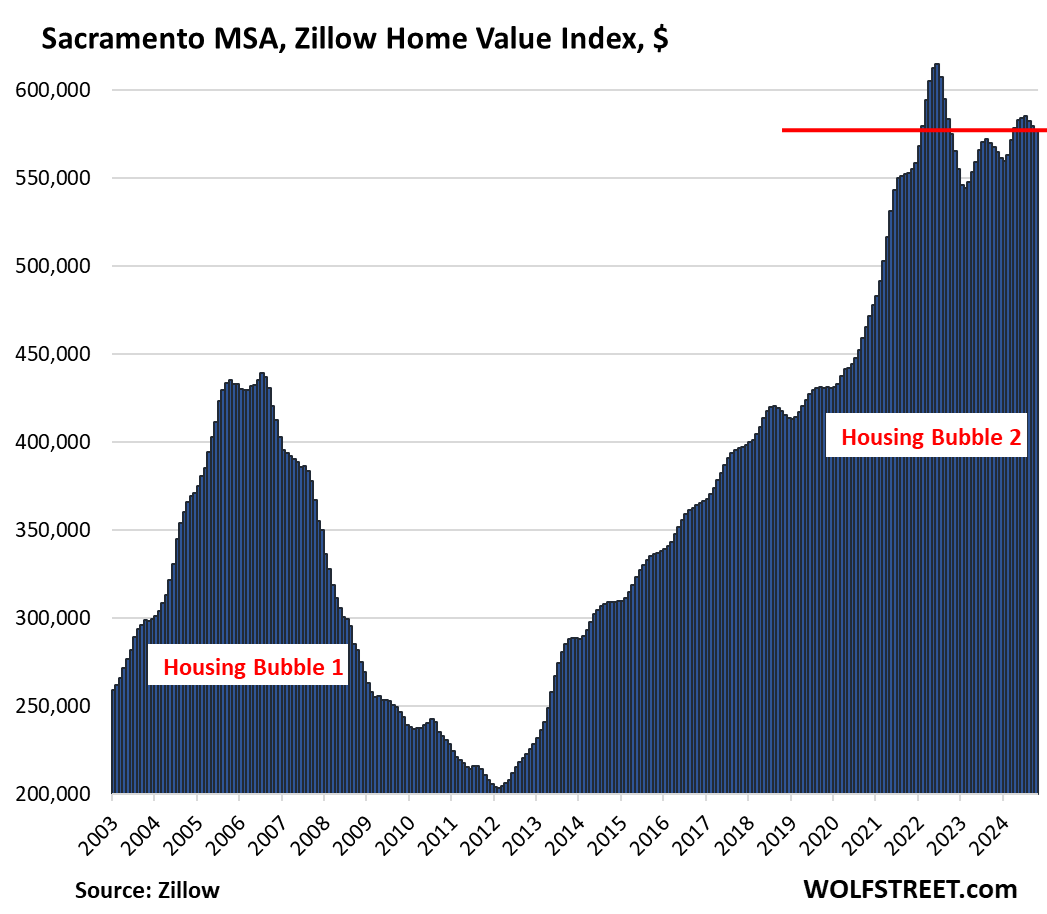
- Sacramento: -6.0%
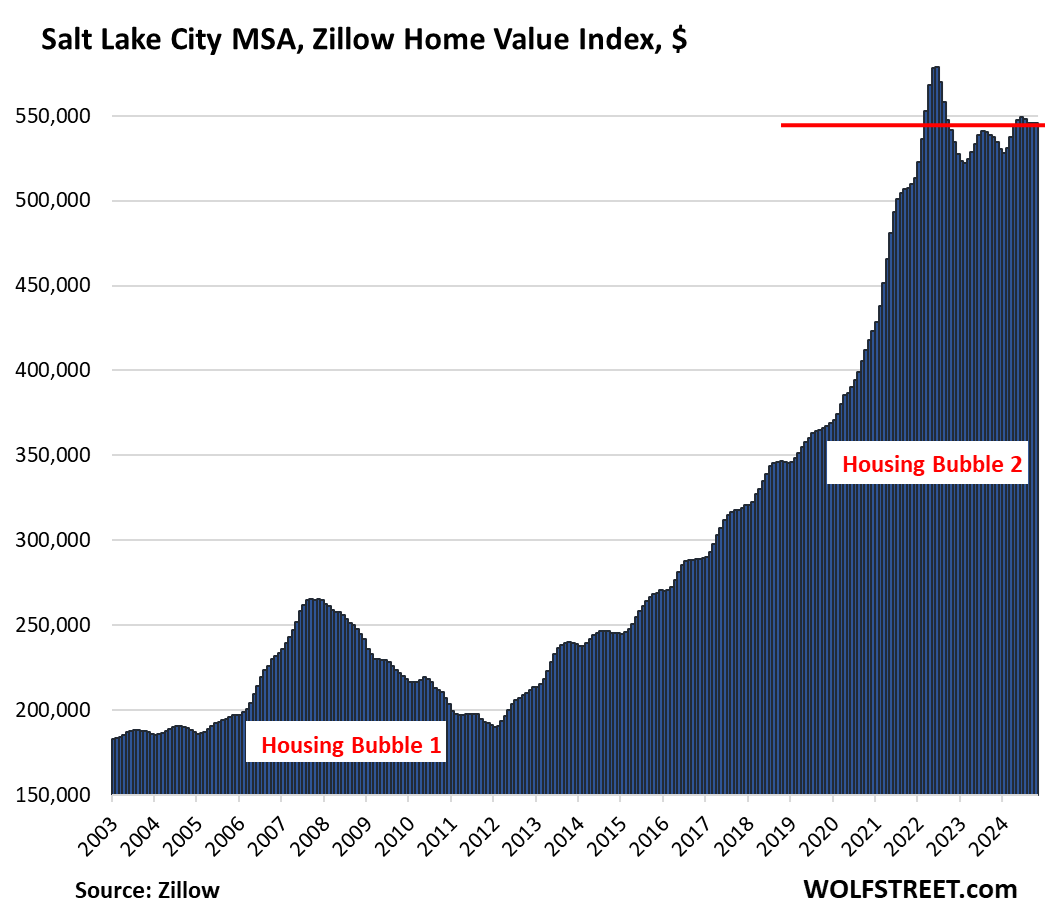
- Salt Lake City: -5.7%
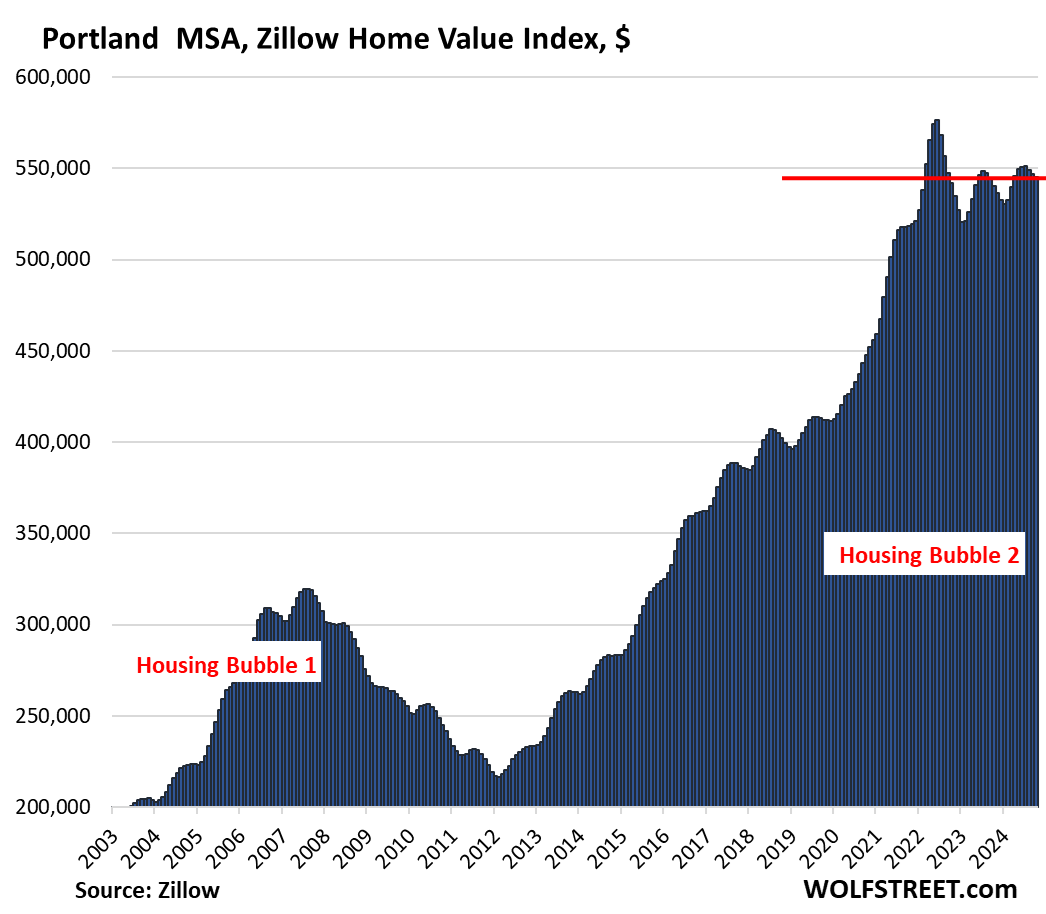
- Portland: -5.4%
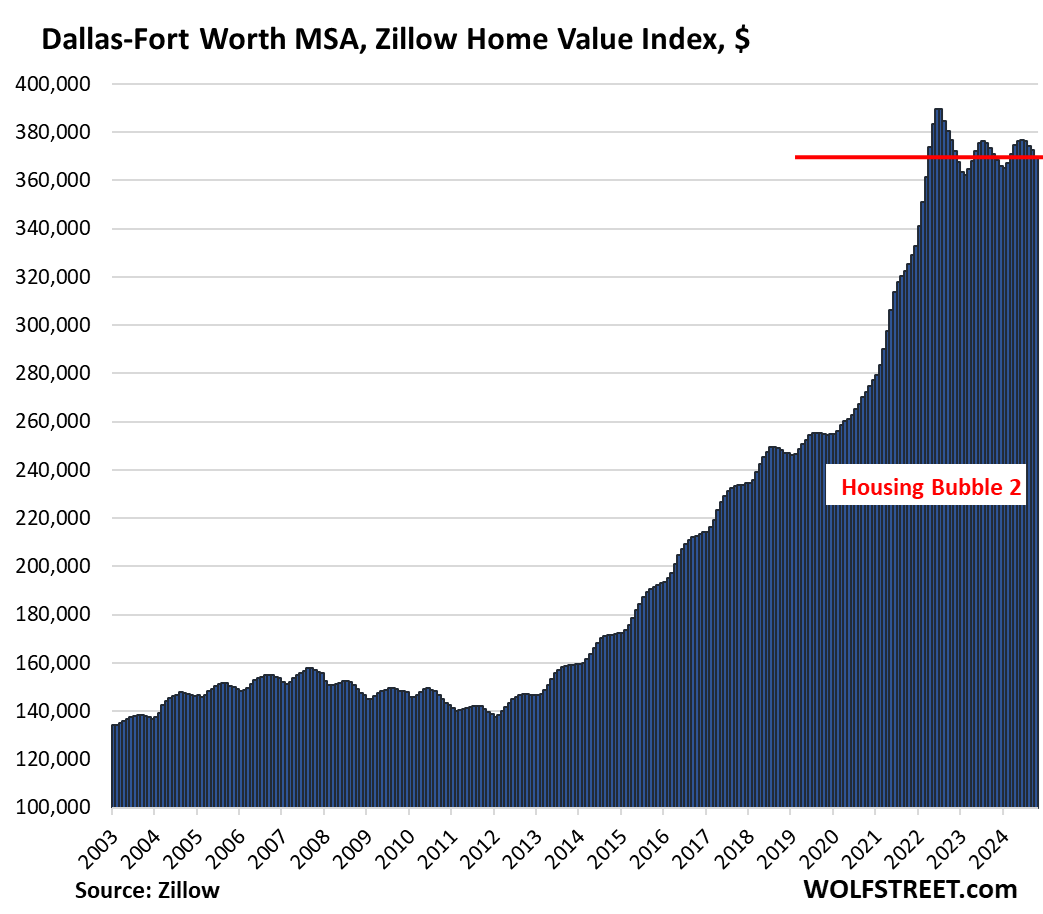
- Dallas: -5.0%
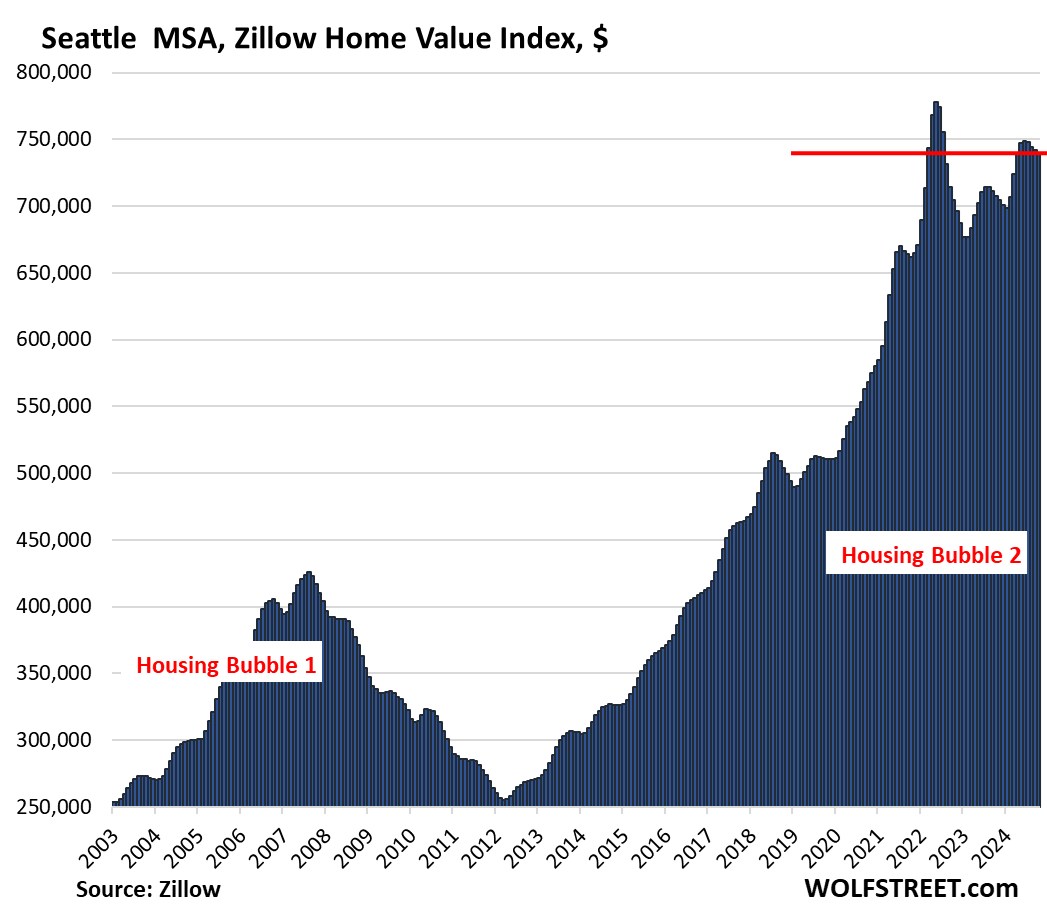
- Seattle: -4.9%
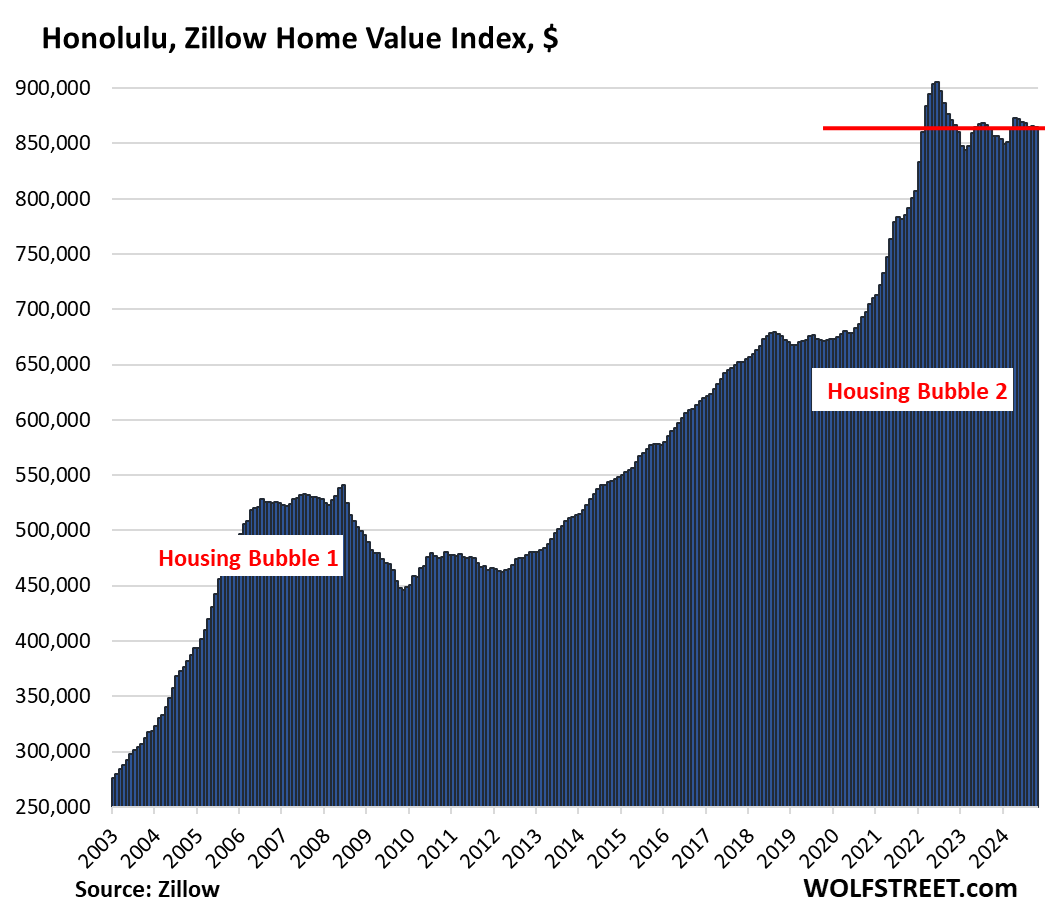
- Honolulu: -4.5%
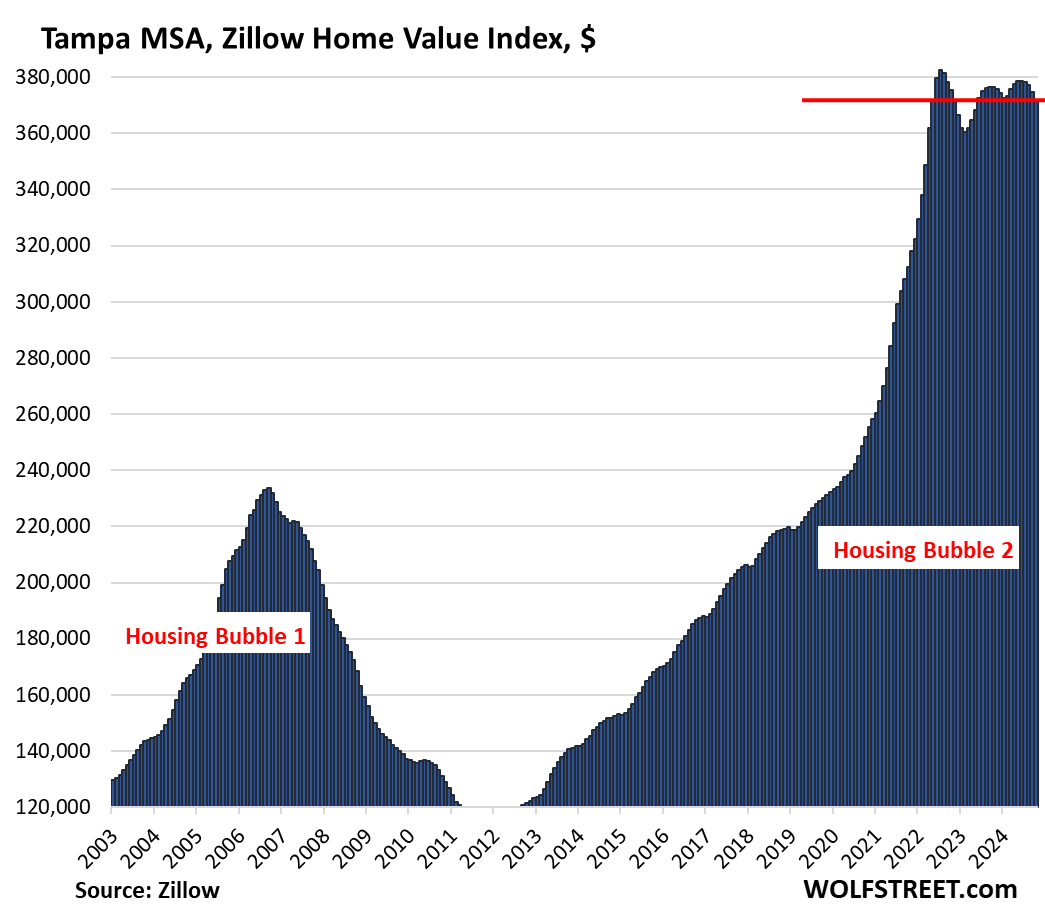
- Tampa: -2.8%
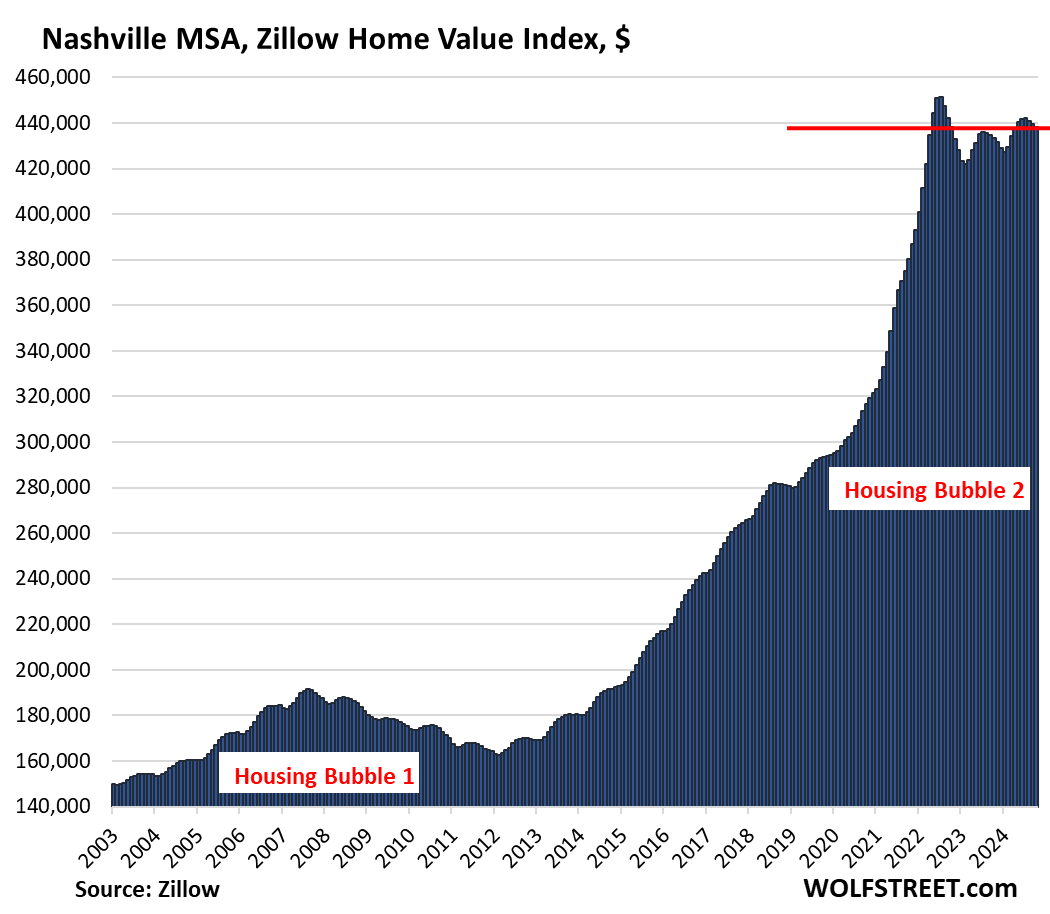
- Nashville: -2.6%
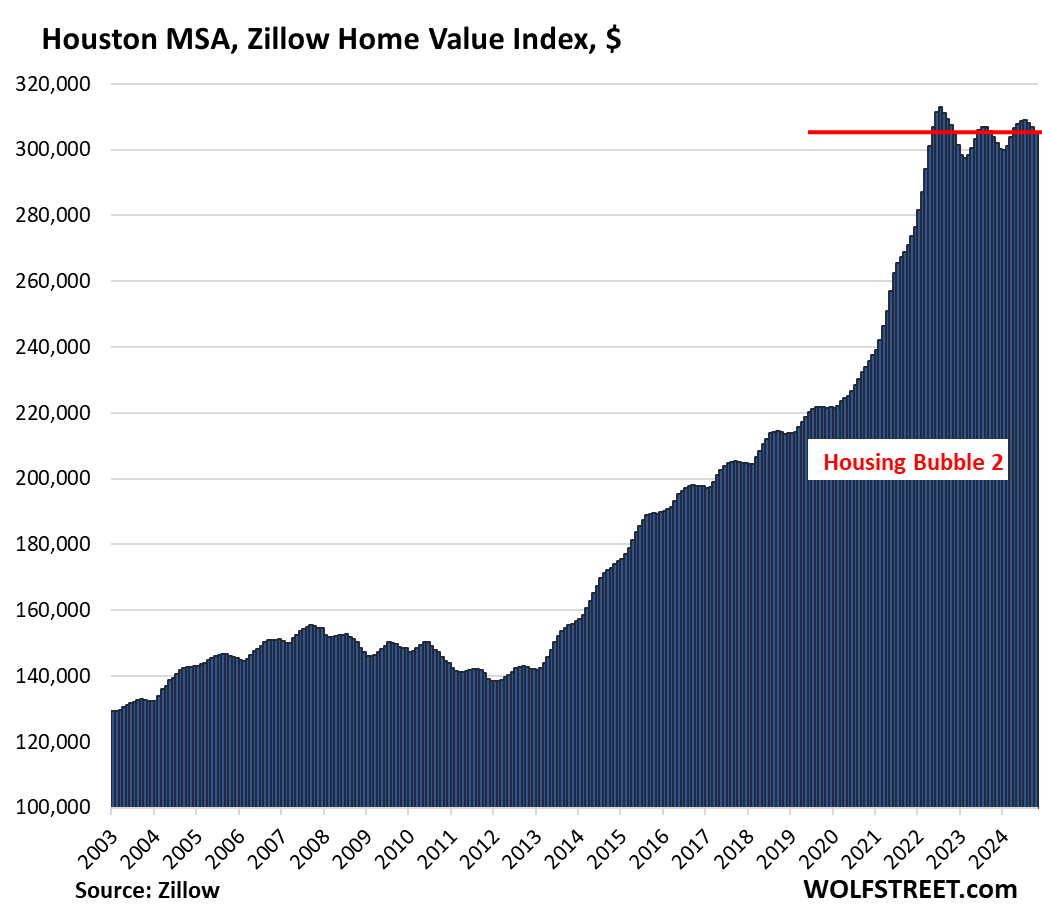
- Houston: -2.4%
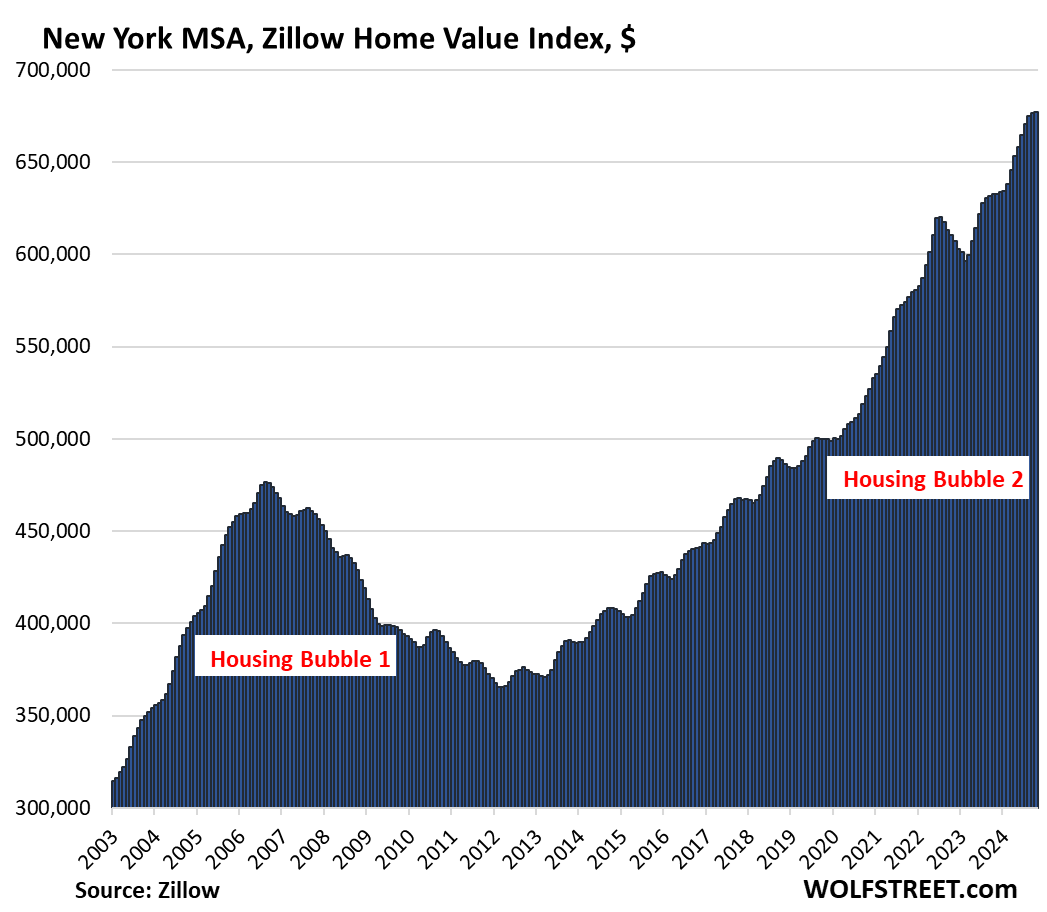
New highs: Prices in the New York City metro inched up by less than 0.1% and eked out a new high, the only metro of the 30 MSAs here to reach a new high in October.
The 30 Most Splendid Housing Bubbles in America.
All data here is from the “raw” Zillow Home Value Index (ZHVI), released today. The ZHVI is based on millions of data points in Zillow’s “Database of All Homes,” including from public records (tax data), MLS, brokerages, local Realtor Associations, real-estate agents, and households across the US. It includes pricing data for off-market deals and for-sale-by-owner deals. Zillow’s Database of All Homes also has sales-pairs data.
We started The Most Splendid Housing Bubbles in America series in 2017 to document visually metro-by-metro the surge in home prices fueled by the Fed’s years of interest rate repression and QE. But since 2022, mortgage rates have risen and the Fed has shed $2 trillion in assets under its QT program, and little by little, metro-by-metro, the dynamics are changing.
To qualify for this list, the market must be one of the largest Metropolitan Statistical Areas (MSA) by population, and must have had a ZHVI of over $300,000 at the peak. The metros of New Orleans, Oklahoma City, Tulsa, Cincinnati, Pittsburgh, etc. don’t qualify for this list because their ZHVI has never reached $300,000, despite massive runups of home prices in recent years.
If these charts look absurd it’s because the housing market has become absurd. Housing market charts should never ever look like this. They’re documenting the crazy distortions triggered by the Fed’s monetary policies that then U-turned in 2022.
| Austin MSA, Home Prices | |||
| From Jun 2022 peak | MoM | YoY | Since 2000 |
| -20.4% | -1.0% | -3.5% | 161% |
Prices in Austin have dropped to the lowest level since April 2021.
| San Francisco MSA, Home Prices | |||
| From May 2022 peak | MoM | YoY | Since 2000 |
| -10.0% | -0.6% | 1.4% | 292% |
| Phoenix MSA, Home Prices | |||
| From Jun 2022 peak | MoM | YoY | Since 2000 |
| -8.3% | -0.4% | 0.0% | 222% |
| San Antonio MSA, Home Prices | |||
| From Jul 2022 peak | MoM | YoY | Since 2000 |
| -7.5% | -0.7% | -2.5% | 150.7% |
Prices in San Antonia have dropped to the lowest level since February 2022
| Denver MSA, Home Prices | |||
| From Jun 2022 peak | MoM | YoY | Since 2000 |
| -6.9% | -0.5% | 0.3% | 214% |
| Sacramento MSA, Home Prices | |||
| From July 2022 peak | MoM | YoY | Since 2000 |
| -6.0% | -0.4% | 1.7% | 247.3% |
| Salt Lake City MSA, Home Prices | |||
| From July 2022 peak | MoM | YoY | Since 2000 |
| -5.7% | 0.0% | 1.4% | 214% |
| Portland MSA, Home Prices | |||
| From May 2022 peak | MoM | YoY | Since 2000 |
| -5.4% | -0.3% | 0.9% | 219% |
| Dallas-Fort Worth MSA, Home Prices | |||
| From Jun 2022 peak | MoM | YoY | Since 2000 |
| -5.0% | -0.7% | -0.3% | 196% |
| Seattle MSA, Home Prices | |||
| From May 2022 peak | MoM | YoY | Since 2000 |
| -4.9% | -0.3% | 4.5% | 239% |
| Honolulu, Home Prices | |||
| From Jun 2022 peak | MoM | YoY | Since 2000 |
| -4.5% | -0.1% | 1.0% | 282% |
| Tampa MSA, Home Prices | |||
| From Jul 2022 peak | MoM | YoY | Since 2000 |
| -2.3% | -0.5% | -0.4% | 214% |
| Nashville MSA, Home Prices | |||
| From July 2022 peak | MoM | YoY | Since 2000 |
| -2.6% | -0.3% | 1.1% | 218% |
| Houston MSA, Home Prices | |||
| From Jul 2022 peak | MoM | YoY | Since 2000 |
| -2.4% | -0.6% | 0.5% | 152% |
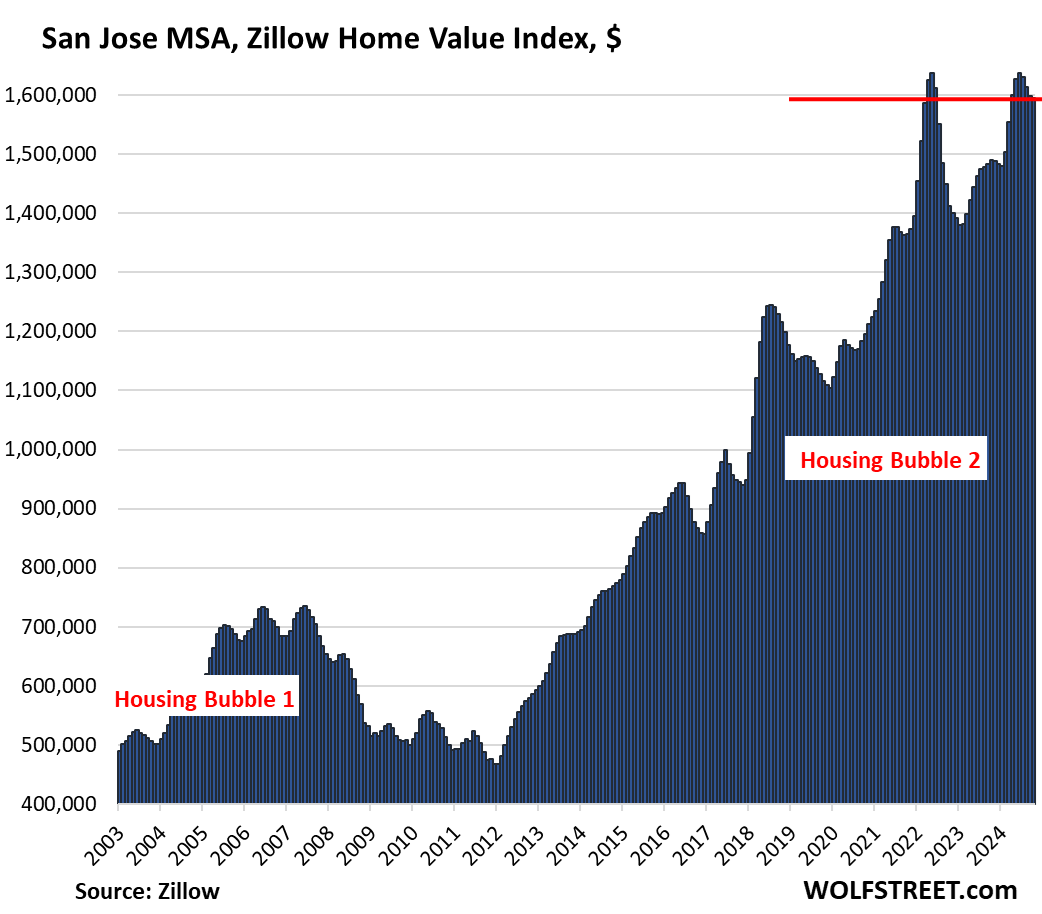
| San Jose MSA, Home Prices | |||
| From May 2022 peak | MoM | YoY | Since 2000 |
| -2.4% | -0.2% | 7.1% | 336% |
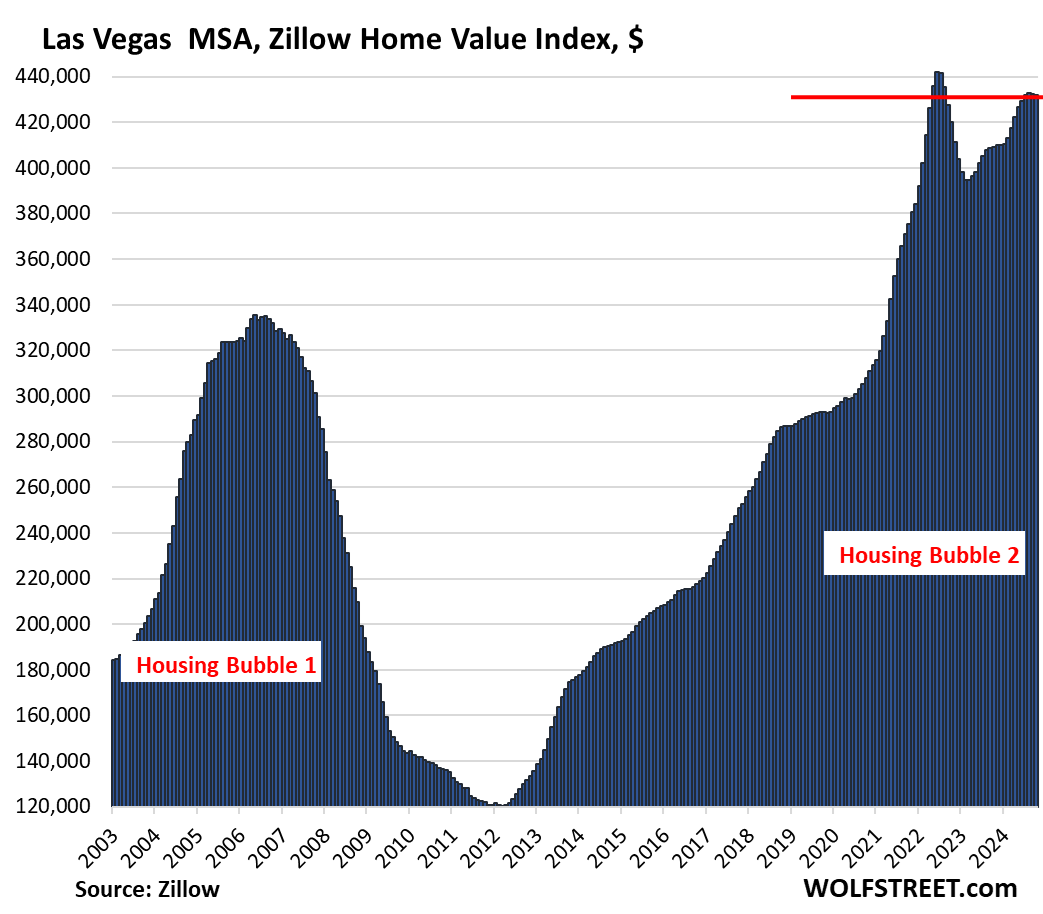
| Las Vegas MSA, Home Prices | |||
| From June 2022 peak | MoM | YoY | Since 2000 |
| -2.2% | -0.1% | 5.5% | 179% |
| Minneapolis MSA, Home Prices | |||
| From May 2022 peak | MoM | YoY | Since 2000 |
| -1.8% | -0.3% | 1.0% | 158% |
| Charlotte MSA, Home Prices | |||
| MoM | YoY | Since 2000 | |
| -0.4% | 1.8% | 171.5% | |
| San Diego MSA, Home Prices | ||
| MoM | YoY | Since 2000 |
| -0.6% | 3.9% | 335% |
| Los Angeles MSA, Home Prices | ||
| MoM | YoY | Since 2000 |
| -0.3% | 4.6% | 331% |
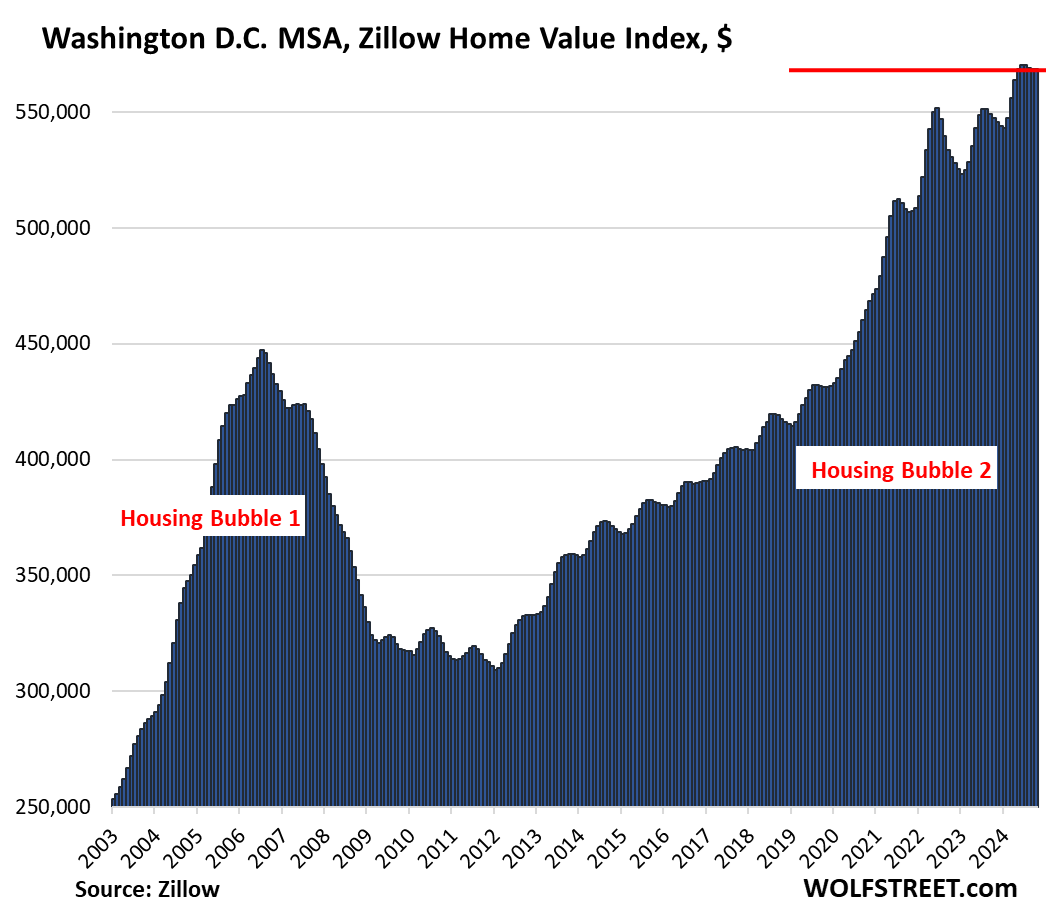
| Washington D.C. MSA, Home Prices | |||
| MoM | YoY | Since 2000 | |
| 0.0% | 3.8% | 215% | |
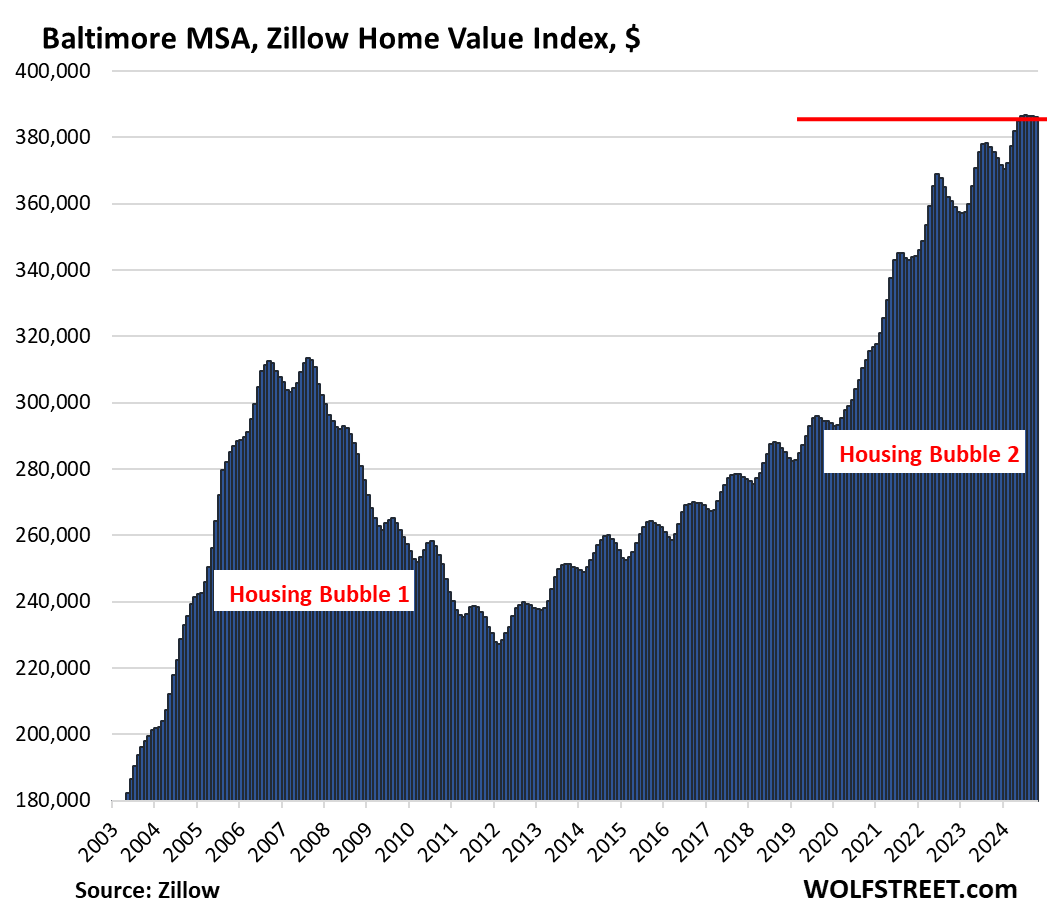
| Baltimore MSA, Home Prices | |||
| MoM | YoY | Since 2000 | |
| -0.1% | 2.8% | 174% | |
| Miami MSA, Home Prices | ||
| MoM | YoY | Since 2000 |
| -0.3% | 2.3% | 333.4% |
| Atlanta MSA, Home Prices | ||
| MoM | YoY | Since 2000 |
| -0.7% | 1.1% | 164% |
| Kansas City MSA, Home Prices | ||
| MoM | YoY | Since 2000 |
| -0.3% | 2.7% | 177% |
| Columbus MSA, Home Prices | ||
| MoM | YoY | Since 2000 |
| -0.4% | 3.3% | 154% |
| Boston MSA, Home Prices | ||
| MoM | YoY | Since 2000 |
| -0.5% | 4.8% | 227% |
| Chicago MSA, Home Prices | ||
| MoM | YoY | Since 2000 |
| -0.3% | 4.8% | 113% |
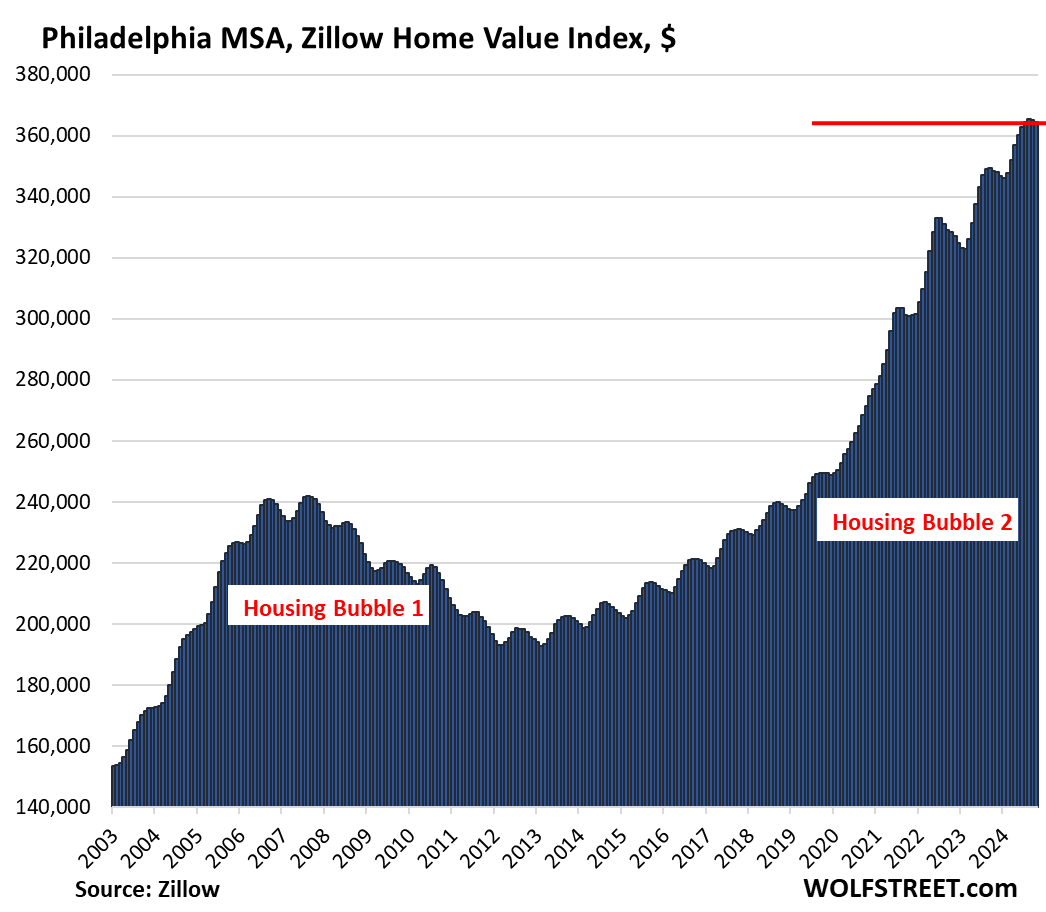
| Philadelphia MSA, Home Prices | ||
| MoM | YoY | Since 2000 |
| -0.2% | 4.6% | 201% |
| New York MSA, Home Prices | ||
| MoM | YoY | Since 2000 |
| 0.1% | 7.0% | 212% |
We give you energy news and help invest in energy projects too, click here to learn more