

1 New High. 19 metros below 2022 peaks: Austin, San Francisco, Phoenix, Denver, Salt Lake City, Portland, Seattle, Dallas, Honolulu, Nashville…
By Wolf Richter for WOLF STREET.
Active listings have been surging for months in practically every major market, including in formerly hot markets such as Florida. Sellers are grappling with an unexpected phenomenon: While inventories are piling up, buyers are on strike because prices are too high even though mortgage rates have dropped a bunch over the 10 months through mid-September. Since the rate cut, mortgage rates have risen again but at around 6.6% remain a lot lower than they’d been.
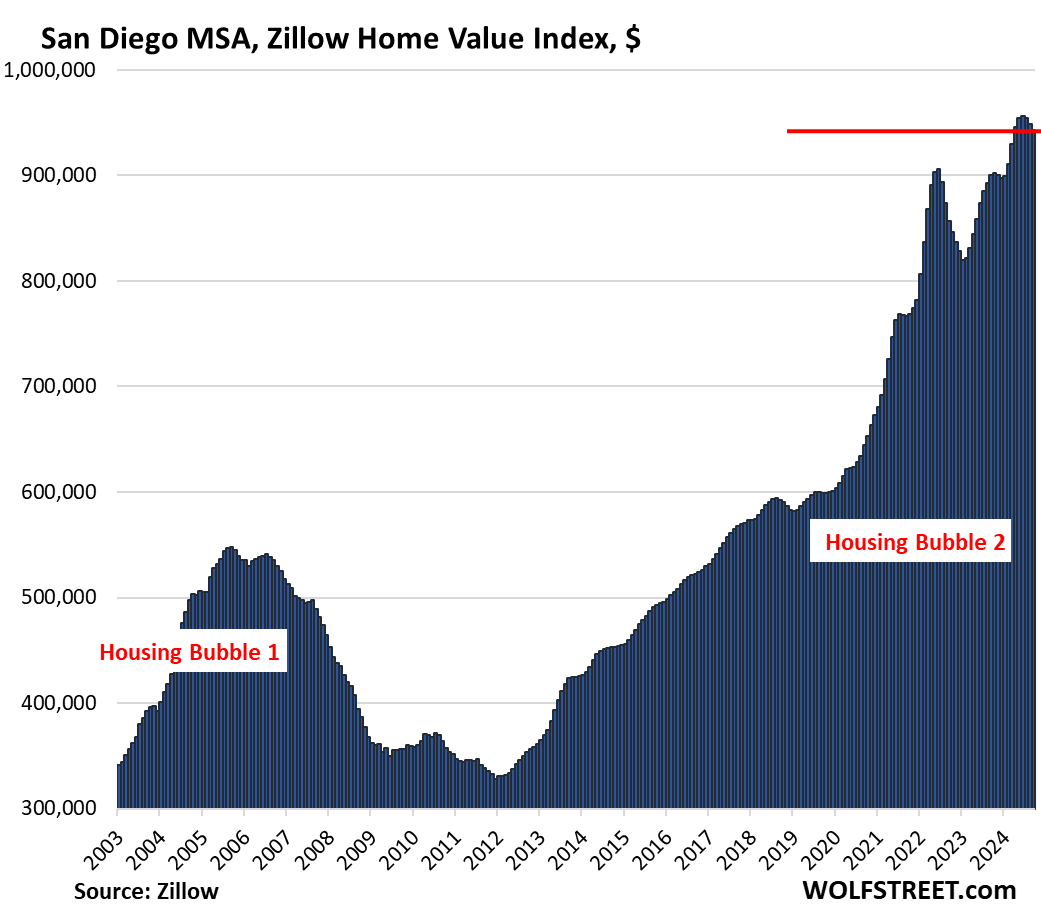
The lower mortgage rates have brought out the sellers, but not the buyers who remain on strike because prices are too high. And so, prices even in markets such as San Diego have started to succumb to gravity.
Down from prior month: Prices of single-family houses, condos, and co-ops sagged in September from August in 26 of the 28 large metros here.
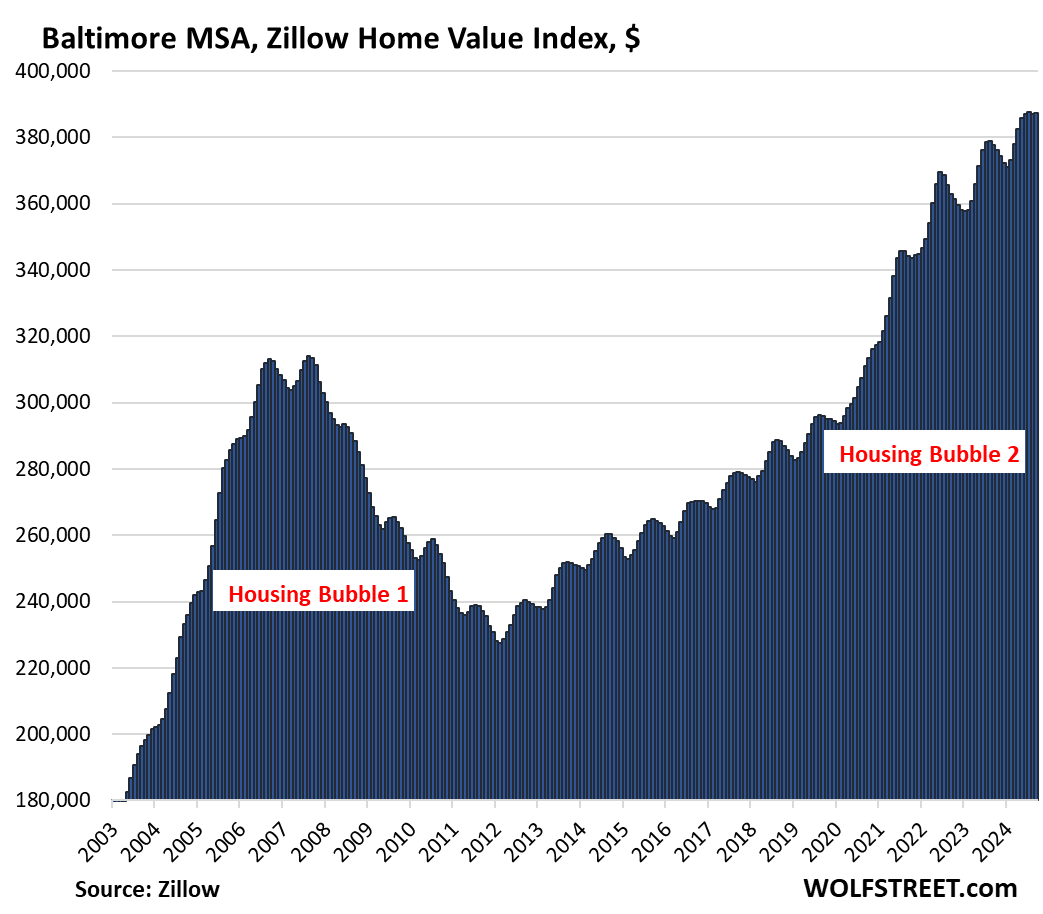
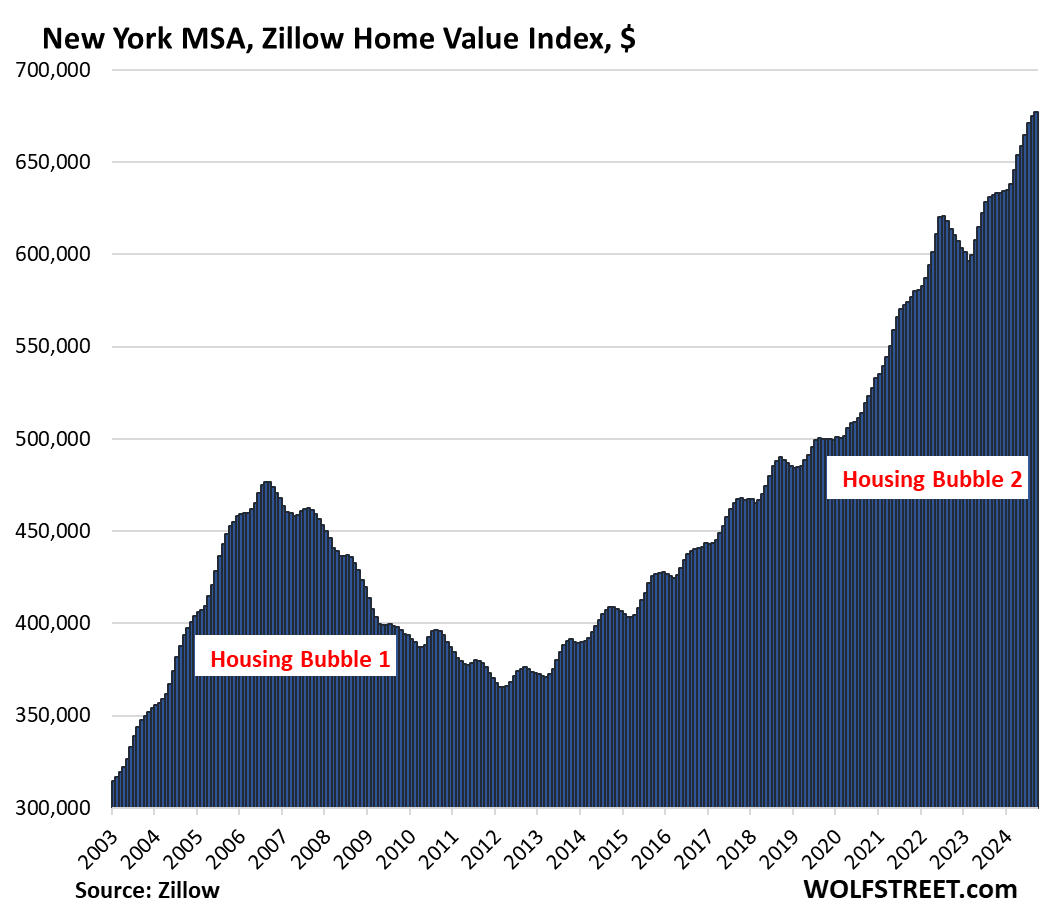
The two exceptions were Baltimore, where prices were unchanged, and the vast New York City metro where prices rose 0.3% to a new high, according to data from the “raw” Zillow Home Value Index (ZHVI).
By Metropolitan Statistical Area (MSA), the top 20 month-to-month price declines:
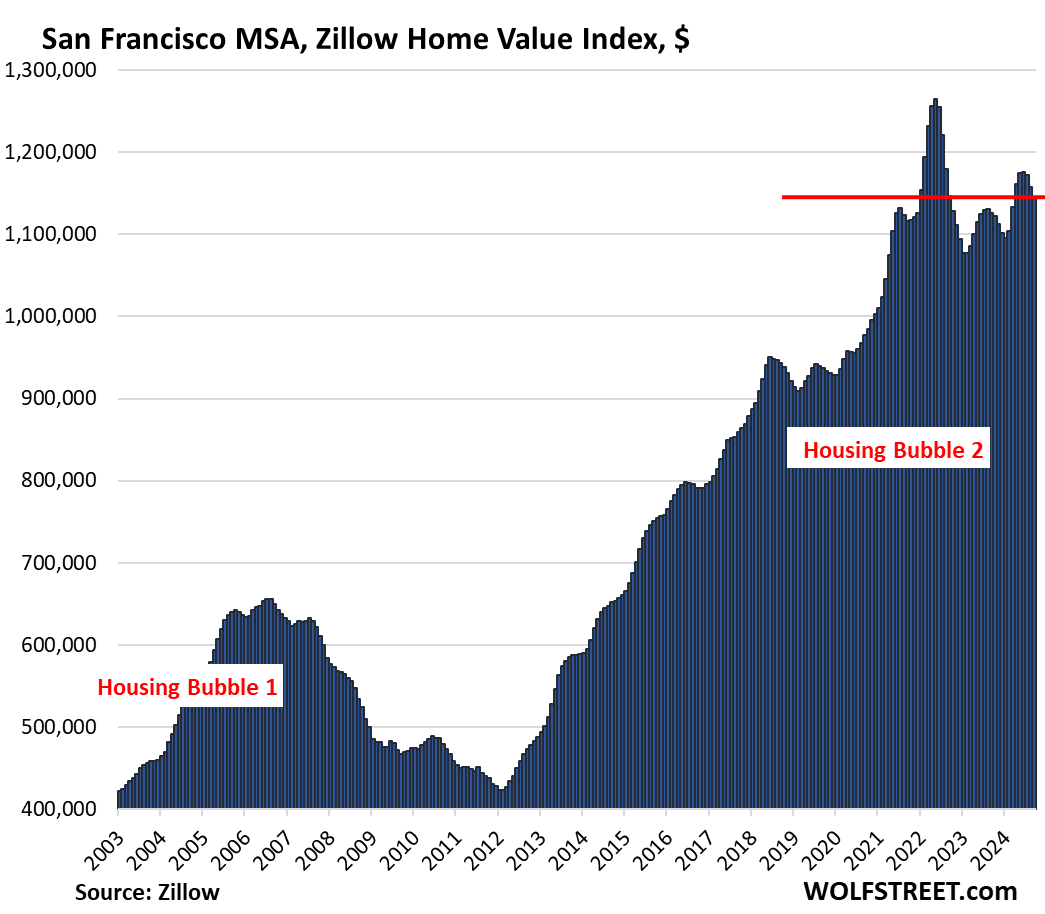
San Francisco: -1.1%
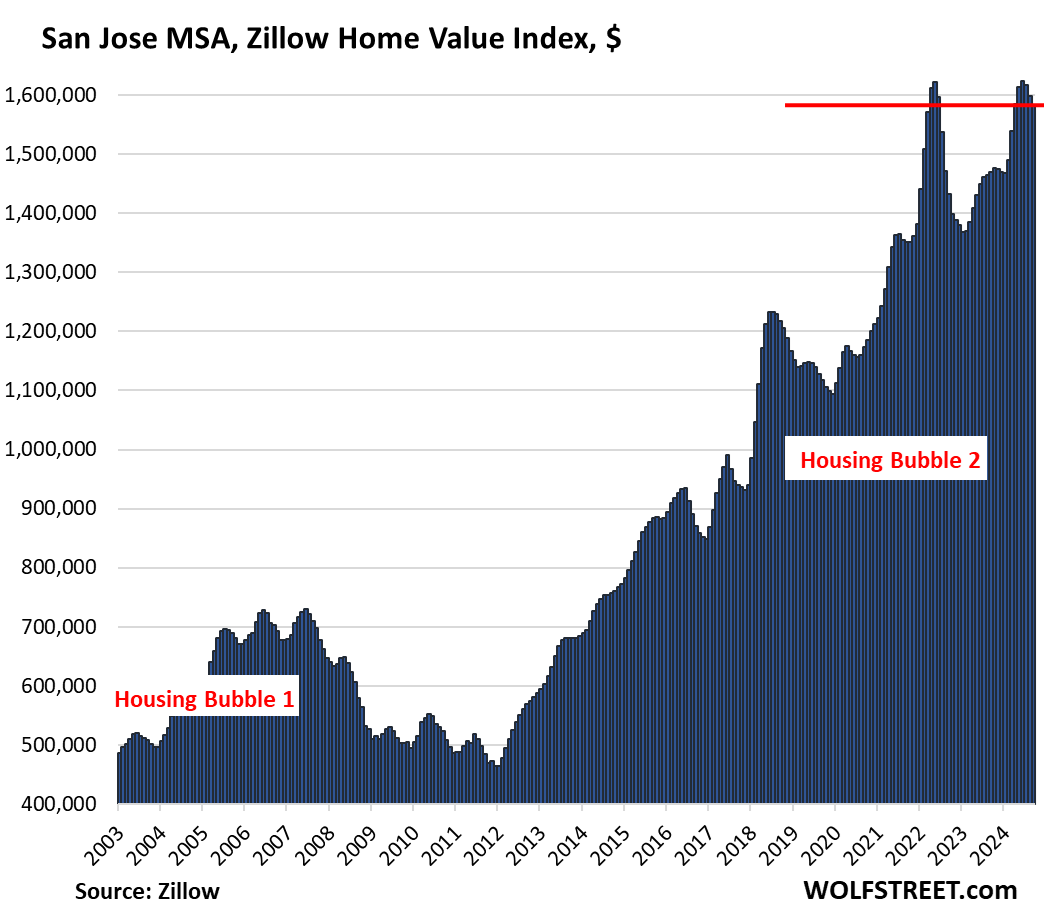
San Jose: -0.9%
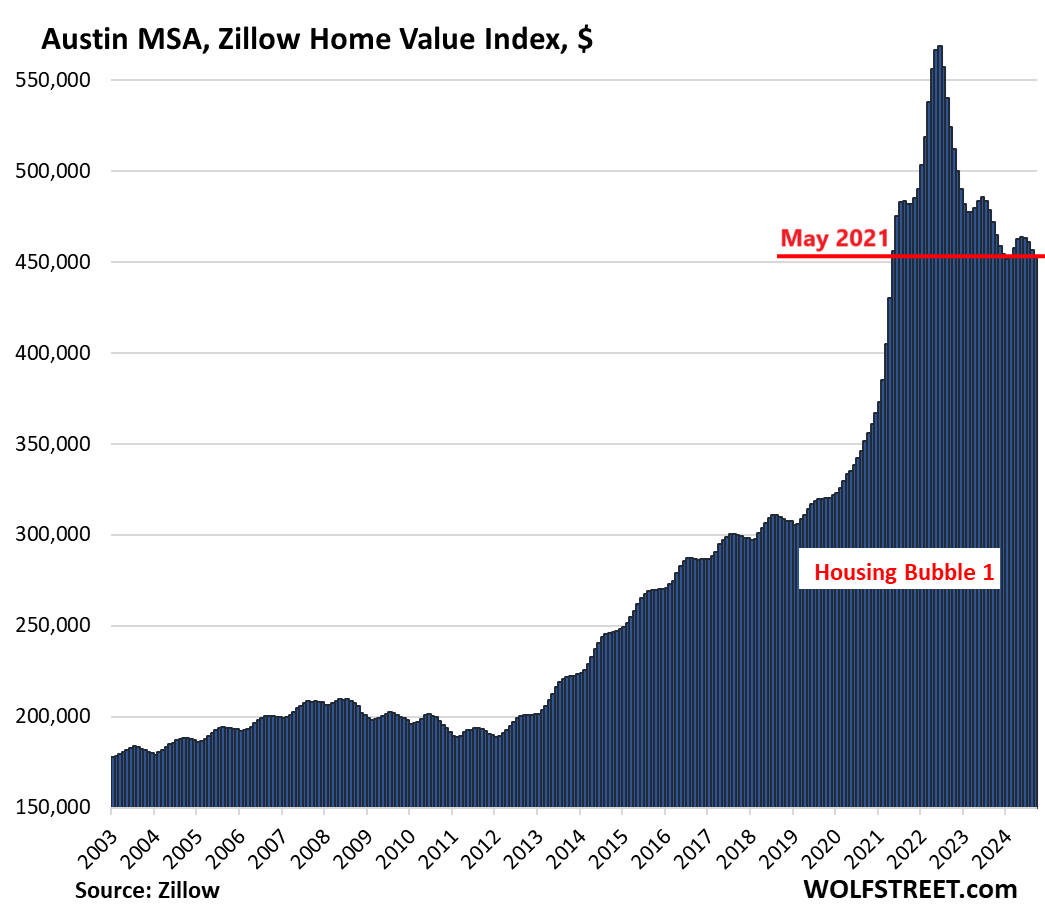
Austin: -0.8%
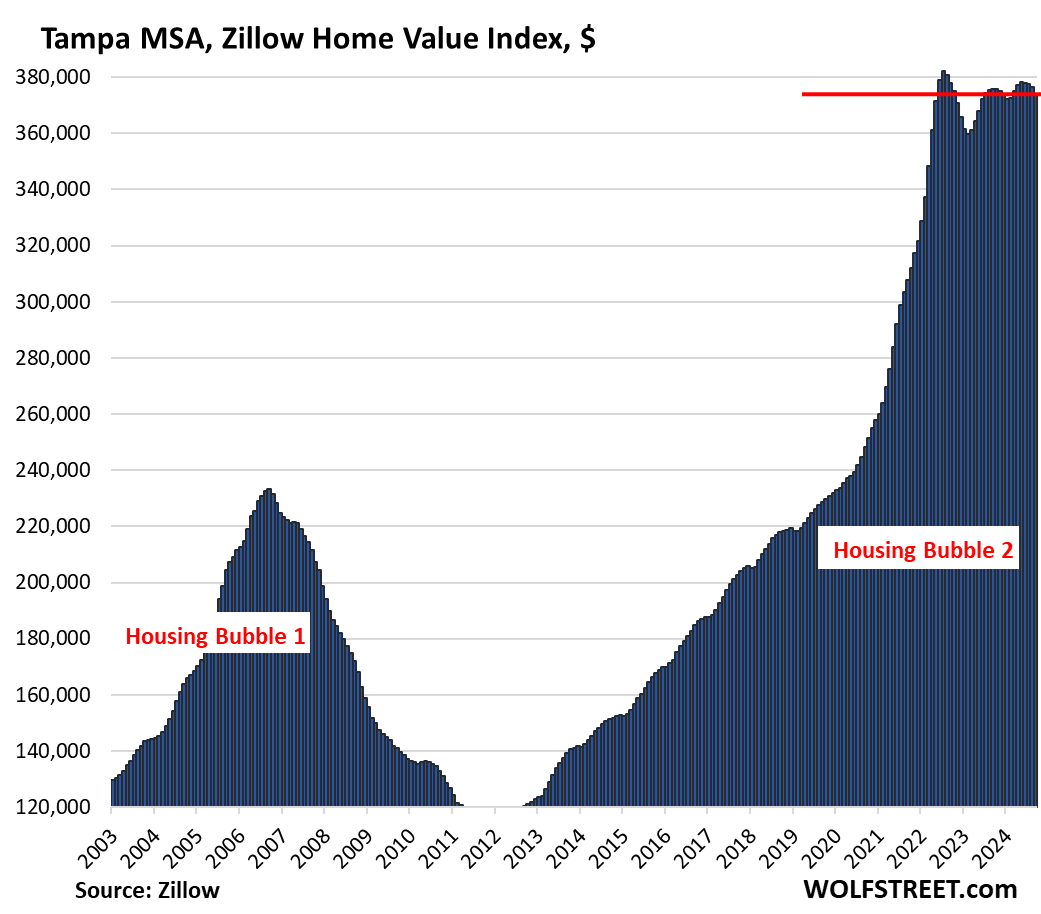
Tampa: -0.7%
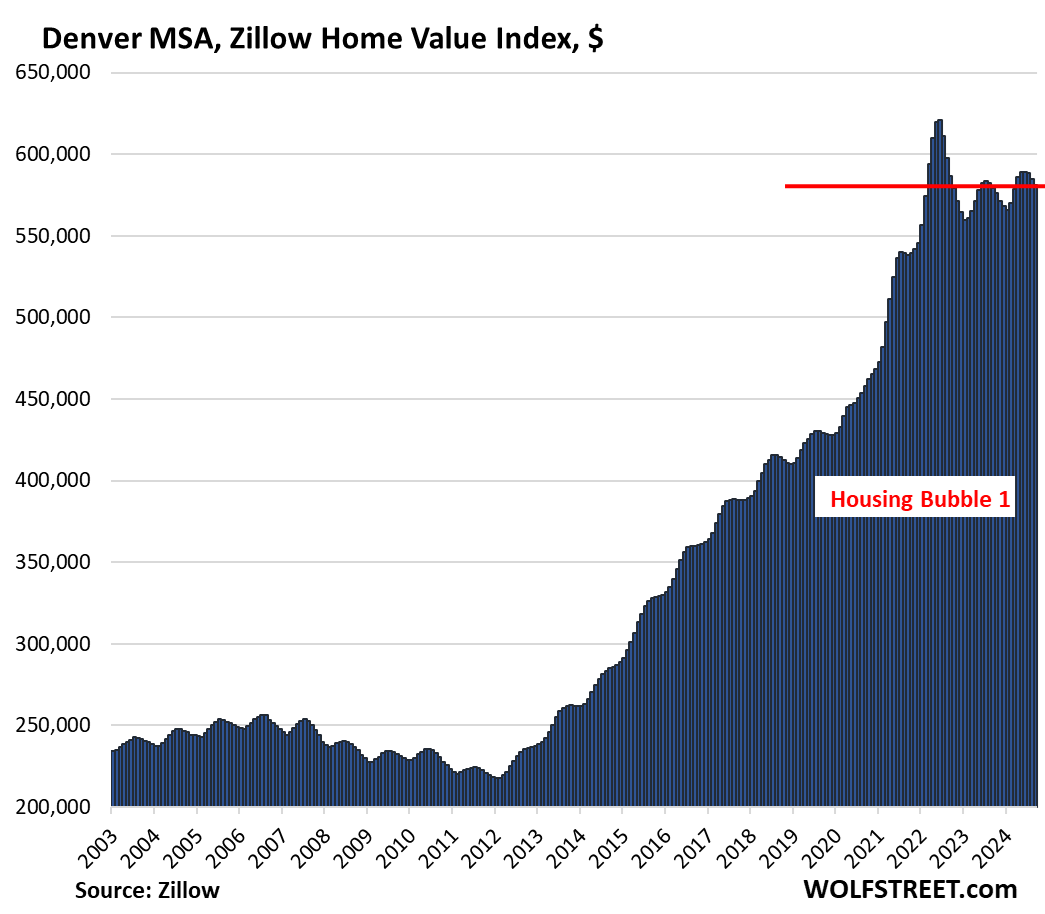
Denver: -0.6%
San Diego: -0.5%
Sacramento: -0.5%
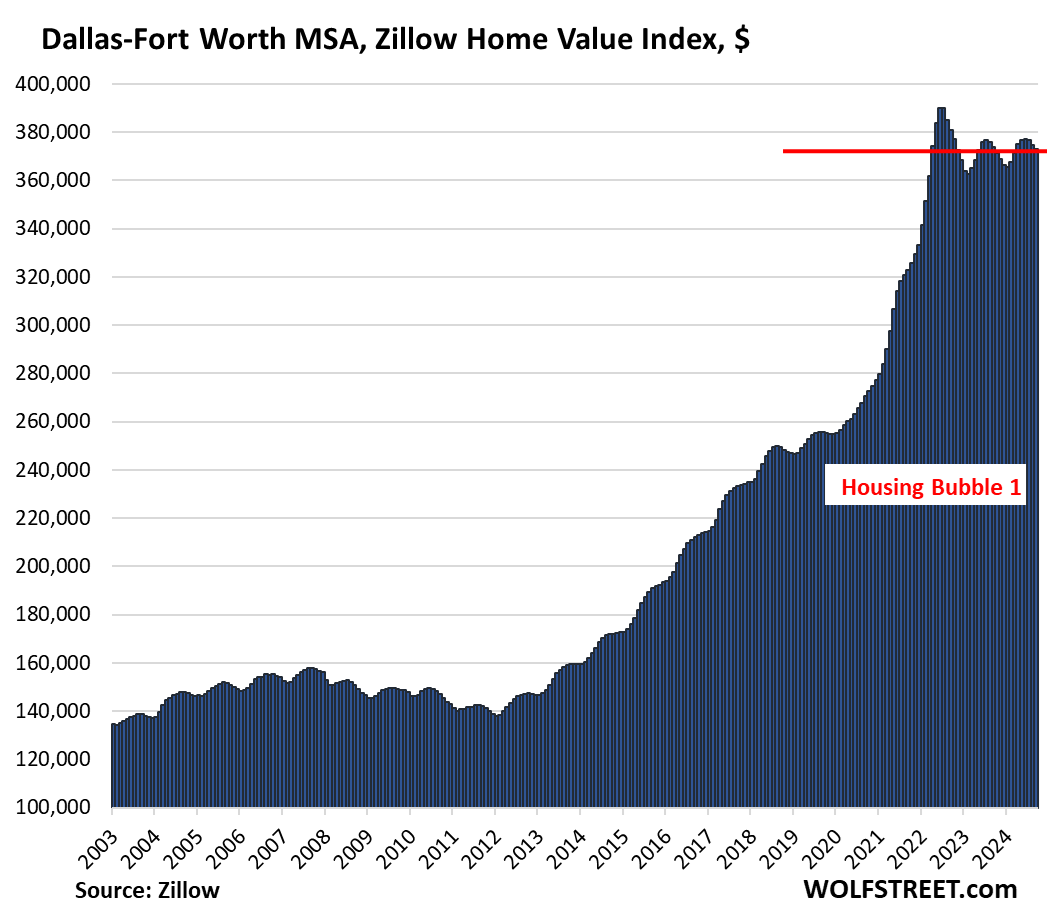
Dallas: -0.5%
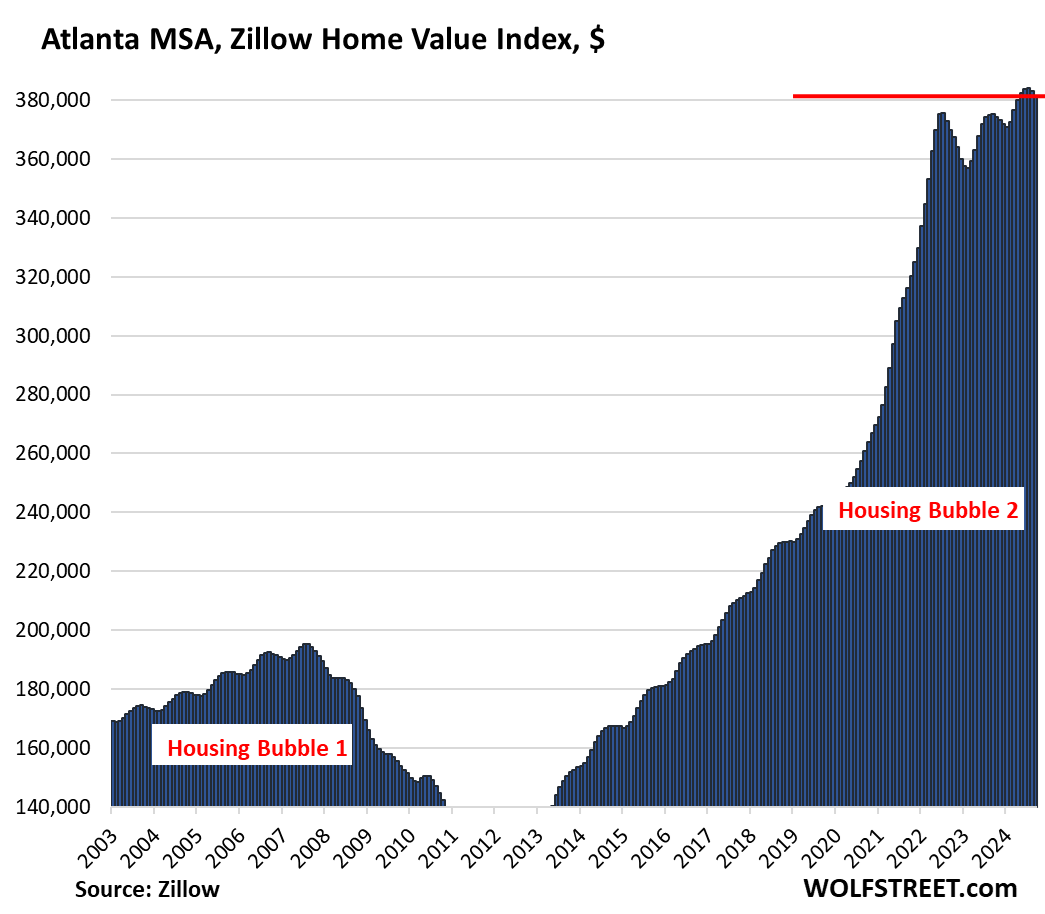
Atlanta: -0.5%
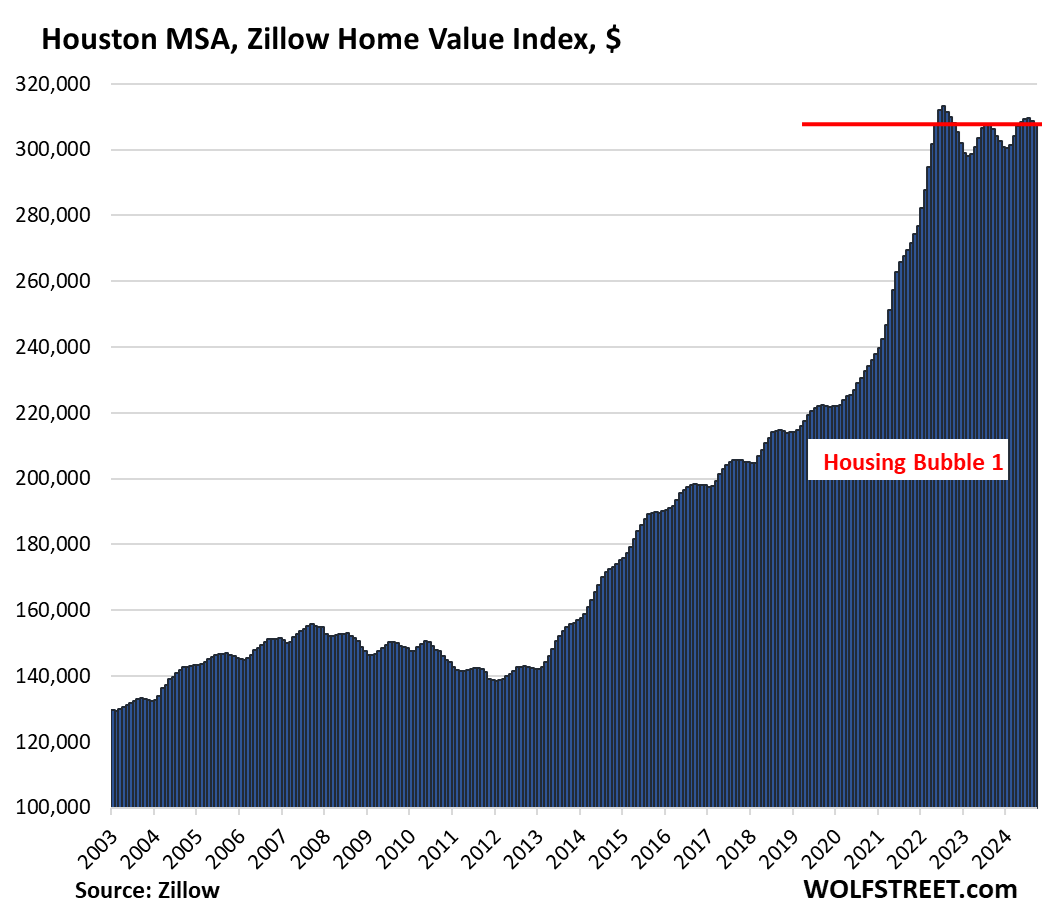
Houston: -0.4%
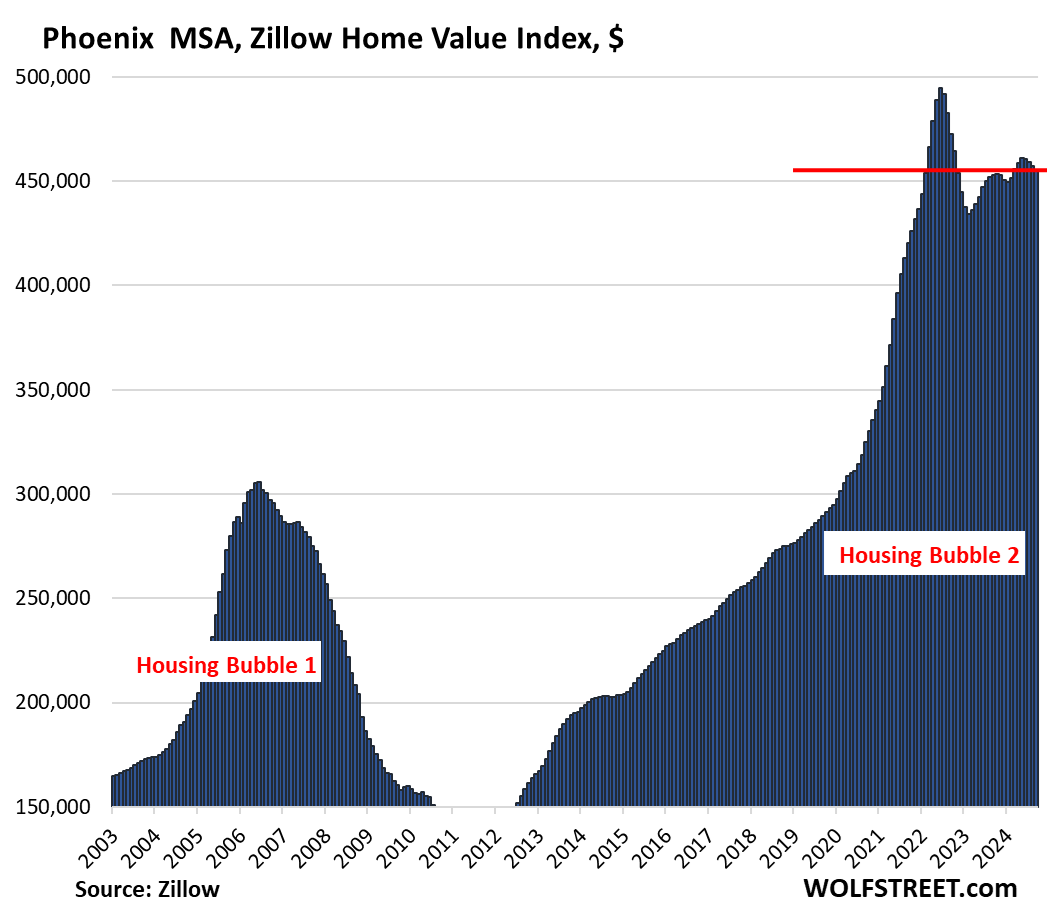
Phoenix: -0.4%
Portland: -0.4%
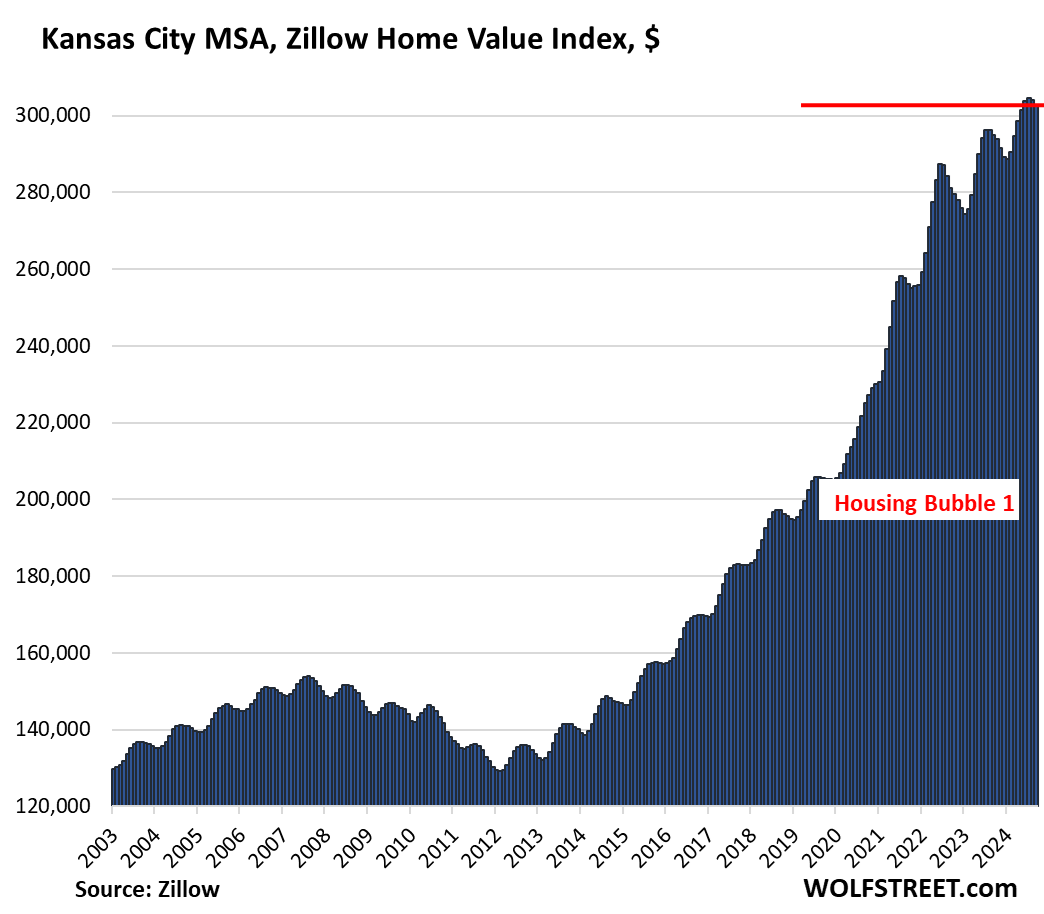
Kansas City: -0.4%
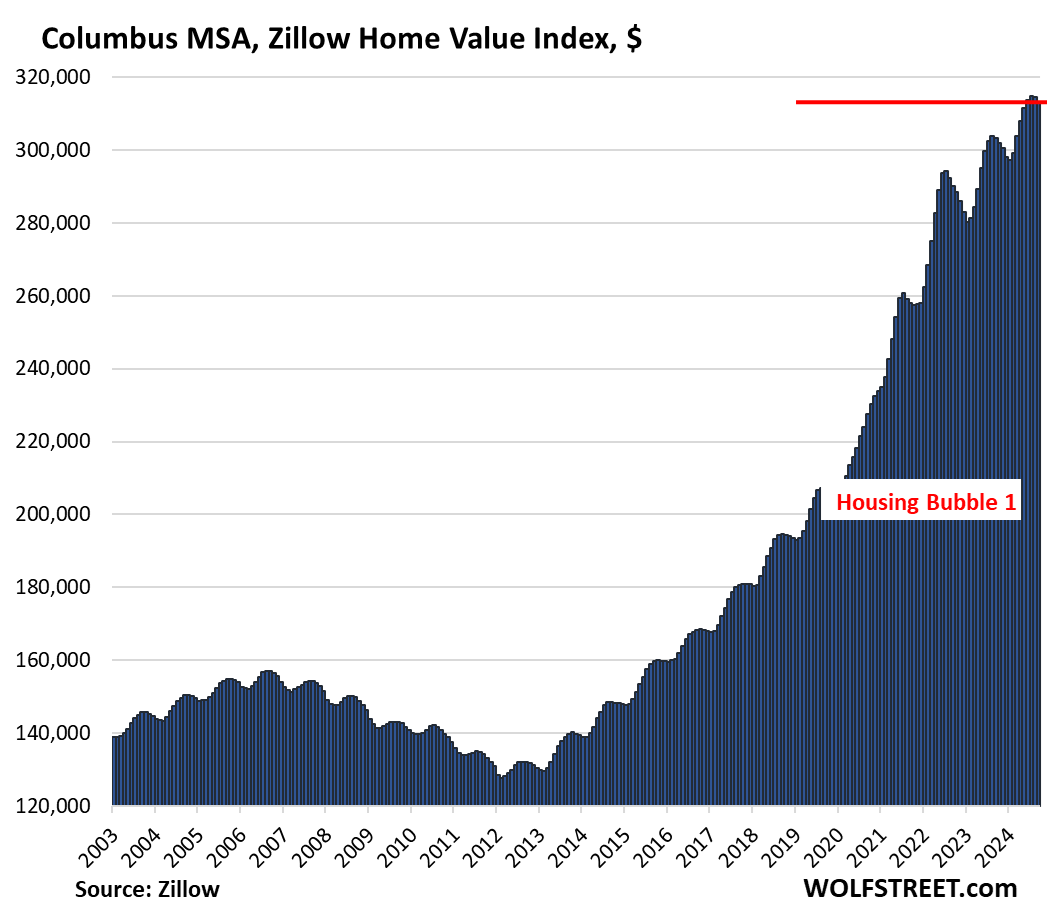
Columbus: -0.4%
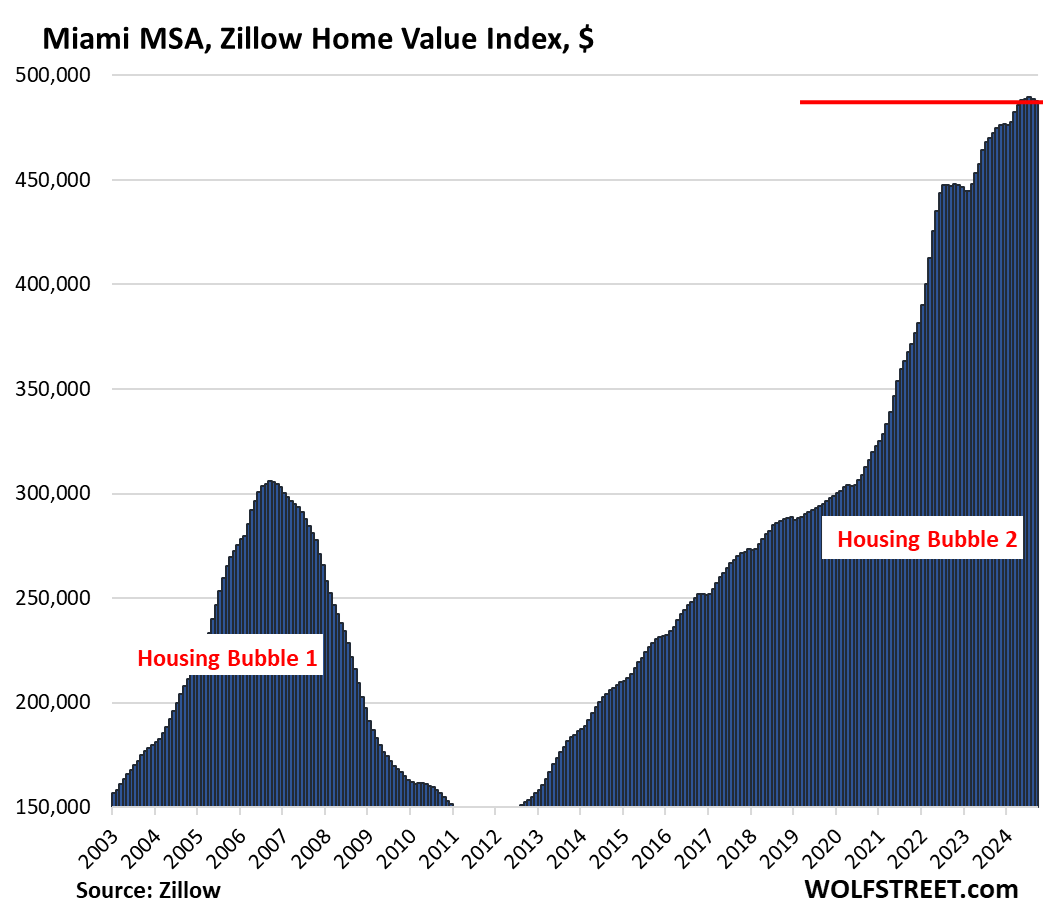
Miami: -0.3%
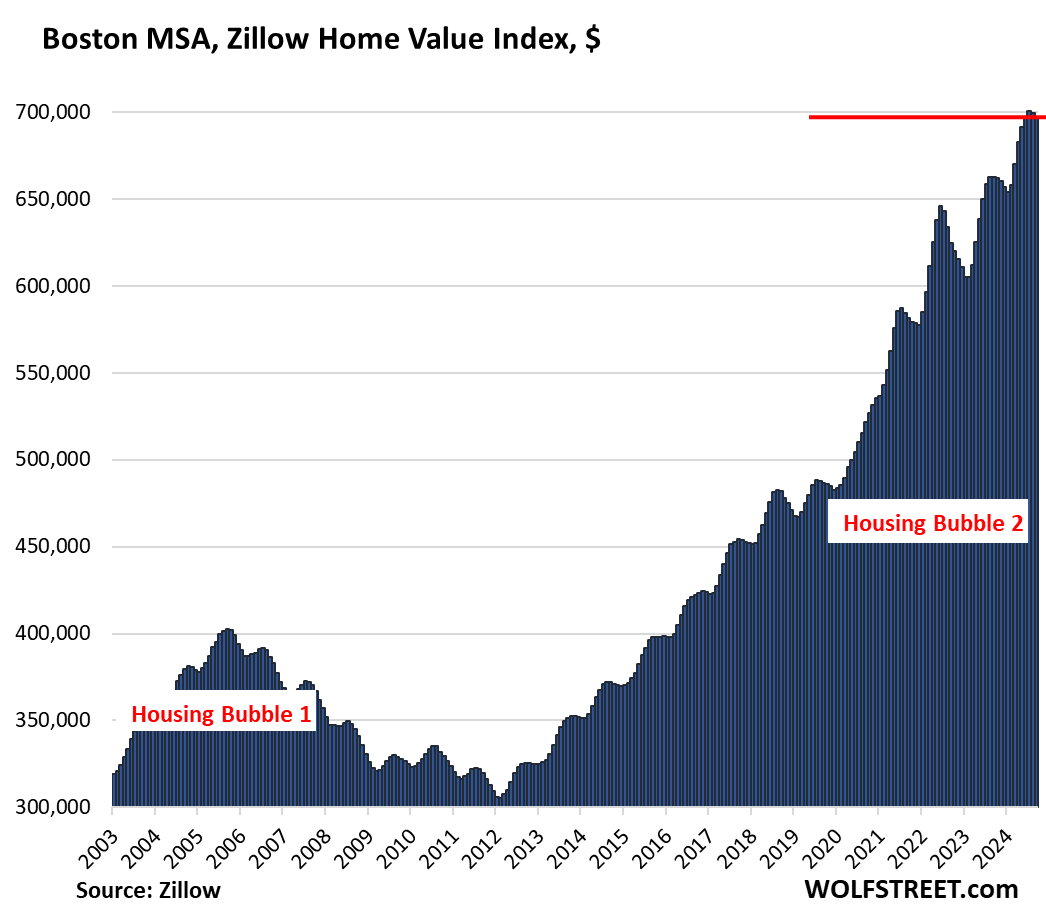
Boston: -0.3%
Seattle: -0.3%
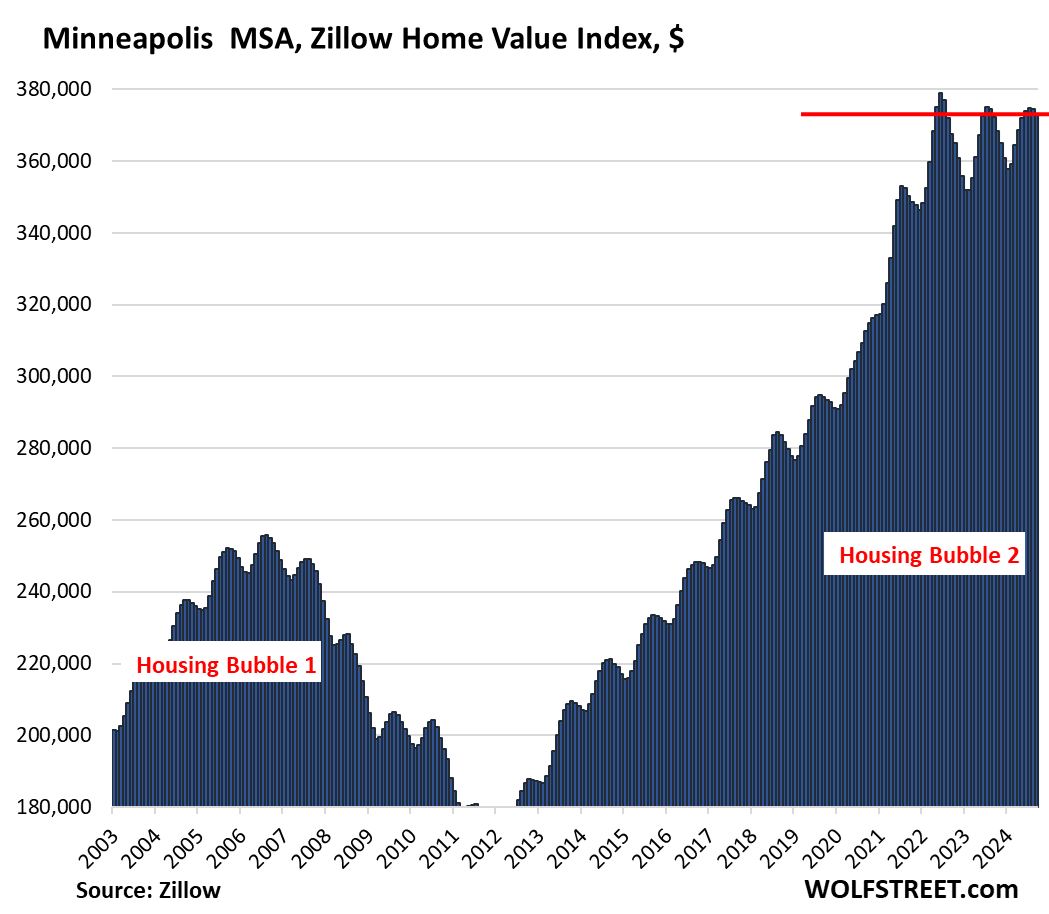
Minneapolis: -0.3%
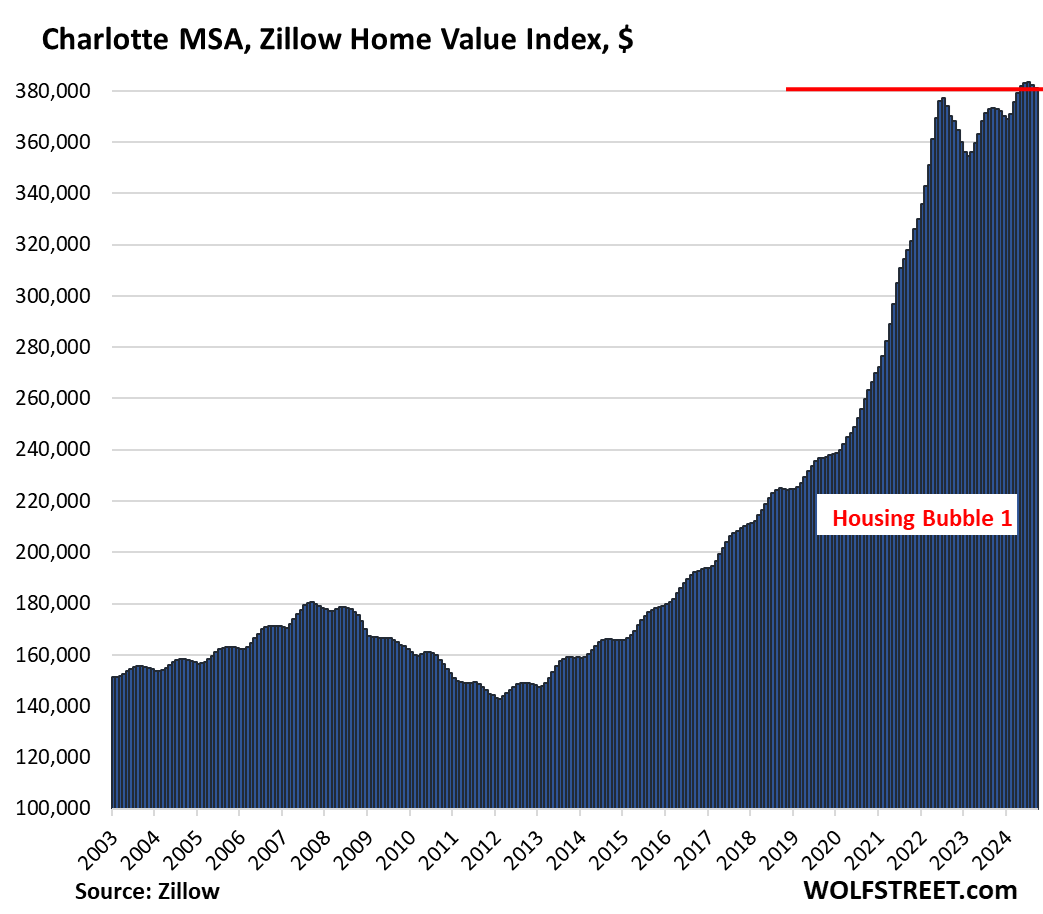
Charlotte: -0.3%
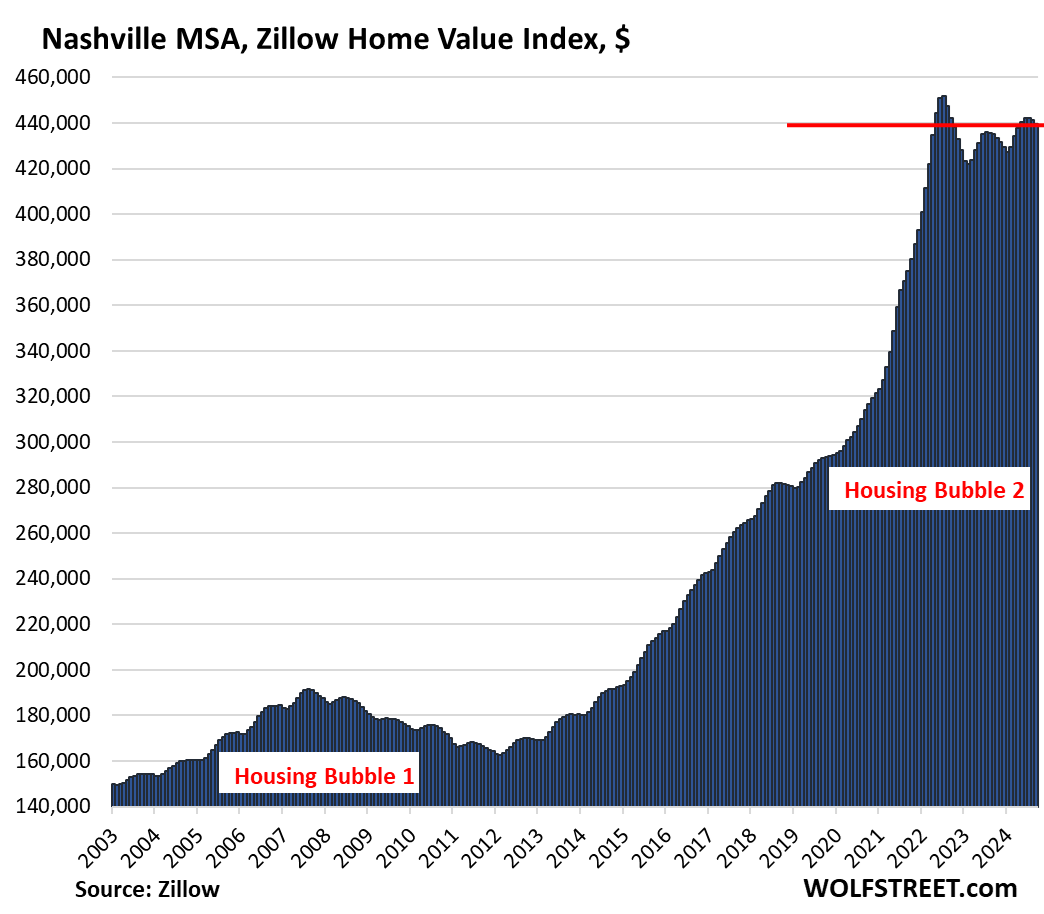
Nashville: -0.3%
Down from their 2022 peaks: Home prices in 19 of the 28 MSAs here were down from their peaks in 2022, led by these 10:
Austin: -20.4%
San Francisco: -9.4%
Phoenix: -8.0%
Denver: -6.4%
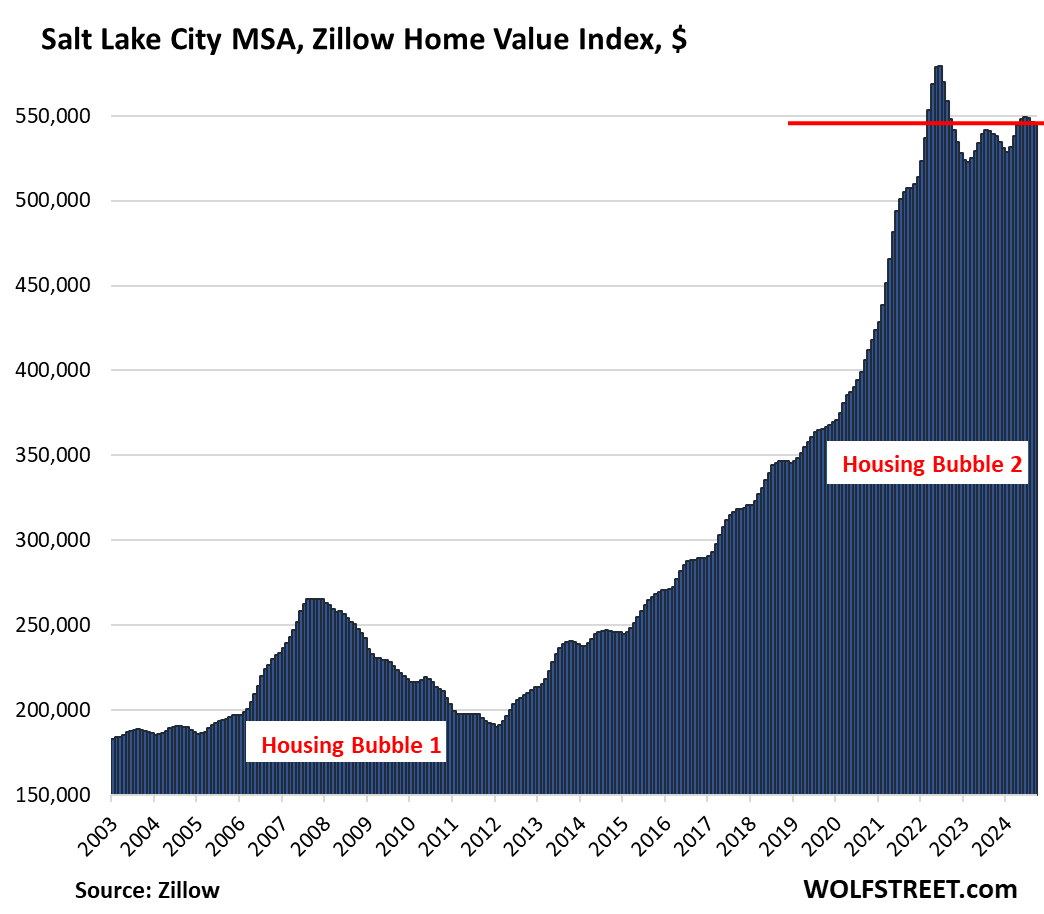
Salt Lake City: -5.7%
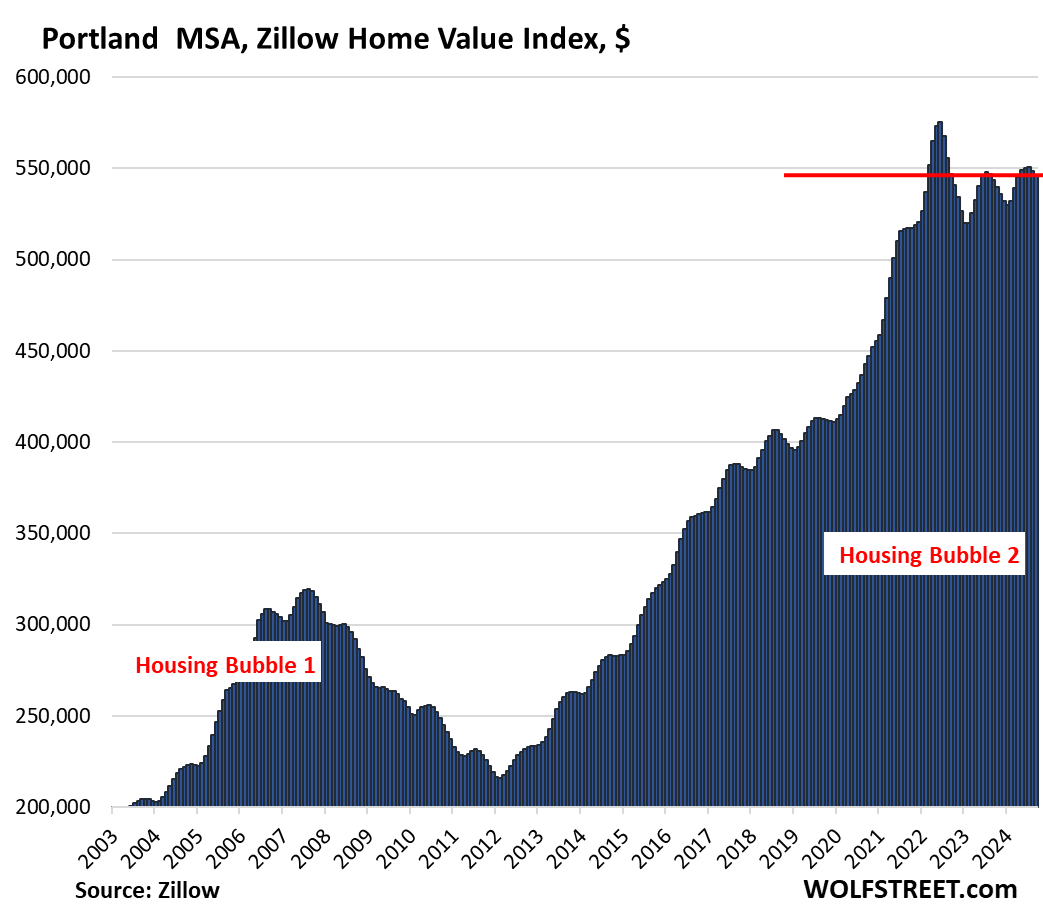
Portland: -5.1%
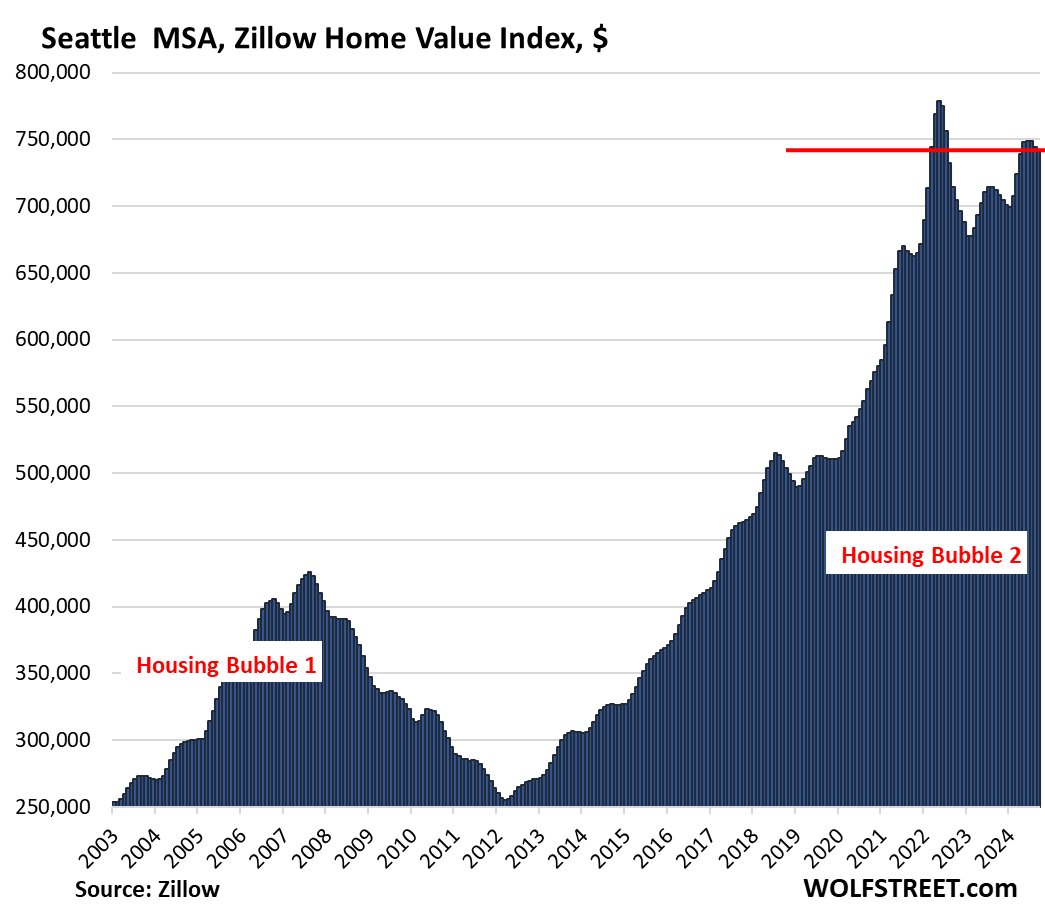
Seattle: -4.7%
Dallas: -4.4%
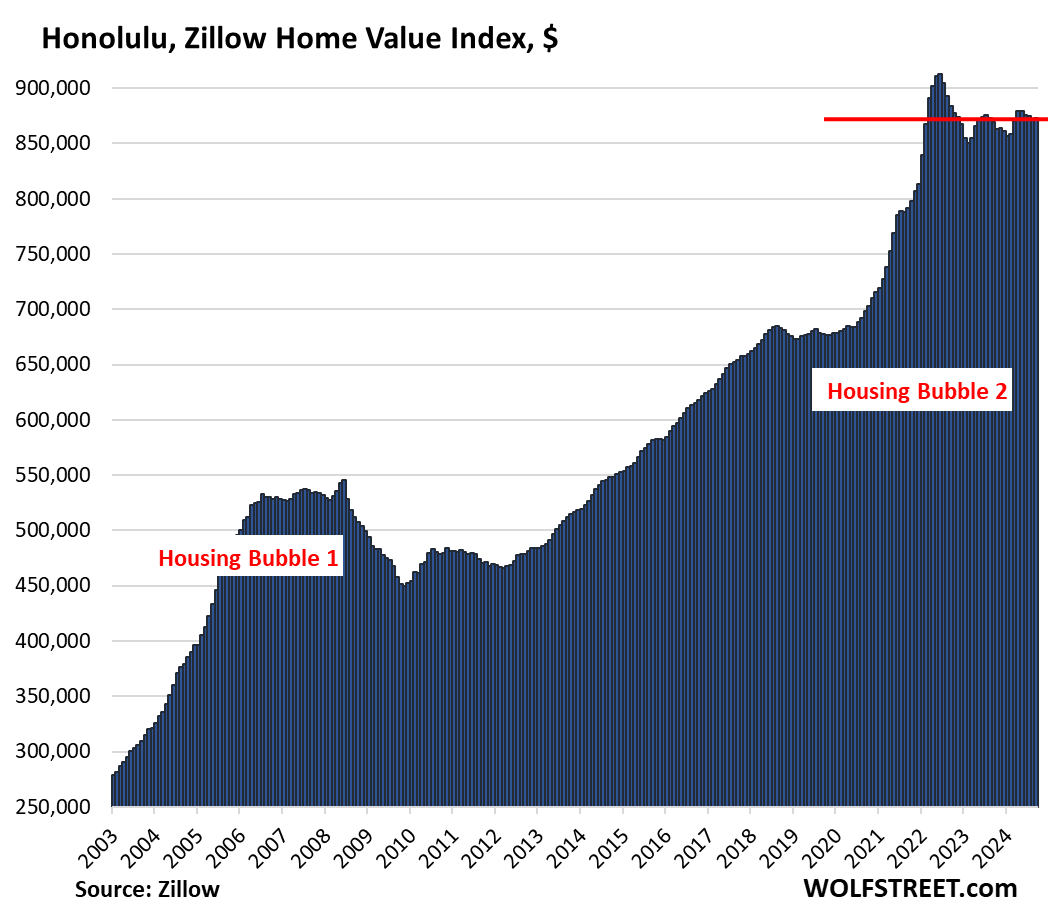
Honolulu: -4.4%
Nashville: -2.6%
New highs: Prices in the New York City metro rose to a new high; in Baltimore, they stayed at the new high for the third month in a row.
The 28 Most Splendid Housing Bubbles in America.
| Austin MSA, Home Prices | |||
| From Jun 2022 peak | MoM | YoY | Since 2000 |
| -20.4% | -0.8% | -4.0% | 163% |
The price index has now dropped below where it had been in May 2021.
| San Francisco MSA, Home Prices | |||
| From May 2022 peak | MoM | YoY | Since 2000 |
| -9.4% | -1.1% | 1.7% | 295% |
Methodology: The ZHVI is based on millions of data points in Zillow’s “Database of All Homes,” including from public records (tax data), MLS, brokerages, local Realtor Associations, real-estate agents, and individual households across the US. It includes pricing data for off-market deals and for-sale-by-owner deals. Zillow’s Database of All Homes also has sales-pairs data.
| Phoenix MSA, Home Prices | |||
| From Jun 2022 peak | MoM | YoY | Since 2000 |
| -8.0% | -0.4% | 0.5% | 224% |
To qualify for this list, the market must be one of the largest Metropolitan Statistical Areas (MSA) by population, and it must have a current ZHVI of over $300,000. The metros of New Orleans, Oklahoma City, Tulsa, Cincinnati, Pittsburgh, etc. don’t qualify because their ZHVI is below $300,000, though they too had huge runups of home prices in recent years.
| Denver MSA, Home Prices | |||
| From Jun 2022 peak | MoM | YoY | Since 2000 |
| -6.4% | -0.6% | 0.3% | 215% |
| Salt Lake City MSA, Home Prices | |||
| From July 2022 peak | MoM | YoY | Since 2000 |
| -5.7% | -0.1% | 1.3% | 214% |
| Portland MSA, Home Prices | |||
| From May 2022 peak | MoM | YoY | Since 2000 |
| -5.1% | -0.4% | 0.5% | 220% |
We started this series in 2017 to document visually and metro-by-metro the massive surge in home prices triggered by years of interest rate repression and QE by the Fed. But since 2022, we have much higher mortgage rates and QT, and the dynamics have changed.
We explained here why we switched to the “raw” ZHVI after years of using the Case-Shiller Home Price Index.
| Honolulu, Home Prices | |||
| From Jun 2022 peak | MoM | YoY | Since 2000 |
| -4.4% | 0.1% | 0.4% | 282% |
| Seattle MSA, Home Prices | |||
| From May 2022 peak | MoM | YoY | Since 2000 |
| -4.7% | -0.3% | 4.3% | 240% |
| Dallas-Fort Worth MSA, Home Prices | |||
| From Jun 2022 peak | MoM | YoY | Since 2000 |
| -4.4% | -0.5% | -0.3% | 198% |
| Nashville MSA, Home Prices | |||
| From July 2022 peak | MoM | YoY | Since 2000 |
| -2.6% | -0.3% | 1.1% | 219% |
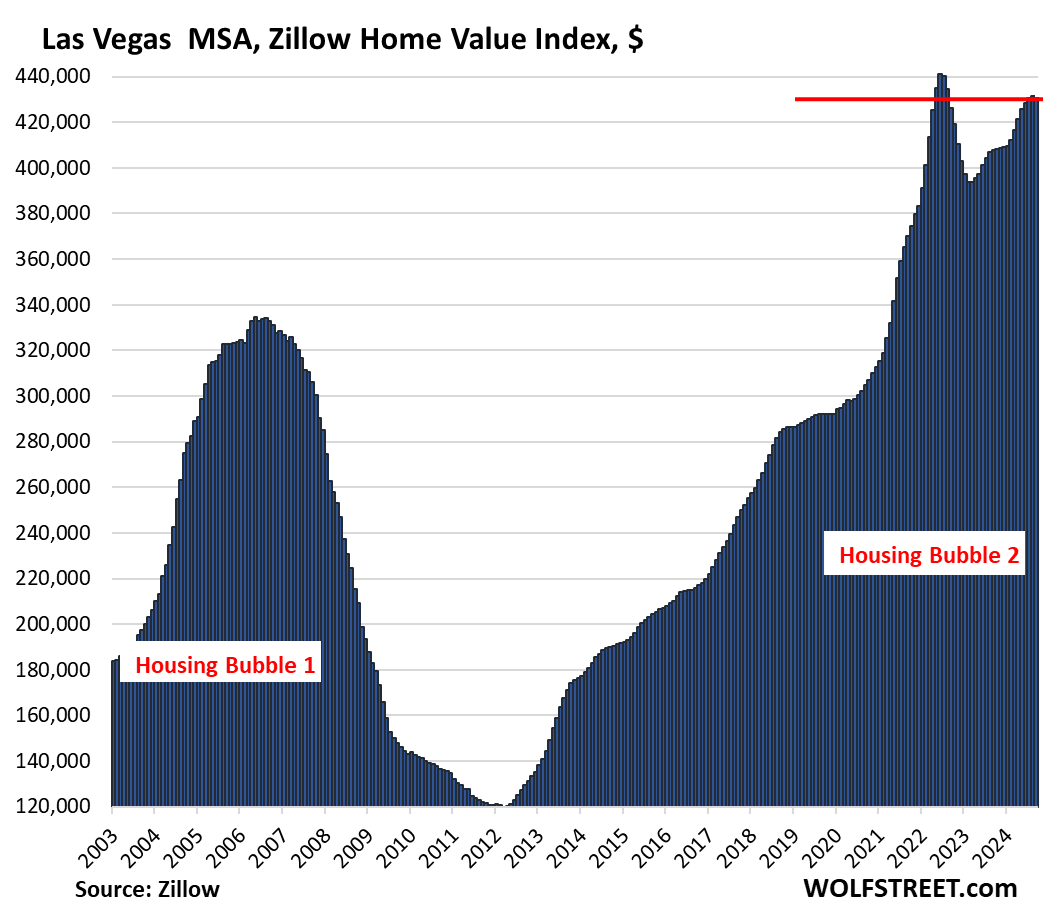
| Las Vegas MSA, Home Prices | |||
| From June 2022 peak | MoM | YoY | Since 2000 |
| -2.2% | -0.1% | 5.7% | 179% |
| Tampa MSA, Home Prices | |||
| From Jul 2022 peak | MoM | YoY | Since 2000 |
| -2.3% | -0.4% | -0.3% | 216% |
| San Jose MSA, Home Prices | |||
| From May 2022 peak | MoM | YoY | Since 2000 |
| -2.4% | -0.9% | 7.8% | 336% |
If these charts look funny, in an absurd sort of way, the way housing market charts should never ever look, it’s because this housing market has been whipped into crazy distortions by the Fed’s monetary policies that then U-turned in 2022, including nearly $2 trillion in QT by now.
| Houston MSA, Home Prices | |||
| From Jul 2022 peak | MoM | YoY | Since 2000 |
| -1.9% | -0.4% | 0.4% | 154% |
| Minneapolis MSA, Home Prices | |||
| From May 2022 peak | MoM | YoY | Since 2000 |
| -1.5% | -0.3% | 0.2% | 159% |
| Charlotte MSA, Home Prices | |||
| MoM | YoY | Since 2000 | |
| -0.3% | 2.1% | 172.6% | |
| San Diego MSA, Home Prices | ||
| MoM | YoY | Since 2000 |
| -0.5% | 4.8% | 338% |
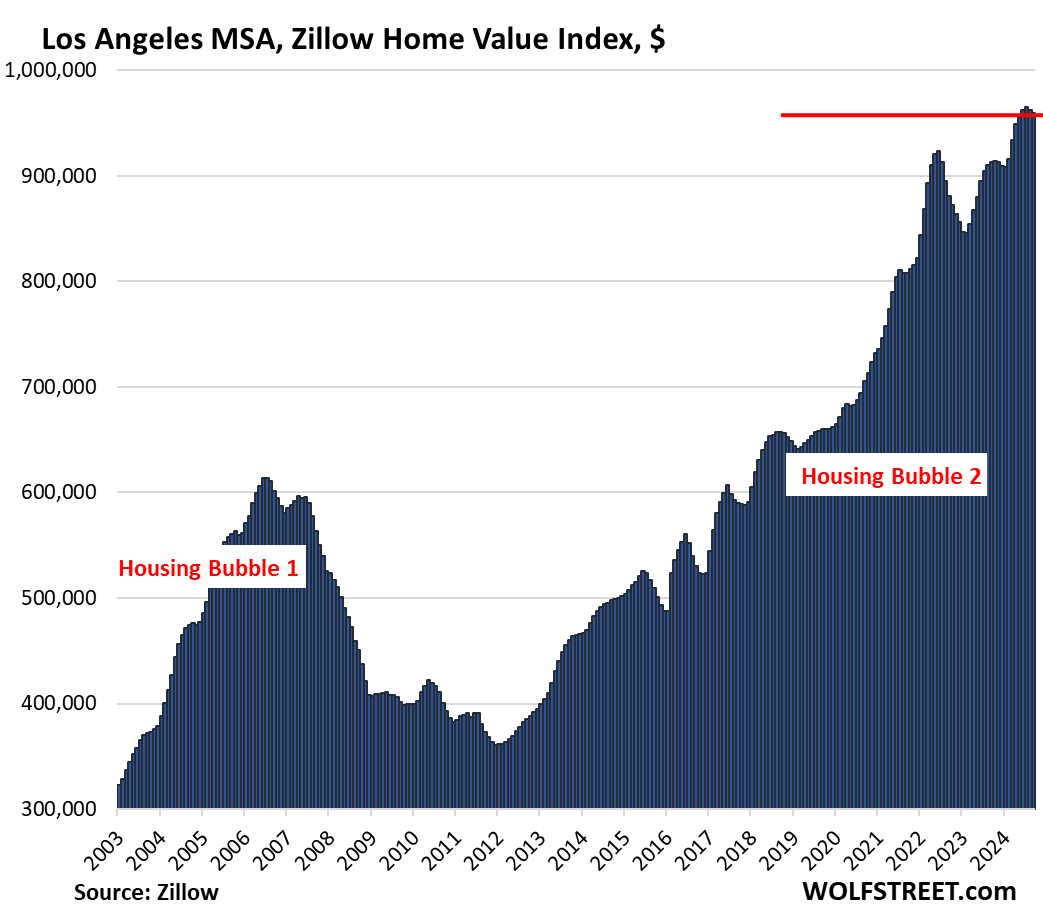
| Los Angeles MSA, Home Prices | ||
| MoM | YoY | Since 2000 |
| -0.3% | 5.1% | 332% |
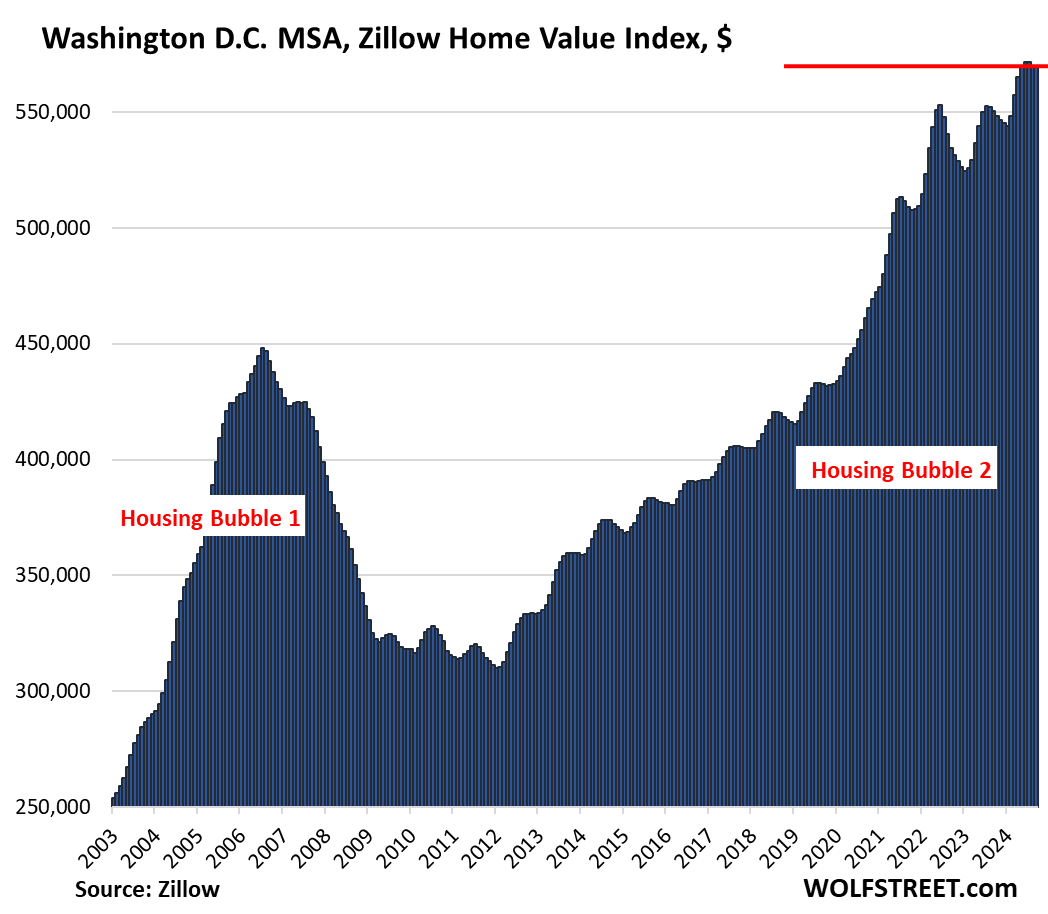
| Washington D.C. MSA, Home Prices | |||
| MoM | YoY | Since 2000 | |
| 0.0% | 3.5% | 215% | |
| Baltimore MSA, Home Prices | |||
| MoM | YoY | Since 2000 | |
| 0.0% | 2.5% | 175% | |
| Miami MSA, Home Prices | ||
| MoM | YoY | Since 2000 |
| -0.3% | 3.2% | 335.0% |
| Atlanta MSA, Home Prices | ||
| MoM | YoY | Since 2000 |
| -0.5% | 1.6% | 166% |
| Kansas City MSA, Home Prices | ||
| MoM | YoY | Since 2000 |
| -0.4% | 2.7% | 178% |
| Columbus MSA, Home Prices | ||
| MoM | YoY | Since 2000 |
| -0.4% | 3.2% | 155% |
| Boston MSA, Home Prices | ||
| MoM | YoY | Since 2000 |
| -0.3% | 5.2% | 228% |
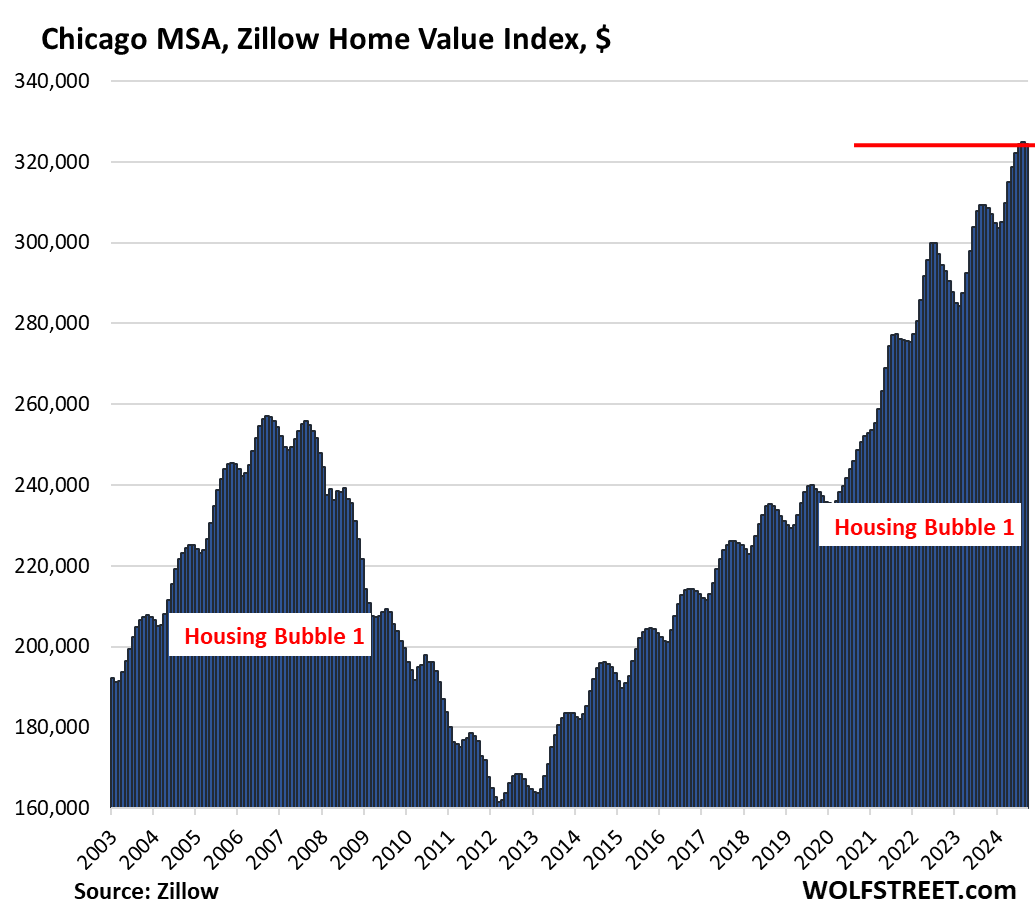
| Chicago MSA, Home Prices | ||
| MoM | YoY | Since 2000 |
| -0.2% | 4.9% | 114% |
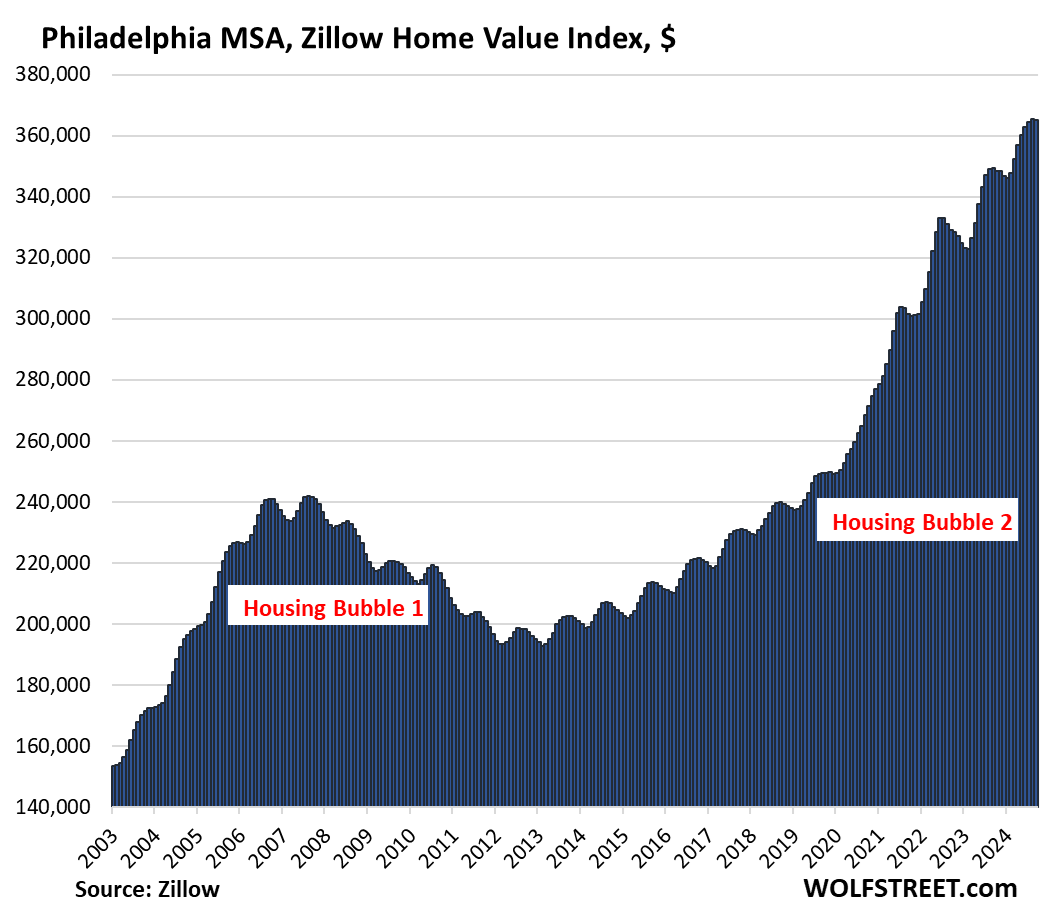
| Philadelphia MSA, Home Prices | ||
| MoM | YoY | Since 2000 |
| -0.1% | 4.5% | 202% |
| New York MSA, Home Prices | ||
| MoM | YoY | Since 2000 |
| 0.3% | 7.1% | 212% |
We give you energy news and help invest in energy projects too, click here to learn more


Be the first to comment