It’s said that history doesn’t repeat itself, but it often rhymes. Such is the case with the US energy industry and specifically, US LPG and LNG exports.
In the early 2000s, many energy experts believed that US energy production had seen its pinnacle and the country was destined to be an energy importer for as far as the eye could see. Lo and behold, the shale revolution dramatically changed everything, and by the early 20 teens, the US began to flip terminals around from imports to exports.
LPGs really led the way as propane and normal butane began to flow out of US terminals (the U.S. become a net exporter in 2012 [1]) to feed what would become an almost insatiable appetite for MMBtus. The US is now the largest global LPG supplier with export capabilities exceeding 75% of total domestic production. That’s no slouch to say the least!
Not long after, US LNG terminals flipped their switch, import terminals reversed flow capabilities and started down a very similar path becoming a net exporter in 2016.[2] Unsurprisingly, the US Gulf Coast is the primary source of export capacity, having a favored proximity to the prolific Permian and Haynesville basins. Not to be outdone, however, is the robust Appalachian basin featuring the Marcellus shale play, which has dramatically altered historical pipeline flows. This basin not only supplies local export capacity, at the likes of Cove Point LNG in Maryland, but also the same Gulf Coast terminals served by the Permian and Haynesville.
LNG Exports Expected to Continue Rising
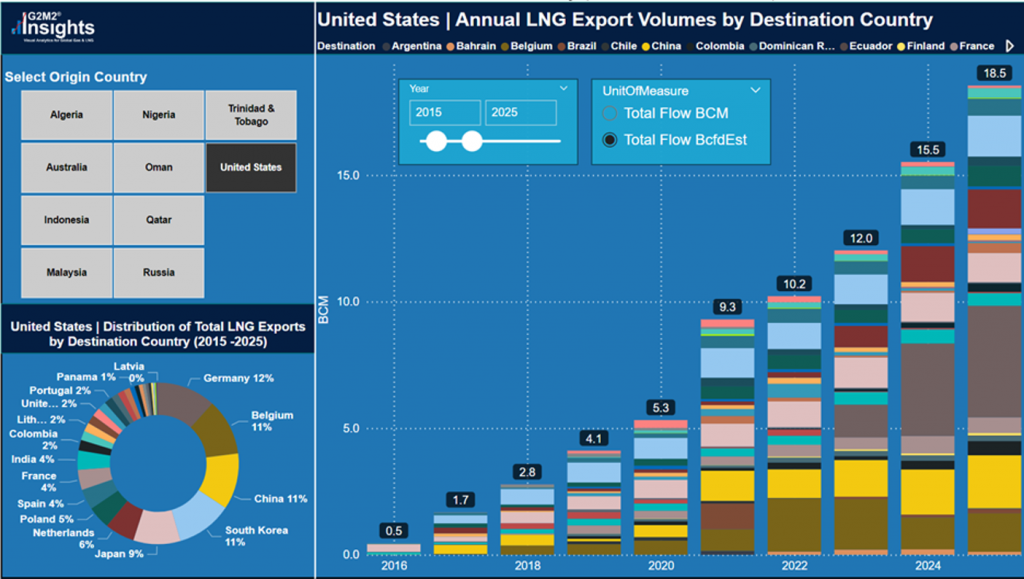
Excluding the starting point years pre-2019, LNG exports have more than doubled from 2019 to 2022. And as Newton taught us, a body in motion remains in motion. LNG exports continue to rapidly increase, expected to more than double again between 2022 and 2025.
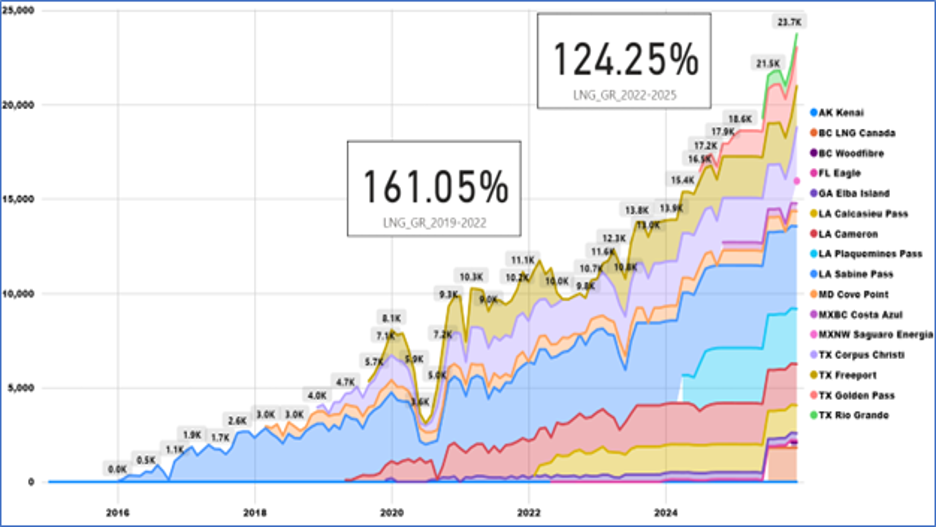
For simple math, let’s call current US domestic natural gas production 100 Bcf/d. At 11 Bcf/d of LNG exports (much lower than it would have been due to Freeport’s explosion mid-year 2022), that’s 11% of US production that can hit the water to serve global demand. By 2025 and near 24 Bcf/d, we’re now talking a pretty decent slice of the US production pie (call it 22 – 24% assuming production between 100 and 105 Bcf/d) – still not nearly as large as LPGs but again, no slouch!
Increased demand in Europe due to geopolitical factors and growth in Asia has caused many in the U.S. to call for more LNG exports, and even the U.S. president promised them to Europe in 2022.[3]
CEO of EQT, Toby Rice famously has been calling to “unleash US LNG”, where we would expect another doubling of US LNG exports in roughly the next 10 years, heading to well over 50 Bcf/d. In such a scenario, one would expect US domestic production would increase to well over the current 100 Bcf/d level. In fact, that’s inherent in EQTs assessment in order to keep domestic prices in check.
Even under a much more conservative forecast, where LNG exports reach nearly 25 Bcf/d, this would still dramatically shift the sectoral consumption dynamics. LNG exports would move to 3rd place in the demand stack, above residential and commercial demand (in fact about equal to their combined quantity), but still reasonably less than electric (ELC) and industrial (IND) sector demand.
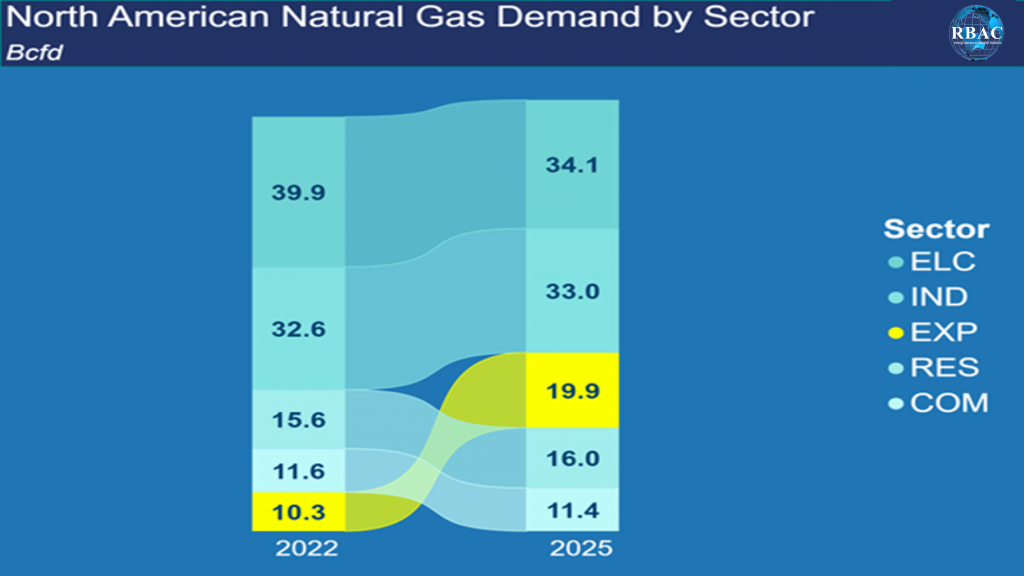
Peering beyond 2025 is outside the scope of this article, but it’s not far-fetched to imagine (as the “unleash US LNG” scenario does) that a decade later, LNG exports could rival or surpass the ELC and/or IND sectors.
But is this really a “build it and they will come” situation as was the case in the LPG export build-out? US producers would love such a Field of Dreams scenario, but the reality check is, is there really this much global demand? And if there were, could US supply compete?
Opportunities in the Global Market
It’s not farfetched for market participants to get excited about growth opportunities and plow incredible amounts of capital into infrastructure that then sits idle or is deployed at low utilization rates – China is currently realizing just such a situation. However, at least through 2025, global gas demand is expected to achieve levels sufficient to require and justify at least those projects that either have achieved FID (Final Investment Decision) or are on the cusp of having volumetric commitments to achieve FID soon.
Looking at last year, 2022, we see that significant LNG exports left the U.S. heading for Asia and Europe and more would have occurred if not for the Freeport accident that put the terminal out of commission in June 2022 for almost 9 months.[4]
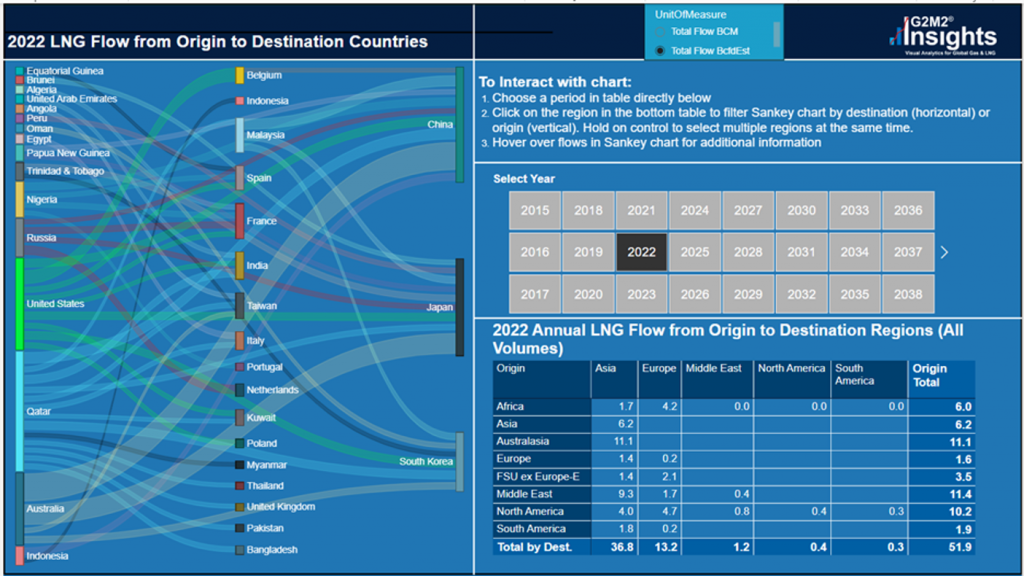
One need only look at global gas prices to see that there were tremendous arbitrage opportunities and had Freeport been up and running, these “arbs” would have been captured for at least another 1.5 Bcf/d in the latter half of 2022.
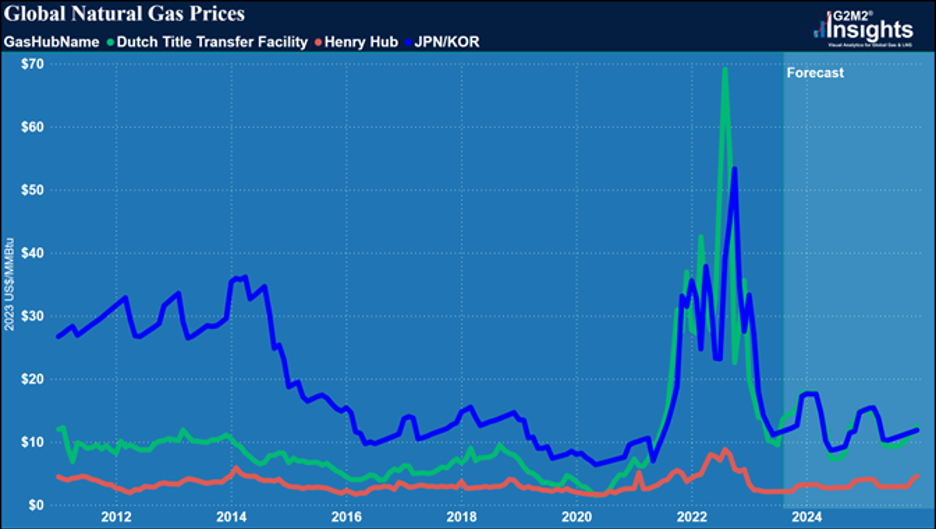
But was all the hoopla something that could also be expected going forward? The Russia/Ukraine war surely had major impacts on 2022 global gas flows and prices, and this largely continues to be the case. It seems quite unlikely that this situation will correct itself soon, and buyers have shifted their focus to ensuring more stable and safe gas supplies. Even with a stronger focus and push for “greener” energy sources, (though one could argue that the greenest current abundant source is truly natural gas[5]), buyers are not able nor willing to shift entirely off fossil fuels. Thus, natural gas remains a favored energy source – reluctant as some may be.
Worldwide Regasification Terminal Expansions
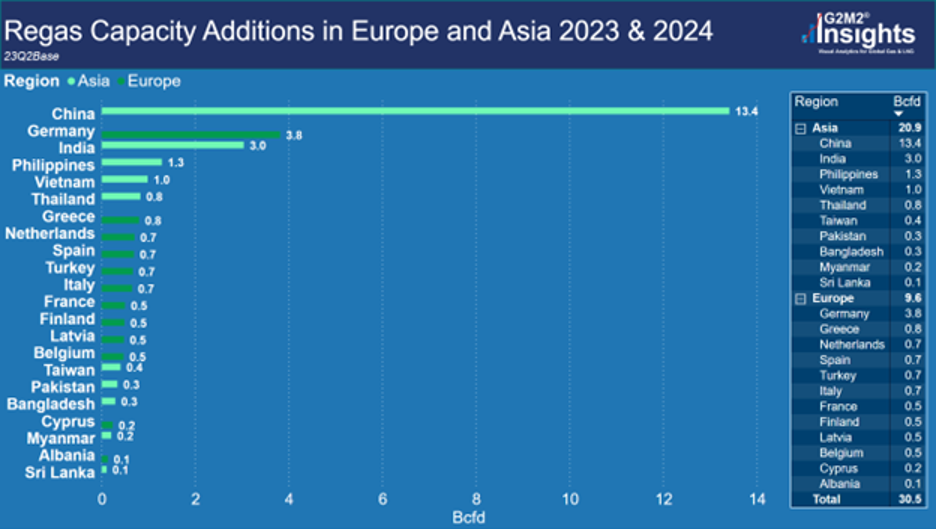
In evidence of the broad preference of natural gas globally are recent regas terminal expansions in Asia and Europe which are expected to increase by 20.9 Bcfd and 9.6 Bcfd, respectively, adding a total of 30.5 Bcfd of regas capacity by the beginning of 2025.
It is important to note, however, that Regas terminals rarely operate at full capacity. According to the IGU World LNG Report 2023, China’s regas annual utilization rate dropped from 83% in 2021 (a record high) to 63% in 2022. In contrast, European regas facilities generally operated at high utilization rates in 2022, with some facilities in France and Belgium operating above name plate capacity. Even if one assumes the new terminals will operate at 60% utilization, that still means a potential 18.3 Bcfd of new demand for LNG coming online by 2025.
Staying Ahead of the Market
So, it remains the world market requires more robust LNG exports from the largest suppliers – which directly benefits North America, and more specifically U.S. producers and exporters. Annual average expectations for 2025, call for U.S. LNG exports approaching 19.0 Bcf/d, with over 1/3 of the volumes heading to Asia (to include India).
Beyond 2025, things start to get murky. Although some, having jumped on a study by the IEA,[6] proclaim global fossil fuel demand will peak soon and renewables will be all the rage, continued geopolitical events, the large potential for demand growth in Asia[7] and the need for energy security almost everywhere, all seem to suggest that demand for natural gas will remain robust for quite some time. Thus, the likelihood for much larger North American LNG export volumes doesn’t seem too far-fetched.
RBAC’s market simulation products, including GPCM® and G2M2®, provide market participants user-friendly and efficient systems to test such varying scenarios. No doubt, we’re in curious times where tremendous uncertainty (geopolitical, regulatory, financial, etc.) and risks abound. RBAC is here to help bring clarity to decision-making and risk mitigation, be it domestically or globally. Let us help you with vetting history’s rhyming tendency and avoiding potential pitfalls and finding opportunities where they lie.