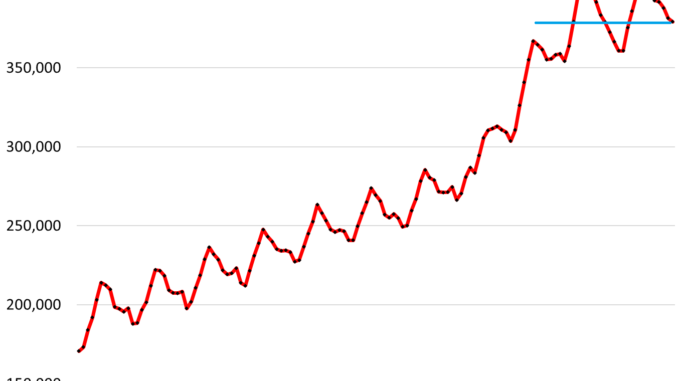
The median price of existing homes dropped further, high was June 2022, demand remains collapsed, active listings highest in 4 years, days on the market rise.
By Wolf Richter for WOLF STREET.
The national median price of existing homes – single-family houses, condos, and co-ops – declined to $379,100 in January, down by 8.4% from the peak in June 2022, according to data from the National Association of Realtors (NAR) today.
The year 2023 was the first year since the Housing Bust when the seasonal high in June was lower than the seasonal high and all-time high a year earlier (June 2022). Year-over-year, the median price in January was up 5.1% (historic data via YCharts):
This was based on deals that closed in January, many of which were made in December and November, when mortgage rates were careening lower, falling well below 7%. But things have changed this year, inflation turned out to be more resilient, the Fed has been pouring cold water on the rate-cut mania, mortgage rates have been rising for weeks, and currently are over 7% once again, and mortgage applications have re-plunged from already low levels. So this is what the housing market will have to deal with going forward.
Demand has collapsed.
The seasonally adjusted annual rate of sales ticked up to 4.0 million in January from 3.88 million in December, and was down 2% from the collapsed levels a year ago.
In the last few months of 2023, the rate of sales had been the worst since the two worst months of the Housing Bust in 2010. January was just a hair higher.
Sales compared to prior Januarys (historic data via YCharts):
From 2023: -2%.
From 2022: -37%
From 2021: -40%
From 2019: -20%.
From 2018: -26%.
Actual sales – not the seasonally adjusted annual rate – fell to 234,000 homes in January. But that was up 1.3% from a year ago.
Seasonally, January and February mark the bottom of the year in terms of closed sales, as they reflect in part deals over the holidays. June is usually when closed sales peak, reflecting deals made during the end of “spring selling season” in April and May. During the second half of the year closed sales decline (data via NAR):
Median days on the market jumped to 69 days in January before the homes were either sold or pulled off the market, according to data from realtor.com. This metric reflects in part how quickly sellers pull their listings off the market when they don’t get the hoped-for response.
Januarys are the high months. This is down a tad from January 2023, but above 2021 and 2022 (data via Realtor.com):
Supply of 3.0 months was about double from the low in January 2022, and was the highest for any January since 2020 when it was 3.1 months. This is adequate supply, but not ample supply (historic data via YCharts).
Active listings are always low this time of the year as sellers pull their homes off the market before the holidays, and they’re slow coming back on the market.
In January active listings at 665,000 were the highest since January 2020. Active listings are inventory minus homes listed as “sale pending” (2023 = red; 2019 = green; data via Realtor.com)
New listings at 295,000 were up a little from a year ago (2023 = red; 2019 = green; data via Realtor.com):
This market is still frozen, marked by collapsed sales despite mortgage rates that had fallen during the time many of the deals were made, amid adequate but not ample supply, rising days on the market, and a national median price that for the first time since the Housing Bust failed to make an all-time high in well over a year, as many potential buyers and sellers are trying to outwait this situation.


