The US oil and gas sector showed signs of resilience this week, with the total active rig count rebounding by 5 to reach 549 as of December 5, 2025, according to the latest data from Baker Hughes. This marks a reversal from the previous week’s decline and signals renewed drilling activity amid stabilizing energy prices. While the count remains down 33 rigs from the same period last year, the uptick—primarily driven by oil-directed rigs—offers a glimmer of optimism for the industry. In this article, we’ll break down the US rig count by state, basin, and type (oil vs. gas), examine global trends, highlight key companies adding rigs, and explore what this means for investors.
US Rig Count Breakdown
The Baker Hughes rig count, a key barometer of future oil and gas production, revealed a net increase this week, with oil rigs leading the charge. Here’s a high-level summary:
|
Category
|
Current Count
|
Weekly Change
|
Yearly Change
|
|---|---|---|---|
|
Total Rigs
|
549
|
+5
|
-33
|
|
Oil Rigs
|
413
|
+6
|
-38 (est.)
|
|
Gas Rigs
|
129
|
-1
|
+5 (est.)
|
|
Miscellaneous Rigs
|
7
|
0
|
N/A
|
The rigs added this week were predominantly for oil exploration and production, reflecting operator confidence in crude markets despite ongoing volatility. Gas rigs, on the other hand, saw a slight dip, possibly due to softer natural gas prices and ample storage levels.
By Basin
The Permian Basin, the epicenter of US shale activity spanning Texas and New Mexico, held steady but continues to dominate the landscape. Other major basins showed mixed results, with small gains in some areas contributing to the overall increase. Based on the latest available data (with Permian unchanged at 251), here’s a snapshot of key basins:
|
Basin
|
Current Count (est. Dec 2025)
|
Weekly Change
|
Notes
|
|---|---|---|---|
|
Permian
|
251
|
0
|
Remains the largest by far, accounting for nearly half of US rigs. Stable amid efficiency gains.
|
|
Eagle Ford
|
43
|
+4 (from recent trends)
|
South Texas focus; recent uptick in activity.
|
|
Haynesville
|
41
|
+1
|
Louisiana/Texas gas play; modest growth.
|
|
Williston (Bakken)
|
~30
|
+1 (est.)
|
North Dakota oil; incremental additions.
|
|
Anadarko
|
~25
|
0
|
Oklahoma basin; flat amid gas price pressures.
|
|
Other Basins
|
~159
|
+3 (net)
|
Includes DJ-Niobrara, Marcellus/Utica, etc.
|
These figures align with recent reports, where the Permian’s stability underscores its role as a low-cost leader, while smaller basins like Eagle Ford and Haynesville see targeted additions for oil and gas, respectively.
|
State
|
Current Count (est. Dec 2025)
|
Weekly Change
|
Primary Focus
|
|---|---|---|---|
|
Texas
|
~260
|
+2
|
Permian and Eagle Ford; oil-heavy.
|
|
New Mexico
|
~90
|
+1
|
Permian extension; oil rigs up.
|
|
North Dakota
|
~30
|
+1
|
Bakken shale; oil additions.
|
|
Oklahoma
|
~30
|
0
|
Anadarko; balanced oil/gas.
|
|
Louisiana
|
~30
|
+1
|
Haynesville; gas with some oil.
|
|
Other States
|
~109
|
0
|
Includes Pennsylvania (Marcellus), Colorado, etc.
|
Texas and New Mexico, home to the Permian, account for over 60% of the US total, highlighting the region’s outsized influence on national production.
Global Rig Count Overview
On the international front, Baker Hughes’ monthly data for November 2025 shows a total international rig count of 1,059, down 25 from October but up 109 from November 2024. This brings the estimated global rig count (including US and Canada) to around 1,800, a slight monthly decline but reflective of broader recovery trends year-over-year.
Key regional breakdowns for November 2025:
|
Region
|
Current Count
|
Monthly Change
|
Yearly Change
|
|---|---|---|---|
|
Latin America
|
~200
|
-5
|
+20
|
|
Europe
|
~100
|
-2
|
+10
|
|
Africa
|
~120
|
-3
|
+15
|
|
Middle East
|
~400
|
-10
|
+40
|
|
Asia Pacific
|
~239
|
-5
|
+24
|
Globally, the rig count has fallen modestly in recent months due to economic uncertainties and OPEC+ production cuts, but yearly gains suggest improving demand. Offshore rigs remain a bright spot, up slightly, while land-based activity mirrors US trends with oil leading over gas. Total global rigs are down about 164 year-on-year for oil-specific counts in some reports, but overall activity points to stabilization.
Companies Operating the Most Rigs and Recent Additions
While Baker Hughes doesn’t break down rigs by operator, cross-referencing with Enverus and industry reports reveals the top US oil and gas operators by average rig count in 2025. These E&P companies are likely behind the recent additions, focusing on high-return plays like the Permian.
Leading operators include:
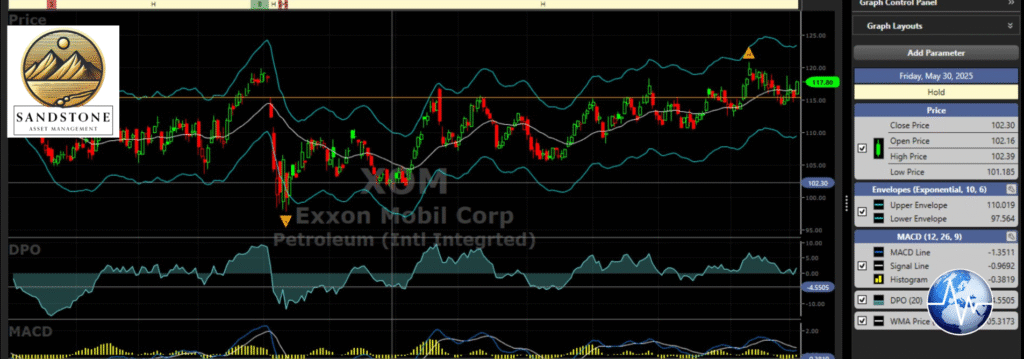
ExxonMobil: Operating ~50 rigs on average in 2025, with recent additions in the Permian post-Pioneer acquisition. Focused on oil.
ConocoPhillips: ~40 rigs; active in Eagle Ford and Bakken, adding oil-directed rigs amid strong cash flows.

EOG Resources: ~35 rigs; efficiency leader in multiple basins, contributing to the weekly oil rig uptick.

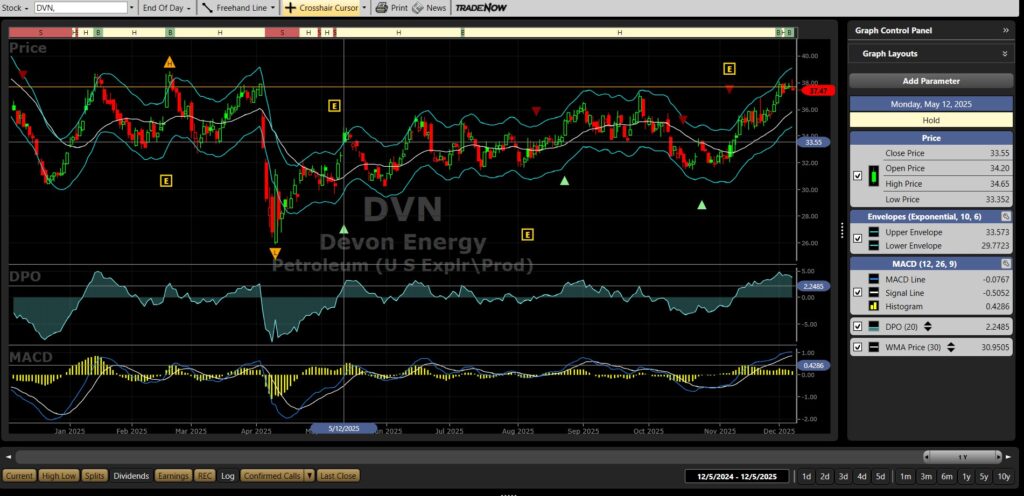
Devon Energy: ~30 rigs; Oklahoma and Permian focus, balanced oil/gas but leaning oil recently.
Occidental Petroleum: ~25 rigs; Permian heavyweight, potentially adding rigs as prices firm.

These companies have added the most rigs overall in 2025, with the December increase likely concentrated among Permian players like Exxon and Occidental. The additions are overwhelmingly for oil, as gas prices remain subdued below $3/MMBtu. Drilling contractors (rig providers) like Helmerich & Payne and Nabors Industries are benefiting, with higher utilization rates.
What This Means for Investors: Oil-Led Recovery Signals Opportunity
For investors, the rig count rebound is a positive indicator, suggesting operators are betting on sustained oil demand and prices above $70/barrel (WTI). The +6 oil rigs this week point to potential production growth in 2026, which could pressure prices if global supply outpaces demand—but in the short term, it’s bullish for energy stocks.
Key implications:Bullish for Oil Services: Companies like Baker Hughes, Halliburton, and SLB could see revenue boosts from higher activity.
E&P Upside: Top operators (e.g., Exxon, Conoco) with low breakevens may deliver strong returns, especially if efficiency gains keep costs down. US production hit record highs in 2025 despite lower rig counts, thanks to longer laterals and better tech.
Gas Caution: The -1 gas rig signals caution; investors in gas-heavy firms like EQT or Antero should watch storage and LNG export trends.
Broader Market: A rig comeback could support energy sector ETFs (e.g., XLE) amid geopolitical risks and winter demand. However, with global counts flat, oversupply risks linger if non-OPEC production ramps up.
Overall, this week’s data reflects cautious optimism. Investors should monitor upcoming EIA reports for production impacts, but the oil focus bodes well for diversified portfolios.
In summary, the US rig count’s comeback underscores the sector’s adaptability. As we head into 2026, keep an eye on prices and policy—energy remains a dynamic space for growth. Stay tuned to Energy News Beat for more updates.
Want to get your story in front of our massive audience? Get a media Kit Here. Please help us help you grow your business in Energy. Our Ads also get through the ad blockers.

https://energynewsbeat.co/request-media-kit/
We have specials going on, so ask Stu for details.